PacketScan™ – Real-Time Network Traffic Monitoring and Analysis
PacketScan™ is a carrier-grade network monitoring and analysis solution for telecom, enterprise, VoIP, and mission-critical IP networks. Available as both a Multi-Function Client (MFC) GUI and a browser-based PacketScan Web™ interface, it delivers real-time packet capture, protocol analysis, Packet Data Analysis (PDA), and IP Analytics™.
Request a Demo / Quote Brochure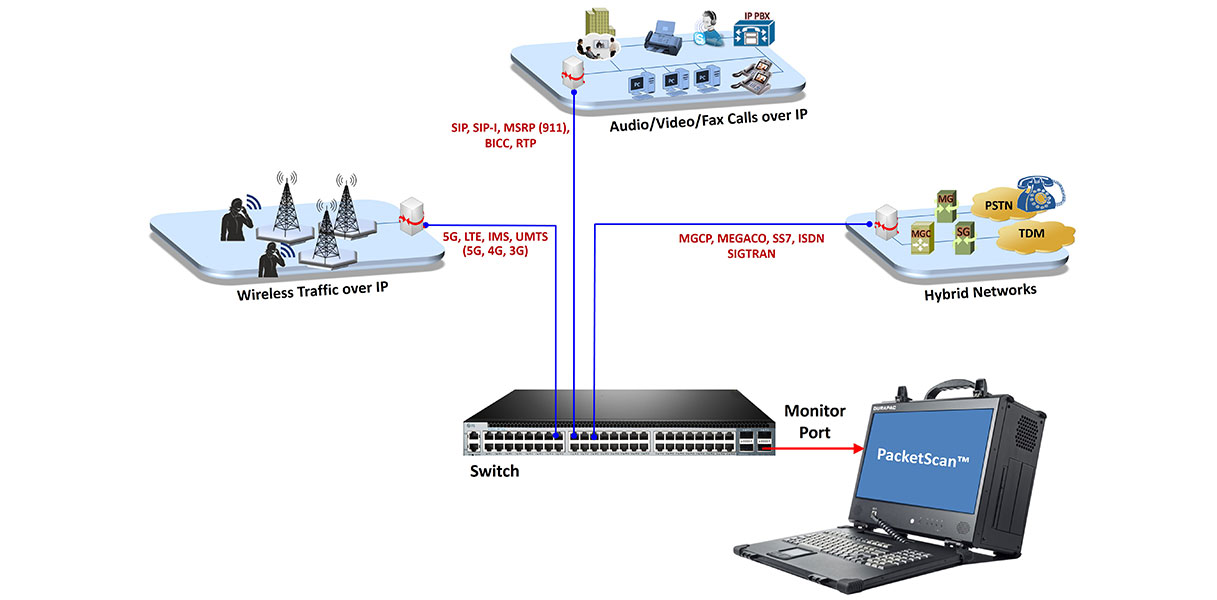
Overview
As next-generation IP networks continue to carry voice, video, fax, messaging, and data services, network operators require continuous monitoring of Quality of Service (QoS), signaling, and network performance to ensure reliable service delivery and rapidly troubleshoot network issues.
GL’s PacketScan™ is a carrier-grade packet capture, protocol analysis, and network monitoring solution that captures and analyzes live and recorded IPv4 and IPv6 traffic. Supporting VoIP, wireless, and IP protocols, it provides deep protocol decoding, Packet Data Analysis (PDA), IP Analytics™, traffic statistics, and comprehensive reporting for telecom, enterprise, and mission-critical communication environments.
PacketScan™ is available in multiple deployment options:
- PacketScan™ (Windows® MFC GUI) – Standalone software supporting real-time and offline packet capture and analysis on standard NICs up to 1 Gbps
- PacketScan Web™ (Windows® and Linux®) – A browser-based, multi-user platform for centralized management of distributed PacketScan™ Probes, enabling remote packet capture, protocol analysis, Packet Data Analysis (PDA), and IP Analytics™
- PacketScan™ HD – A high-density monitoring appliance with 4×1 GigE, 2×10 GigE, and 2×40/100 GigE interfaces for high-speed traffic capture and analysis
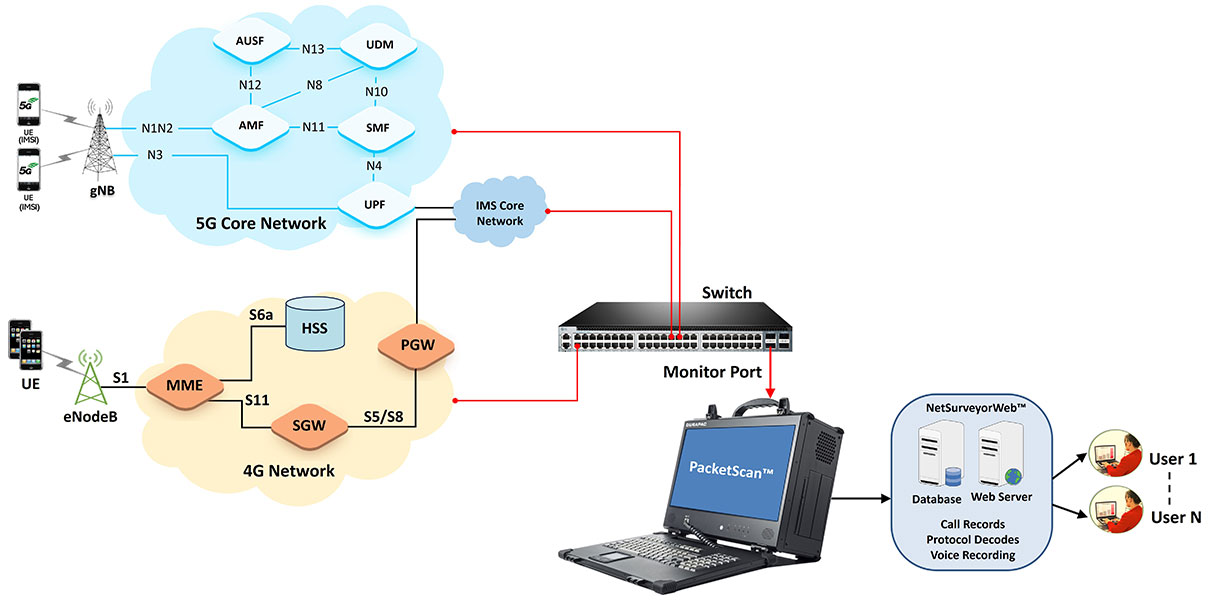
Integrated Packet Data Analysis (PDA) decodes and correlates signaling and media traffic to reconstruct complete call and session flows while generating detailed statistics, ladder diagrams, and Call Detail Records (CDRs). It supports protocols across 5G/4G, VoIP/IMS, 3G/2G, and SIGTRAN, and analyzes traffic captured from IP, T1/E1, T3/E3, OC-3/STM-1, and OC-12/STM-4 transmission networks.
PacketScan Web™ extends these capabilities through a centralized client-server architecture, providing secure browser-based access, distributed Probe management, remote monitoring, and REST API integration for scalable network analysis across enterprise and service provider environments.
Key Features
PacketScan™ provides unmatched network intelligence by seamlessly correlating signaling and media flows across multiple nodes and interfaces. This delivers a comprehensive, subscriber-centric view of each session—from initiation through termination.
- Unified Multi-Technology Monitoring
Monitor signaling across a broad range of technologies, including 5G (N1/N2, N3, N4, N11–N13), 4G (S1AP, eGTP, Diameter), IMS (SIP), 3G (IuCS, IuPS), 2G (GSM A, Gb), and SIGTRAN (ISUP, MAP, BICC, CAMEL). Generate intuitive call-flow diagrams that visualize the complete subscriber journey across these technologies - Encrypted Control Plane Visibility
Decrypt 5G and 4G NAS signaling on monitored interfaces to eliminate blind spots in encrypted control planes - Automated CDRs and Centralized KPI Analytics
Automatically generate structured Call Detail Records (CDRs) for each session. These can be fed into NetSurveyorWeb™ to create enterprise-wide dashboards, perform historical trend analysis, enable root-cause filtering, and deliver cross-network KPI reporting - PCAP Export for Forensic Analysis
Extract complete signaling sessions into standard PCAP files for offline troubleshooting, vendor escalation, or compliance archiving. With PacketScan™, operators gain true, end-to-end visibility into subscriber sessions—enabling proactive monitoring, faster troubleshooting, and reliable performance assurance across all network generations
- Continuous real-time capture and decoding without interruption
- Handles very large trace files, up to terabyte sizes, ensuring scalability for long-term monitoring
- Designed for 24/7 operations in live carrier networks and enterprise environments
- Simultaneous monitoring of up to 30,000 calls, scalable beyond 50,000 calls. (PacketScan™ HD)
- In-depth VoIP call monitoring including call flow, call quality, and failure reasons
- Support for a wide range of audio codecs: AMR, AMR-WB, EVRC, EVRCB, EVRCC, EVS, OPUS, and more. Option to record and playback the voice
- Real-time computation of voice quality metrics such as:MOS (Mean Opinion Score), R-Factor, Jitter, Delay, and Packet Loss
- MOS is periodically calculated during the call to highlight Good, Average, or Poor quality calls
- Extract fax images from T.38 sessions
- Automatically detect and act on events of interest:
Send email alerts, Save call trace or call detail records (CDR) in CSV, Record calls selectively - Apply conditions such as whitelisted numbers, failed calls, degraded MOS, or specific QoS issues to capture only relevant traffic
- Graphical statistics on live traffic including:
Call volumes and KPIs,Call flows and success/failure rates, Voice quality graphs (jitter, delay, MOS, R-Factor) - Intuitive dashboards for real-time monitoring and post-capture analytics
PacketScan™ is also available as a web-based monitoring solution.
- Supports running multiple instances simultaneously across different network interfaces or locations
- Each instance can be remotely invoked, managed, and monitored using a lightweight web client
- Provides operators with centralized access to captures, analysis, and statistics without requiring physical access to the system
- Ideal for distributed deployments, enabling NOC teams, field engineers, and remote users to collaborate on live monitoring and troubleshooting
- Protocol distribution statistics – visualize traffic breakdown by protocol type (e.g., IP,UDP,TCP,HTTP, FTP, DNS, SIP, RTP, GTP, etc.)
- IP endpoint transactions, throughput and bandwidth utilization
- TCP connection analytics – open, closed, and orphan connections for IPv4/IPv6
- Enables operators to detect anomalies, optimize bandwidth usage, and validate service-level performance across live or recorded traffic
- Monitor Air-to-Ground, Ground-to-Ground and Recorder communications
- Analyze Push-to-Talk and Squelch sessions for reliability and QoS
- Supports RTP header extension decoding and R2S Keep Alive monitoring per ED-137 specifications
- High-speed wirespeed packet capture and lossless recording, supporting up to 800 Gbps across multiple Ethernet interfaces with nanosecond time precision.
- It supports Ethernet interfaces across 1G, 10G, 25G, 40G, 50G, 100G, 200G and importantly, the latest 400G Ethernet interfaces for ultra-high-speed network traffic capture
- Optimized distributed disk operations with massive storage capacity (up to 240 TB NVMe SSDs) for reliable, continuous high-volume traffic recording
- Flexible hardware-based filters with stackable logic, enabling deep inspection and selection of traffic by protocol, packet type, or header fields at wirespeed
- Real-time capture statistics and multi-port monitoring, providing detailed reports on bandwidth usage, frame counts, errors, link status, and packet drops for each interface
- Advanced and selective protocol traffic extraction and slicing, with secure export to standard formats (PCAP, PCAPNG, HDL), compatible with analysis tools like Wireshark and GL’s PacketScan™
- Browser-based access from any authorized client system
- Available on Windows® and Linux®
- Centralized management of multiple remote PacketScan™ probes
- Multi-user collaborative packet capture and protocol analysis
- Integrated Packet Data Analysis (PDA) and IP Analytics™
- REST APIs for automation and third-party integration
- Download trace, configuration, and log files directly from PacketScan Web™ probes for offline analysis and archival
Use Cases Across Industries
- Telecom Service Providers & Operators
- Monitor 5G, 4G, IMS, 3G and 2G subscriber activity in real time
- 5G/4G NAS decryption when security parameters are available
- Track call drops, registration failures, and mobility/roaming events
- Assure QoS (Quality of Service) parameters for voice, video, and data services
- Support billing verification and regulatory compliance
- Equipment Vendors & Network OEMs
- Validate and troubleshoot core and access network elements (e.g., gNodeB, eNodeB, IMS, EPC, 5GC)
- Perform interoperability testing between multi-vendor systems
- Analyze protocol behavior and signaling correctness during lab trials or field deployments
- VoIP & Unified Communications Providers
- Monitor SIP/RTP-based voice and video calls for quality, performance, and failures
- Ensure voice quality (MOS, jitter, delay, packet loss) meets SLAs
- Extract call statistics, audio streams, and fax images (T.38) for troubleshooting
- Optimize QoS and QoE in enterprise VoIP networks
- Data Center Monitoring and Field Deployments
- Data Center Monitoring for troubleshooting, performance analysis, and forensic investigation of high-speed Ethernet traffic
- Field Deployments providing portable packet capture for live events, service provider installations, and rapid network troubleshooting
- Enterprises & Mission-Critical Networks
- Monitor corporate IP traffic (protocol distribution, data rates, endpoint interactions)
- Detect anomalies and performance degradation across TCP/IP services
- Centralized monitoring via web-based multi-instance remote access
- Air Traffic Management (ATM) & Defense Communications
- Monitor Air-to-Ground, Ground-to-Ground and Recorder communications
- Analyze Push-to-Talk and Squelch sessions for reliability and QoS
- Regulatory & Lawful Interception Agencies
- Provide end-to-end subscriber/session visibility across multiple technologies
- Enable detailed call-flow reconstruction with voice playback and recording for captured sessions. Concatenated SMS content extraction and unicode SMS decode
- Store terabyte-scale trace data securely for compliance, audits, and investigations
- Web-Based Enterprise Network Monitoring
- Service Providers and Large Enterprises deploy PacketScan Web™ to monitor traffic across multiple network locations from a centralized interface. Distributed probes capture traffic locally, while engineers access analysis results remotely via the browser interface — improving operational efficiency, troubleshooting response time, and collaboration across teams.
PacketScan™ : Applications
- 5G Protocol Analyzer – Decodes signaling across N1, N2, N4, N8, N10, N11, N12, and N13 interfaces, correlating control- and user-plane sessions, and generating KPIs for registration, session setup, handover, and QoS in 5G Core networks.
- 4G LTE Protocol Analyzer – Tracks EPC signaling and bearer establishment over S1, S3, S4, S5/S8, S6a, S10, S11, interfaces, correlating attach, session management, and mobility procedures.
- VoIP / IMS Protocol Analyzer – Decodes SIP, SDP, RTP, RTCP, MSRP, and related IMS signaling; correlates voice and video sessions, extracts RTP streams, and reports QoS metrics such as jitter, delay, MOS, and packet loss.
- 3G UMTS Analyzer over IP – Correlates signaling and RTP voice streams across IuCS (circuit-switched) and IuPS (packet-switched) interfaces, providing detailed call flows, QoS, and performance statistics.
- 2G / 2.5G GSM Protocol Analyzer – Decodes signaling between MSC–BSC (A-interface) and BSC–BTS (Abis-interface) over IP backhaul, with support for RTP call tracing, timing, and call-quality metrics.
- SIGTRAN Analyzer over IP – Provides SS7 and ISDN signaling analysis over IP (M2PA, M3UA, SUA, and IUA), offering detailed message decoding, call/session tracing, and per-layer protocol statistics.
- PacketScan Web™ integrates IP Analytics™ to deliver advanced traffic intelligence for TCP/IP networks. It provides comprehensive analysis of endpoints, conversations, TCP and UDP sessions, bandwidth utilization, and protocol distributions, enabling engineers to quickly identify packet loss, retransmissions, latency, failed connections, congestion, and other network performance issues for faster troubleshooting and root-cause analysis.
See Protocol List for more details.
- All traffic supported – Digits, Tones, Voice, Video, Fax Live monitoring IPv4 and IPv6 networks
- Listen audio data of a session in real-time
- Perform power, frequency, spectral, tone and digit analysis
- Monitor / record audio data of a session to files (QuickTime *.qt format)
- Video Statistics provides a measure of Video Call Quality in IP networks; these include Media Type, SSRC, Packet Statistics, Average Delay/Gap, Video Frame count, Frame rate, Media Delivery Index (MDI- (Delay Factor: Media Loss Rate)), and Average MDI for each session
- Fax T.38 and Video calls
- Monitors QoS (quality of service) on voice and video calls
- SIP ED-137/ED-138 for Air Traffic Monitoring (Air-to-Ground, Ground-to-Ground calls, and Record interface)
- Operating System - Windows® 11; Linux (Red Hat and Ubuntu)
What sets apart PacketScan™ is its ability to collect vital statistics about calls for theoretically infinite time. The ability of PacketScan™ to capture data is limited only by the hard disk capacity of the PC. It can work with NetSurveyorWeb™ and NetSurveyorWeb™ Lite, a web-based central monitoring system for a comprehensive view of network performance. It features rich graphics, ladder diagrams and CDRs (Call Detail Records). NetSurveyorWeb™ is an easy plug-and-play system that collects data, segregates, and provides comprehensive analysis of network health, detailed protocol monitoring with historical data retention.
Main Features
| Capacity |
|
| Web-based interface |
|
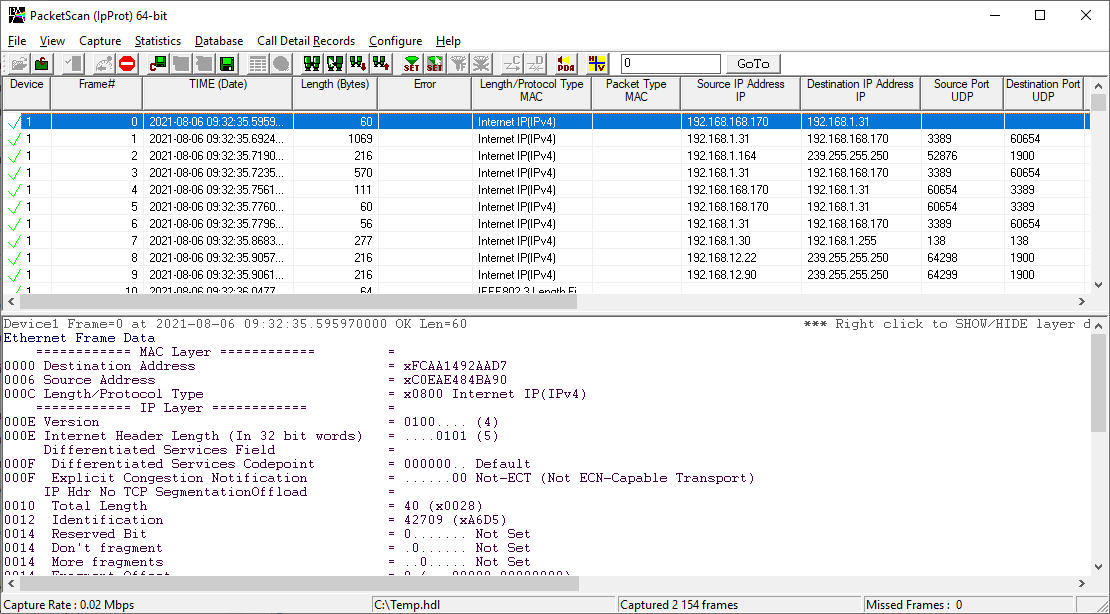
| Real-time and Offline Analysis Screen Shot of Real-time Analysis |
|
| Call Detail Records Screen Shot of Call Detail Record and Statistics View |
|
| Statistics |
|
| Supported Protocols |
|
| Supported Codecs | Almost all industry standard codecs supported. For more information, please see "Voice Codec" webpage. |
| As a stand-alone tool |
|
| As a Probe with Central Monitoring System - NetSurveyorWeb™ | PacketScan™ can send protocol fields, and call detail records, along with traffic summary of captured calls to a central database. NetSurveyorWeb™ displays the data from the database in a simple web-based browser, featuring rich graphics, custom search, report and filter configurations. |
| As a Single Point Packet over IP CDR Analysis System | PacketScan™ HD can work with GL’s VoiceBand Analyzer and Call Detail Records applications to generate call detail records as CSV files and voice files for each direction. The call detail records are used for further analysis using built-in Excel® tools. |
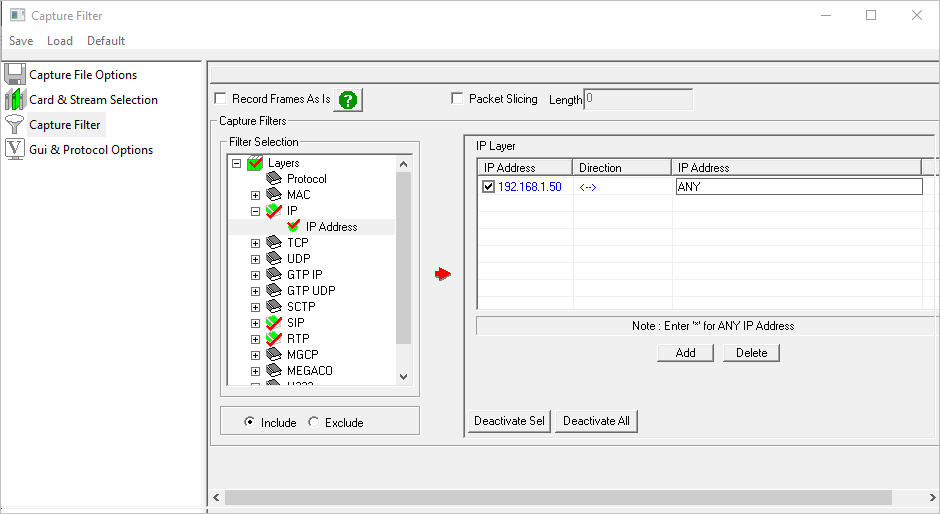
| Filtering and Search Screen Shot of Real-time Capture filter Screen Shot of Offline View Filter |
|
| Packet Data Analysis |
|
| Performance Metrics |
|
| QOS Parameters |
|
| Triggers and Actions |
|
| Traffic (Digits, Audio, Video, Fax) Handling |
|
| SIP Registration Details |
|
| Utilities |
|
PacketScan™ software can be easily integrated with any type of PC platforms, including regular laptops, portable handhelds, and 1U rackmounts.,
Following variants of PacketScan™ are available:
- As a Stand Alone Tool for Real-Time Analysis (PacketScan™)
- As an Offline Analysis Tool (PacketScan™)
- High-Density Packet Monitoring Tool (PacketScan™ HD)
PacketScan™ HD is an high density multi-protocol 2U rack mounted network monitoring appliance w/ 4x1GigE (PKV120) and w/2x10GigE (PKV122) to capture and process high volumes of communication protocols over IP and Wireless
For more information please visit "High-Density Packet Monitoring Tool" webpage.
- ATM Network Quality Monitoring Tools per ED-138
GL's PacketScan™ - an All-IP Network Monitoring software offers powerful features to capture and monitor live signaling and traffic over IP. It captures, decodes, segregates, monitors and collects statistics on all IP calls, as per EUROCAE ED-138. Ease of viewing Ground-to-Ground calls and Air-to-Ground sessions is possible
- As a Probe with Central Monitoring System (NetSurveyorWeb™)
PacketScan™ can be deployed as a centralized monitoring system with associated relational or Oracle database. PacketScan™ can send Summary Fields, Frame Octets, and Call Detail Records to database along with Traffic Summary for the captured calls
For more information please visit "NetSurveyorWeb™ Live Demo" webpage.
- As a Probe with simplified web-based Monitoring system (NetSurveyorWeb™ Lite)
PacketScan™ can be integrated with NetSurveyorWeb™ Lite version, which is a simple web-based client and works at the probe level, as an addon tool to enhance the features of protocol analyzers enhancing the capability to handle larger volume of data, filter for specific calls, build custom statistics and KPIs, automate and graphical analysis features to analyze the call detail records (CDRs) in depth. It is an easy plug-and-play system that collects data, segregates, and provides comprehensive analysis of network health, detailed protocol monitoring with historical data retention up to 9 GB
Detailed Packet Analysis
Packet Data Analysis (PDA) is an outstanding tool for live monitoring of signaling and traffic over IP. Packet Data Analysis (PDA) is distributed with GL’s Packet Analyzers, allowing users to monitor live IP networks including capture, analysis, and reporting of every call in detail. Supported protocols include SIP, MEGACO, MGCP, H.323, SCCP, RANAP (UMTS IuCS), GSM A, CAMEL, BICC, ISUP, MAP, Gb, and GTP. It can capture IP packets over different transmission lines, including IP, T1, E1, T3, E3, and OC-3 STM-1 / OC-12 STM-4. PDA then processes the captured packets, identifies, and segregates calls based on signaling and traffic parameters.
PacketScan™ provides in-depth real-time and post-process data investigation. The PDA view assists in any comparisons that are to be made between the two RTP sessions. Packet Data Analysis (PDA) view displays call information in graphical format (Traffic Analyzer Call Quality Matrix- Summary View) as well as in tabular format (RTP Diagnostic - Detail View).
Graphs
Graphs are provided for key statistics for network monitoring and troubleshooting. Graphs available include – Active Calls, Average Jitter, E-Model MOS/R-Factor/Packets Discarded, RTP Packets Summary, ladder diagram for T.38 based fax calls and call signaling, Gap, Jitter, Gap/Jitter Distribution, Wave and Spectral Display for media stream analysis, VoIP calls and more.
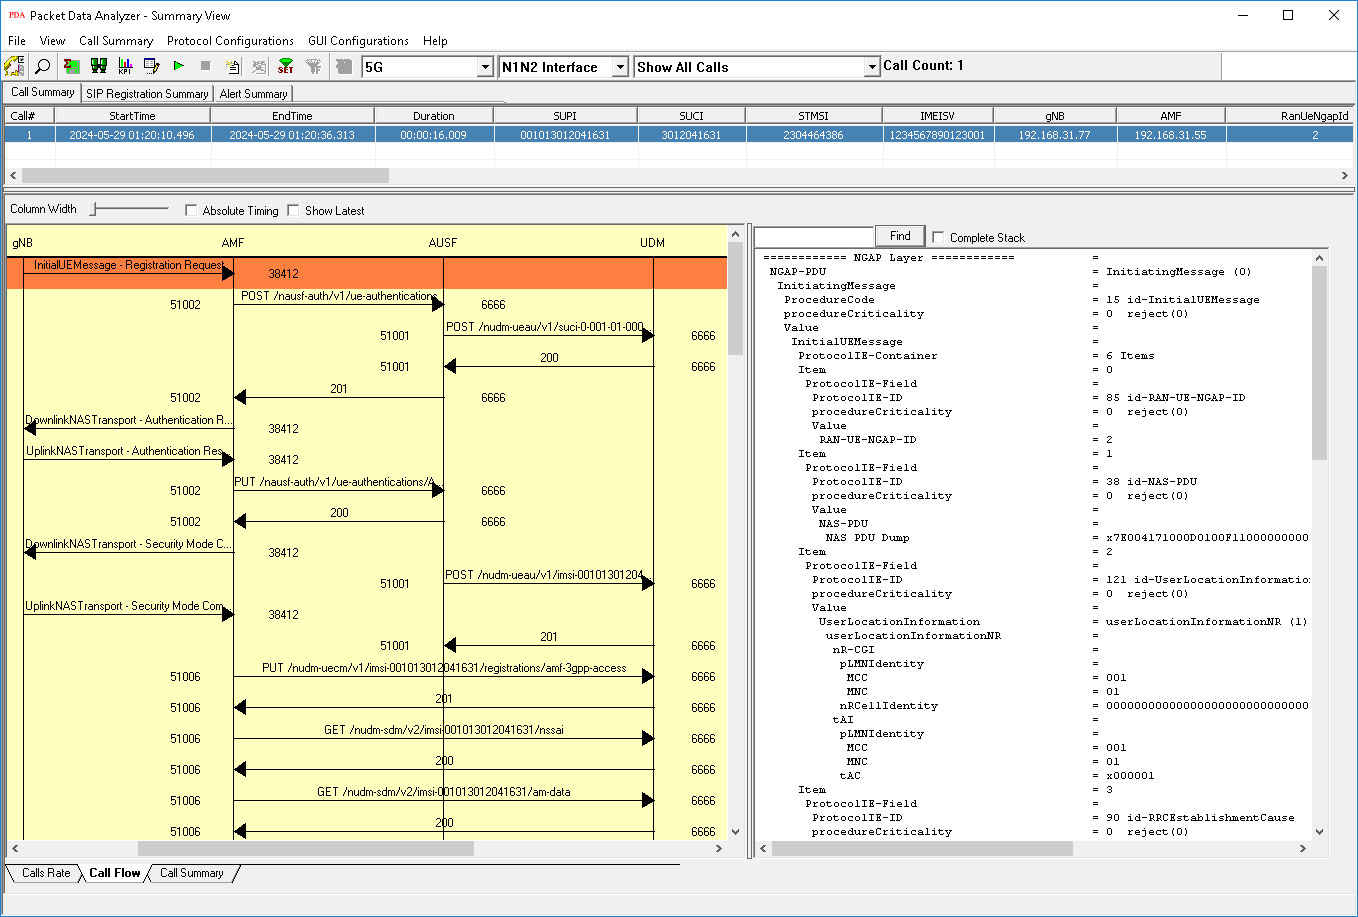
5G N1N2 Call Graph
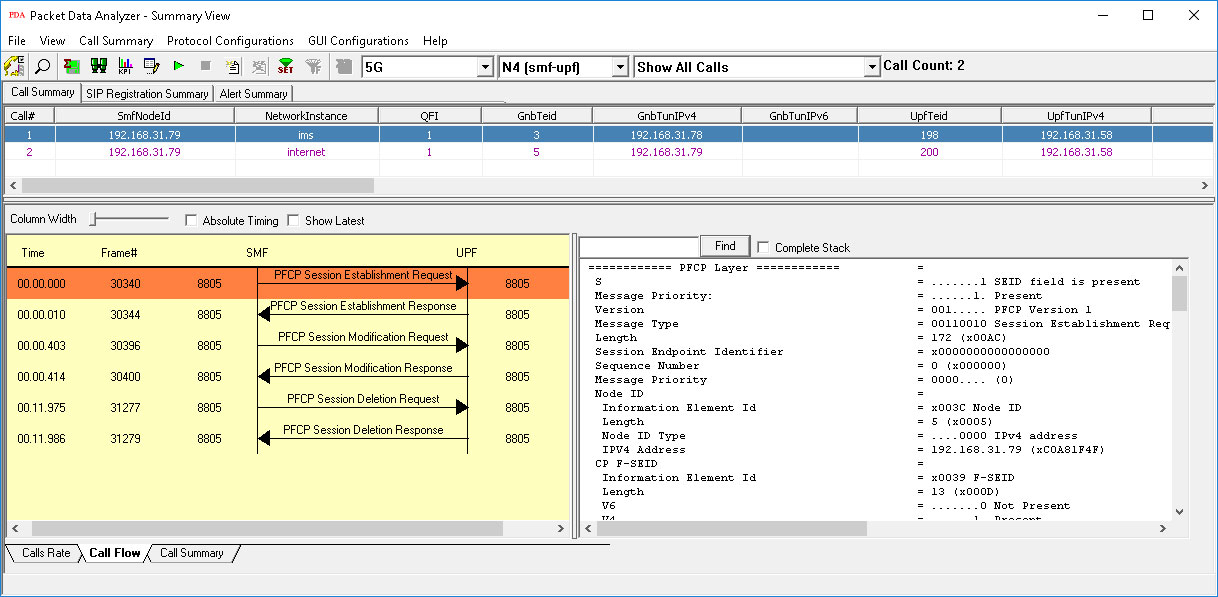
5G N4 Call Graph
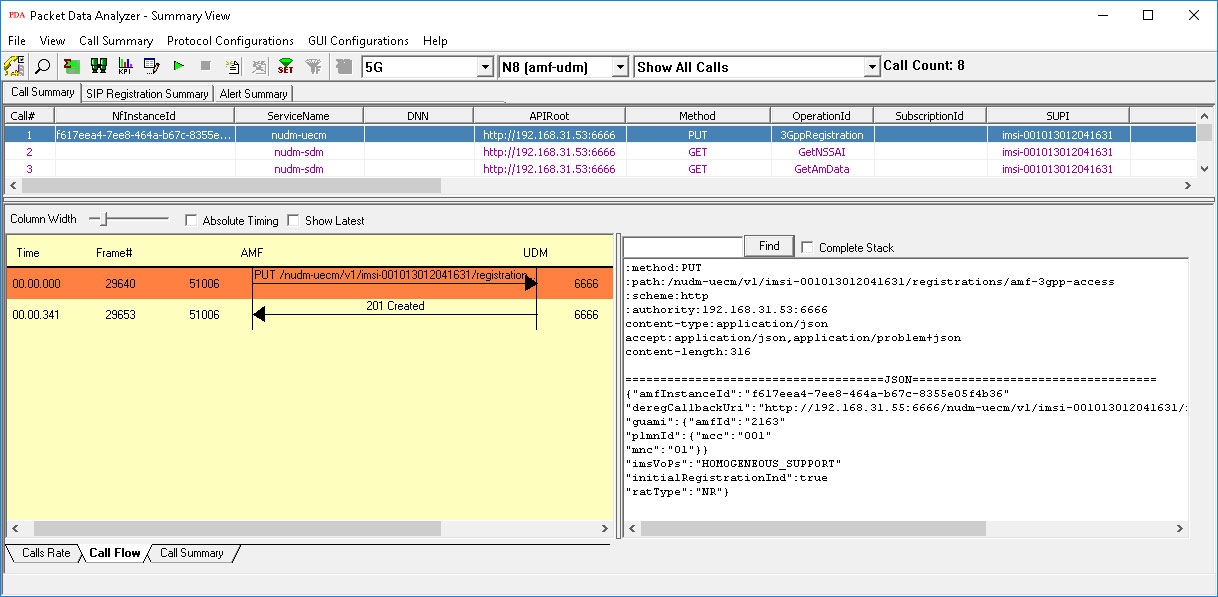
5G N8 Call Graph
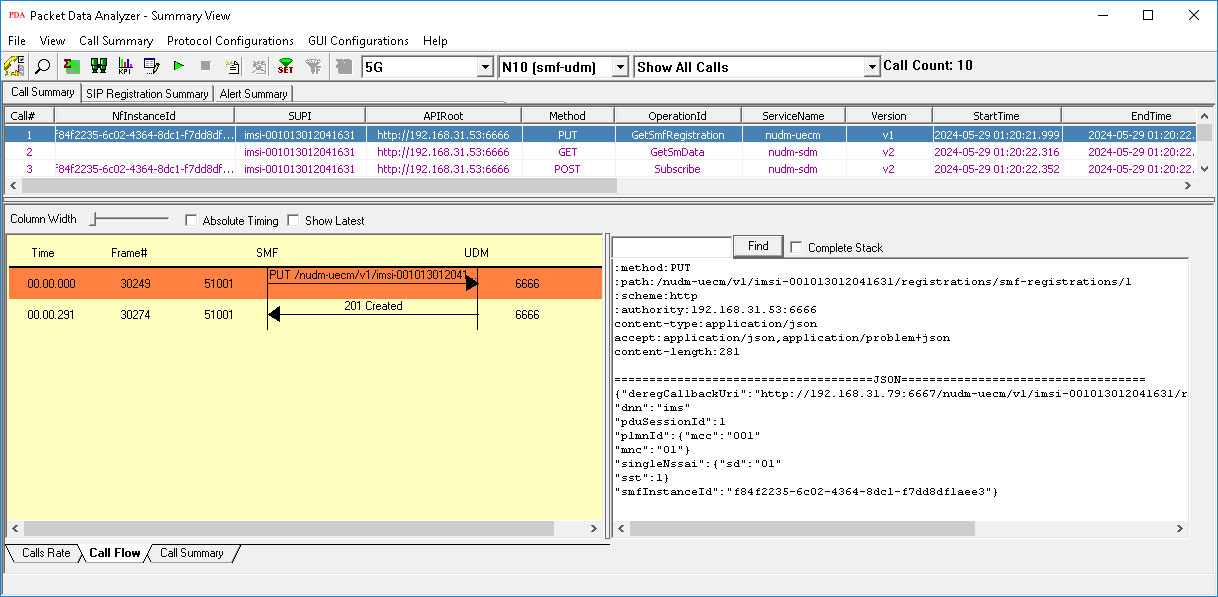
5G N10 Call Graph
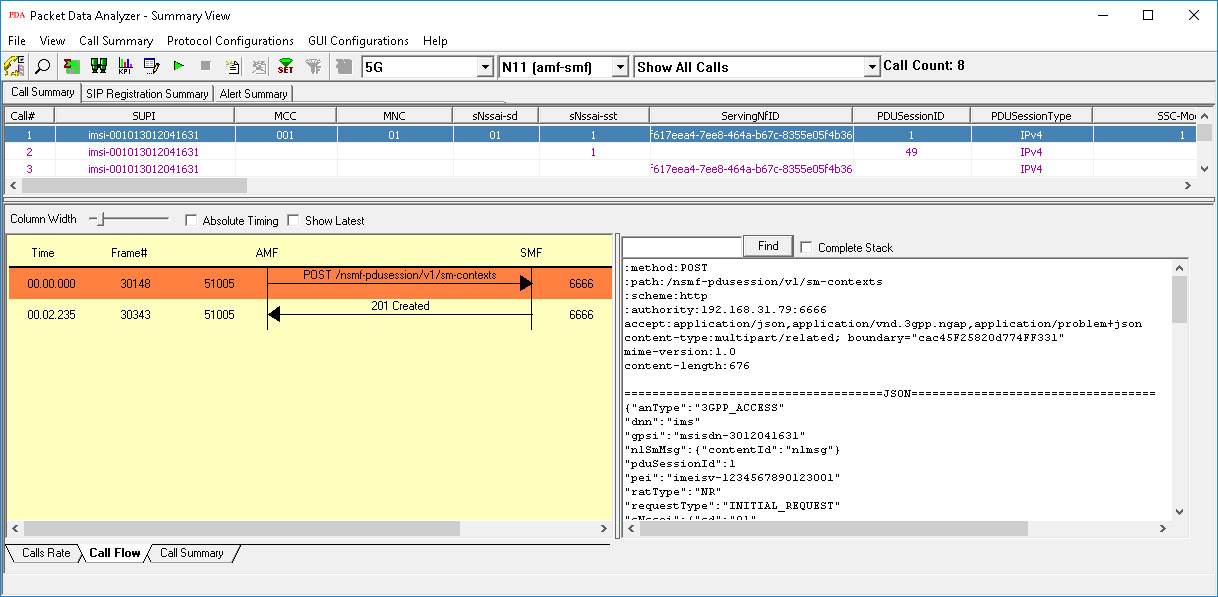
5G N11 Call Graph
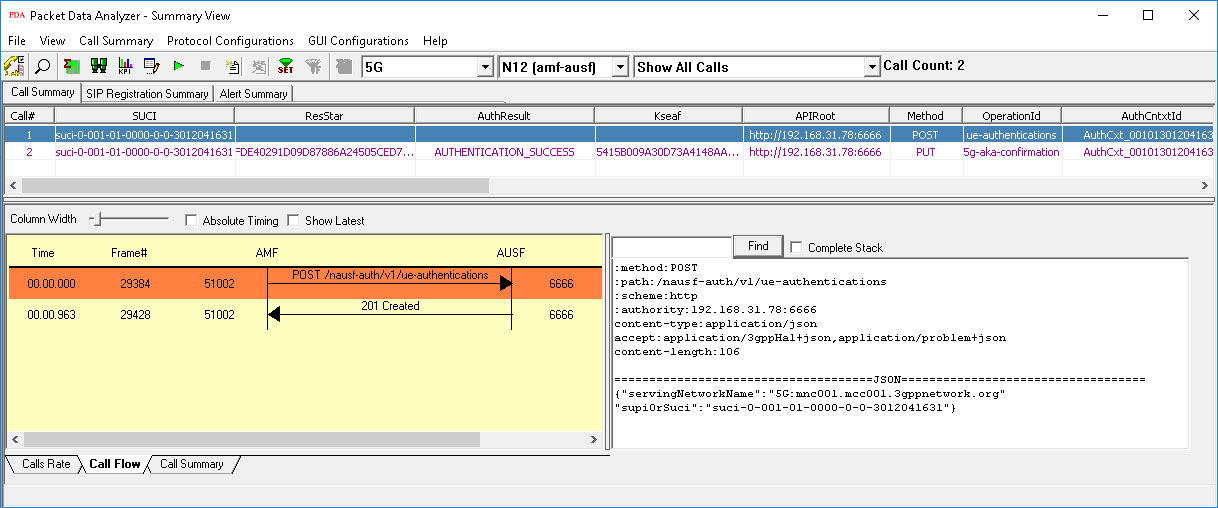
5G N12 Call Graph
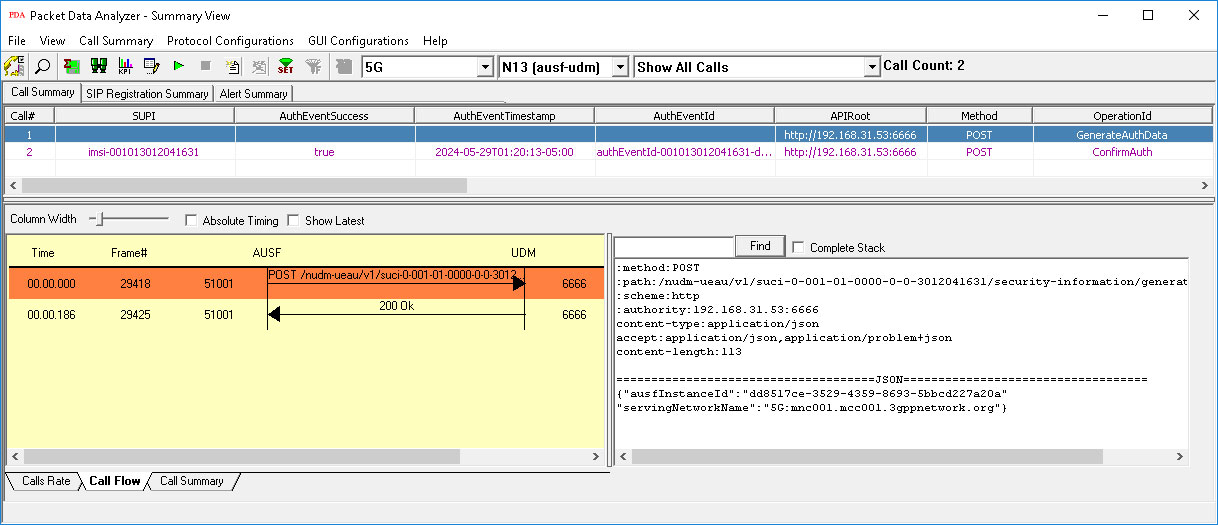
5G N13 Call Graph
Active Calls Graph
Average Jitter Distribution Graph
Call Graph
MEGACO Call Graph
SIP ED-137 Call Graph
H.323 Call Graph
GSM A IP Call Graph
UMTS IuCs Call Graph
RTCP Details Screen
Gap Graph
Jitter Graph

Gap Distribution Graph
Jitter Distribution Graph
Full Duplex Wave Graph
CDR Report Generation
PacketScan™ can generate PDF reports summarizing all calls or a certain subset of the calls captured. The PDA Summary View can also export all terminated call details as a text file (CSV format) during the live capture. This feature requires activating the Export Terminated Calls option from PDA prior to live capturing. This structured text file can be imported into Excel® using a custom add-in (Excel-Dashboard-Tool-IP.xlsm) to generate different chart types such as call volumes, call duration, call failure causes, CMOS, LMOS, packet loss and more.
For more details, refer CDR Analysis Tools webpage.

PDA Completed Calls Report in CSV
PDA Summary PDF Report
Performance Metrics
- Call Summary displays signaling, audio, and video QoS parameters for each call.
Signaling parameters include Caller & Callee id information, call duration, session information (Establishment Ratio, Establishment Effective Ratio, Session Defects, Ineffective Session Attempts, Completion Ratio, Request delay, Post Pickup Delay), and so on.
Audio parameters include media type, packet count, jitter, delay, gap, MOS, R-factor, lost packets, and so on.
Video QoS parameters such as Video Channels, Codec Info, SSRC, Frame Count, Packet Count, Packets Lost, Frame Rate, Media Delivery Index (Delay Factor : Media Loss Rate), Average Media Delivery Index are calculated for all video calls - Detailed statistical information are provided for Inband (DTMF & MF )events, RFC 2833 events, RTP/RTCP packet count and reports per direction, Duplicate and Missing Packets
Call Summary - Signaling, Audio, and Video Parameters
RTP and RTCP Statistics
- Calculates minimum, maximum, and average Round Trip Delay (RTD) values for SIP calls
- Call Quality Of Service (QoS) for all calls with E-Model based (G.107) Mean Opinion Score (MOS) and R-factor with individual and summary statistics presented in graphical and tabular formats
E-Model Graph - R Factor, MOS,
Packet
discarded graphs in PDA Summary View
RTP Packets Graph
MOS Graph
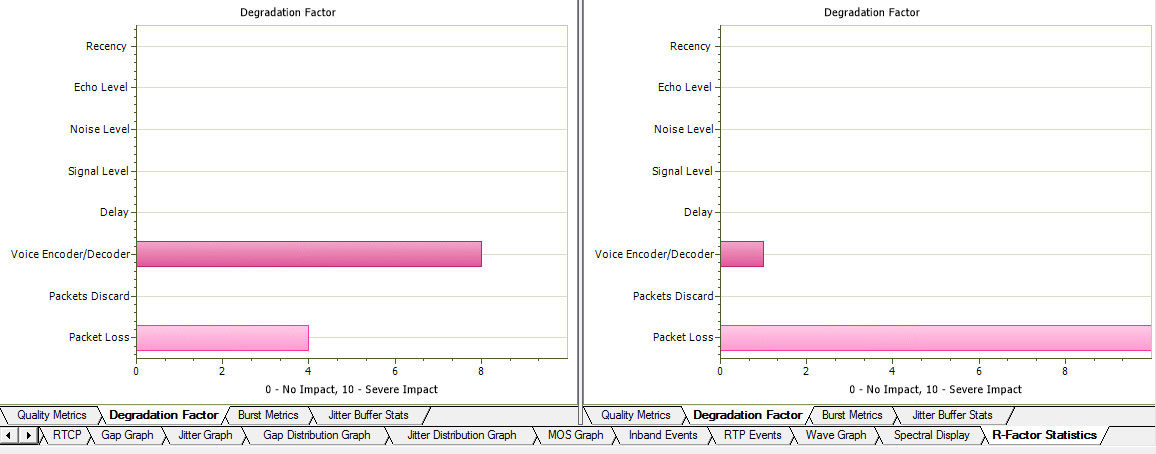
Degradation Factors
Quality Metrics
Burst Metrics
Jitter Buffer Statistics
- User can get real-time call trace for SIP Sessions and on H225 calls
Triggers and Action Feature
- Supports triggers and action feature to further filter calls based on certain protocol parameters followed by a set of actions for the completed calls. Some of such parameters are MOS, R-factor, jitter, packet loss, duplicate packets, or called / calling numbers
- The actions include saving a call to a file, recording the audio to a file, sending an email, generating an alert summary, creating Call Detail Records, viewing custom calls in summary view, and extracting fax images from the captured calls in TIFF format
- Users can specify the file formats of calls as *.hdl, *.pcap, *.pcapng, and/or *.wav format. Call Detail Record outputs 3 CSV files, call master record, call side record, and call events record, along with the voice file recordings for each direction. These files can be used with GL's Voice Band Analyzer, and Call Data Records for further analysis and retrieval of calls of interest
Triggers and Action Settings
- Alert Summary - Generates alerts when particular vital parameters go beyond a specified value. The Alert Summary provides an active list of the alerts that have occurred during the test session
Alert Summary View
Traffic Handling Features (Fax, Digits)
- T.38 fax calls
PacketScan™ software supports capturing and decoding of Fax (T.38 data) calls over VoIP. PacketScan™ fax decodes can be viewed in the form of T.38 call graph and call summary with decoded information for all T.38 messages received on the call. The captured fax calls by PacketScan™ can also be analyzed using GLInsight™ by saving the fax calls directly in (*.PCAP) Ethereal file format. T.38 has been enhanced to reassemble the fragmented data and to identify the T.30 message from it. Identified T.30 message is displayed in the T.38 ladder diagram.
PacketScan™ also allows users to extract fax image in the TIFF format from the selected fax call in either GL's proprietary *.HDL file format or in Ethereal *.PCAP file format.
T.38 Analysis over IP
Extract Fax Image
- Real-Time Digit Capturing
PacketScan™ provides a means for digit examination and capturing. An easy-to-read window indicates the direction of the captured digits along with the duration, power and frequencies. DTMF, MF and User-defined digits/tones are fully supported.
Real-Time Digit Capturing Window
Audio Handling Features
- Play to Speaker
Play To Speaker application allows the user to play the RTP streams of a call to the PC speaker using a soundcard. A host of options such as Jitter Buffer settings, As Is, Audio Mixing and so on are available for users to play a live call in real-time or play captured voice files.
Play Jitter Options
- Write To File
Various options are provided to save captured calls and use the files with voice quality analysis software to calculate the mean opinion score of the call. This application writes the RTP stream to a file in *.wav format.
Write to File
- Save Call
Supports Save Call feature to save successful and failed calls in either in GL’s proprietary *.HDL file format, Ethereal *.PCAP file format, or *.PCAPNG file format. Call Summary details could also be saved for a particular call and this will be saved as a *.rtf file. This allows the users to get data from real-time traffic locations for detailed analysis of a flawed call.
Save Call
Video Quality Metrics
Support Video Statistics such as Source/Destination Video Channels, Media Type, SSRC, Average Delay/Gap, Packet Counts, Codec Type, Missing Packets, Delay, Gap, Video Frame Count, Out Of Sequence count, Duplicate Packets count, Media Delivery Index (MDI- (Delay Factor : Media Loss Rate)), and Frame Rate are provided for each video session. PacketScan™ with Voice, Data, and Video QoS capability addresses customers long felt need of call quality analysis in IP networks.
Media Delivery Index (MDI) measurement is used as a diagnostic tool or as a quality indicator for monitoring a network intended to deliver applications such as streaming media, MPEG video, Voice over IP, or other information sensitive to arrival time and packet loss. Media Delivery Index (MDI) can be used to monitor both the quality of a delivered video stream and to show system margin for IPTV systems by giving an accurate measurement of jitter and delay at network level (Internet Protocol, IP), which are the real causes for quality loss. The Media Delivery Index is typically shown as two numbers separated by a colon the Delay Factor (DF) and the Media Loss Rate (MLR).
Call Summary – Signaling, Audio, and Video Parameters
Registration Summary
Packet Data Analysis is enhanced to display the SIP registration information in tabular as well as graphical format in Registration Summary. This interface displays the SIP registration information in a tabular format which includes user agent, registrar, registered time, status, time to live (TTL), expiry time, remaining time, Registration Request Delay (RRD) and Registration attempts for each user agent. In addition, it displays the active registration graph of the entire registration summary and provides the trace display of each registration.
Registration Summary
Include graphs that display the active registration and registration trace message sequences of registered calls at the bottom of the registration summary. The registration statistics display the count of the total, completed, failed, & active registrations along with registration and de-registration packet count.
Registration Active Graph
Registration Trace
VoIP Key Performance Indicators (KPI)s Report
KPI Report for SIP Calls
The SIP Call Summary KPI Report includes KPIs for the following: -
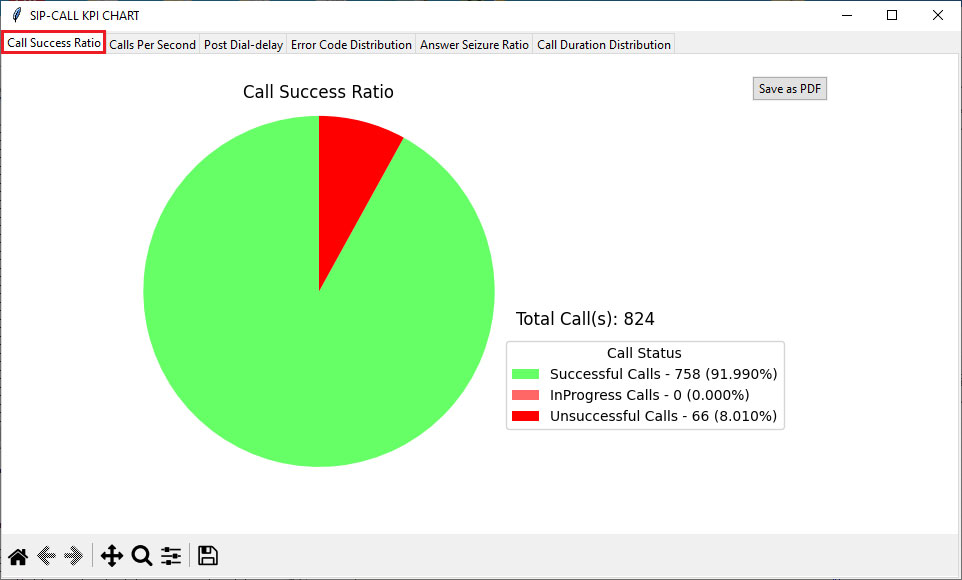
Call Success Ratio:
(graph depicting the counts and percentages of successful and unsuccessful calls.)
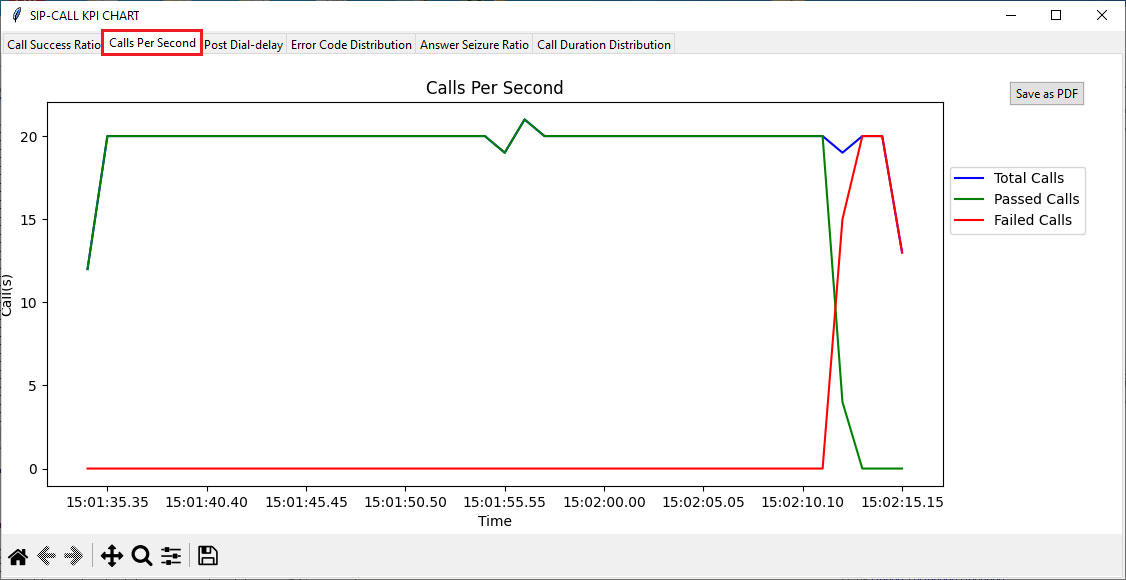
Calls Per Second:
(graph for Total Calls per second, Passed Calls per second, and Failed Calls per second.)
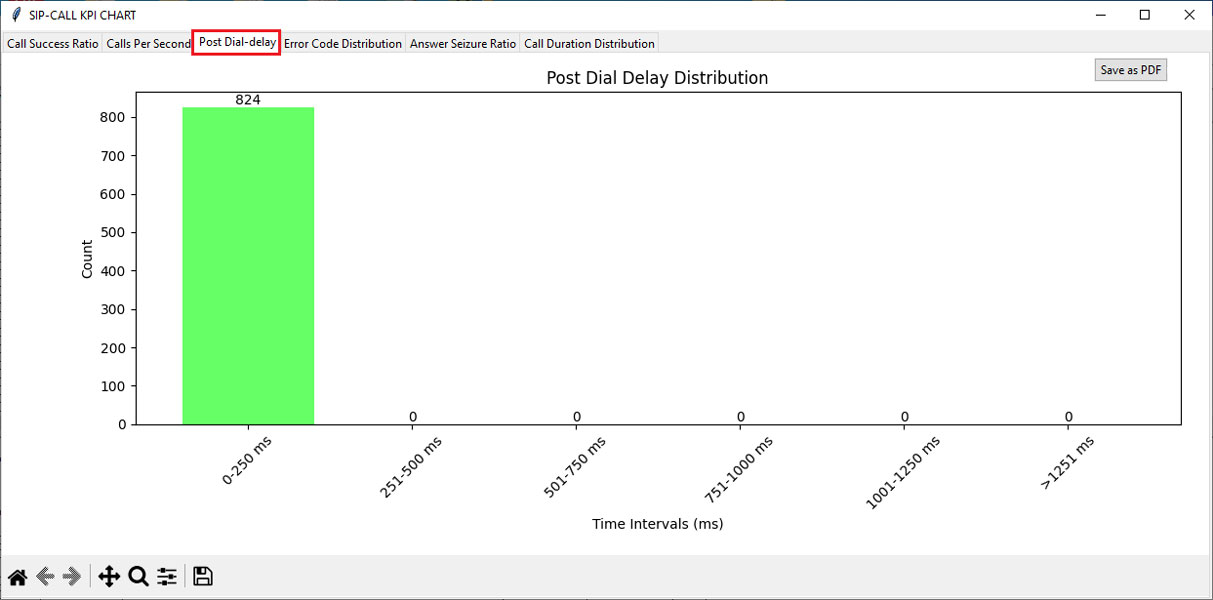
Post Dial-Delay Distribution
(graph for delay counts in milli seconds (0-250ms, 251-500ms etc.).)
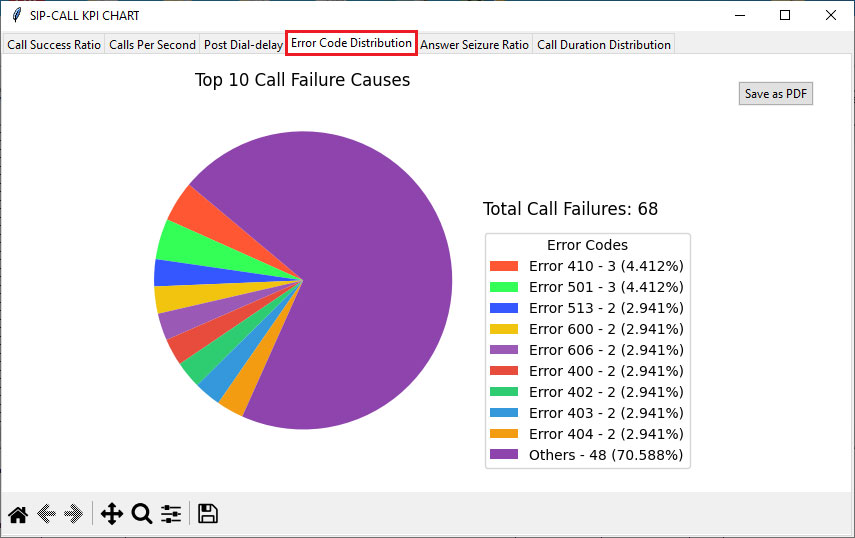
Error Code Distribution
(graph for the Top 10 Call Failure Causes counts and percentage (%).)
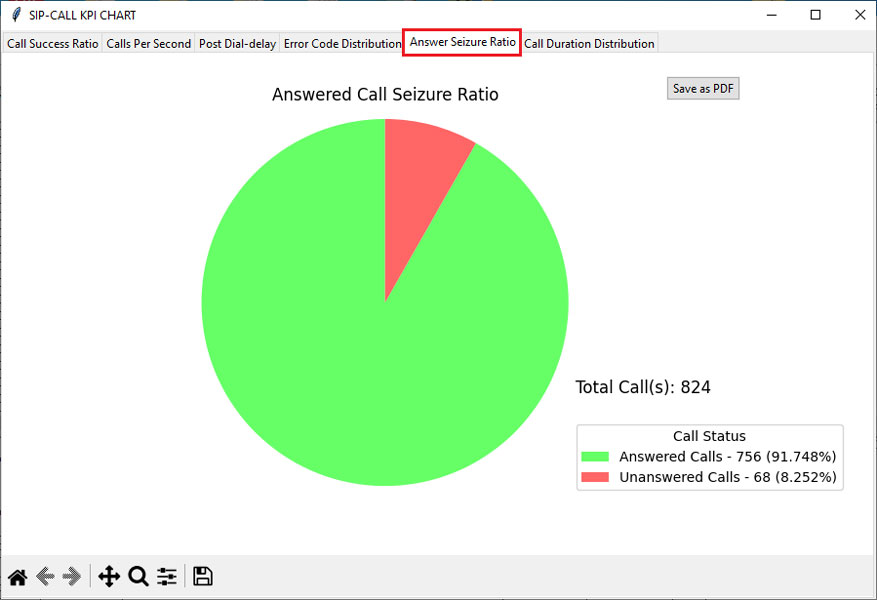
Answer Seizure Ratio
(graph representing counts and percentages of Answered Calls and Unanswered Calls.)
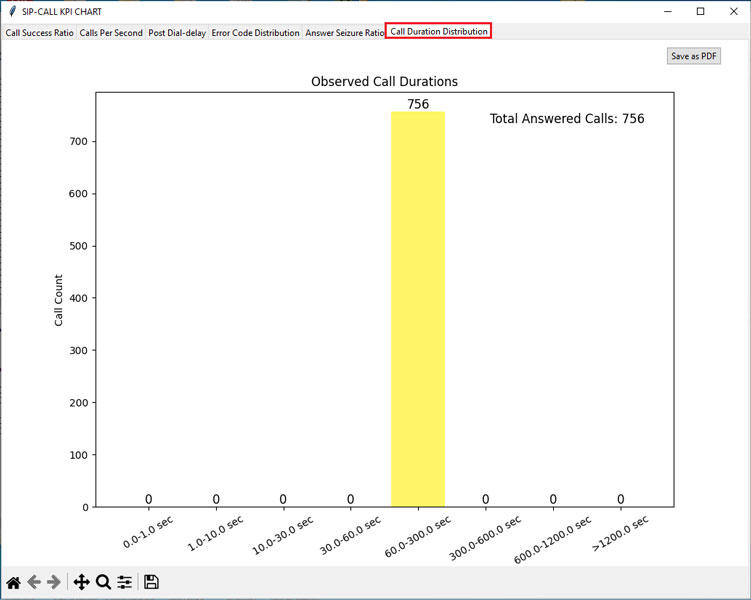
Call Duration Distribution
(graph depicting call counts for different call duration values (e.g., 0-1 sec, 1-10 sec, and so on).)
KPI Report for SIP Registration
The SIP Registration Summary KPI Report includes KPIs for the following:
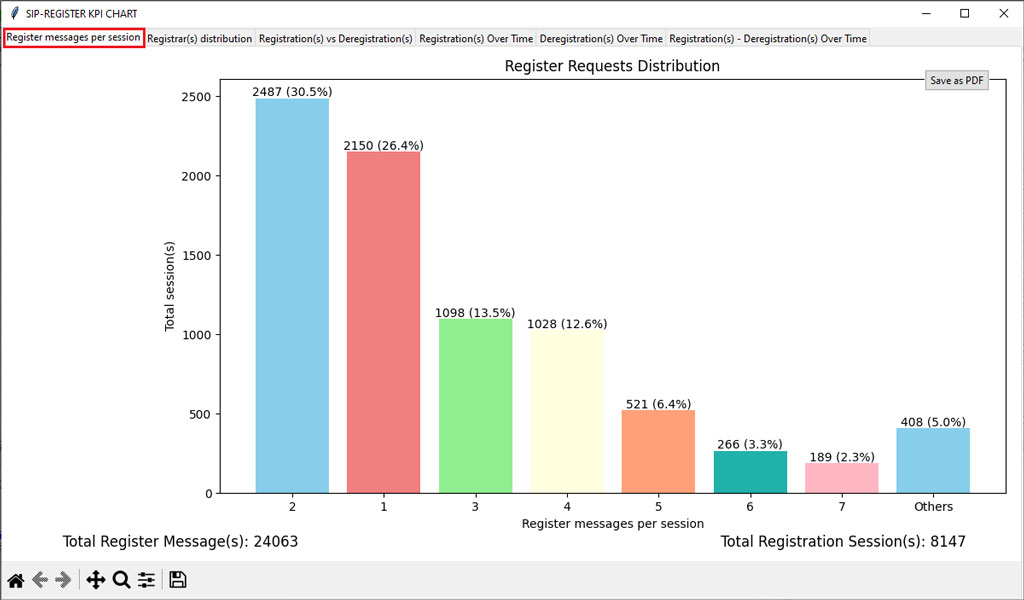
Register Messages per Session
(graph for the distribution of Register Requests)
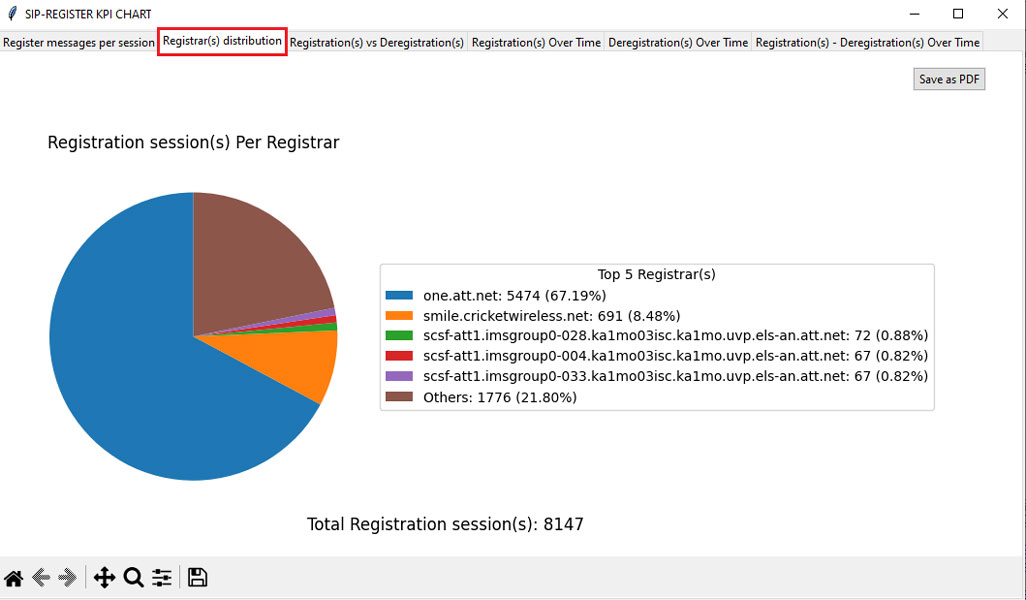
Registrar(s) Distribution
(graph for the number of Registration sessions per Registrar.)
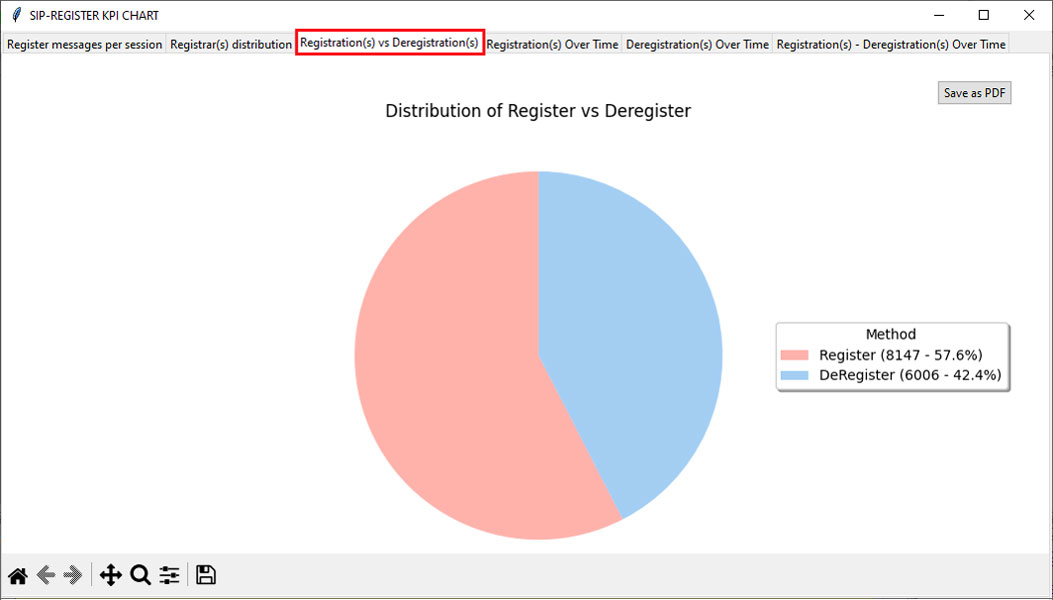
Registration(s) vs Deregistration(s)
(graph comparing the distribution of Register and Deregister counts with percentages (%).)
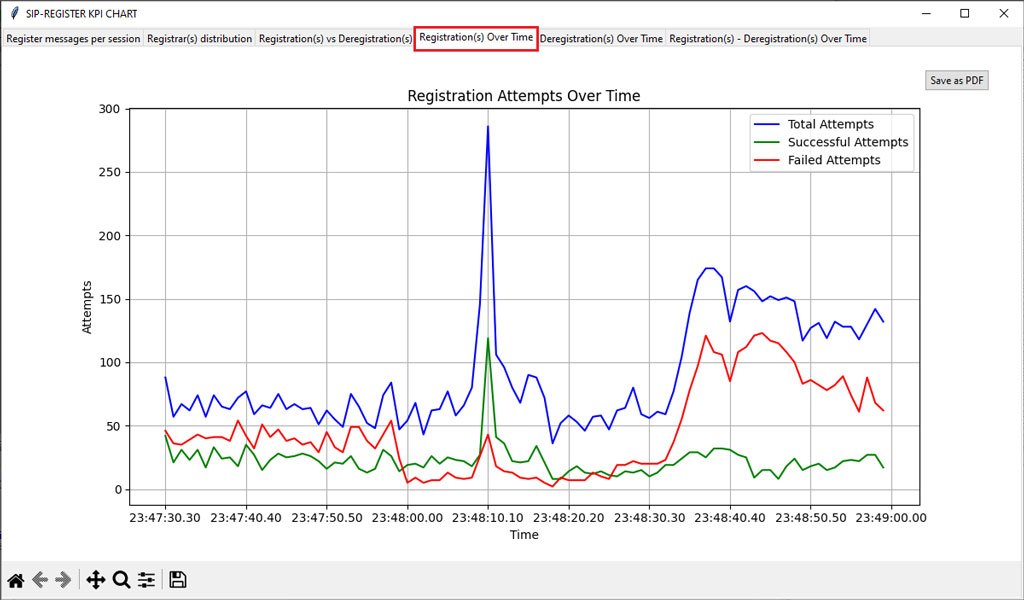
Registration(s) Over Time
(graph for Successful, Failed, and Total Attempts per second.)
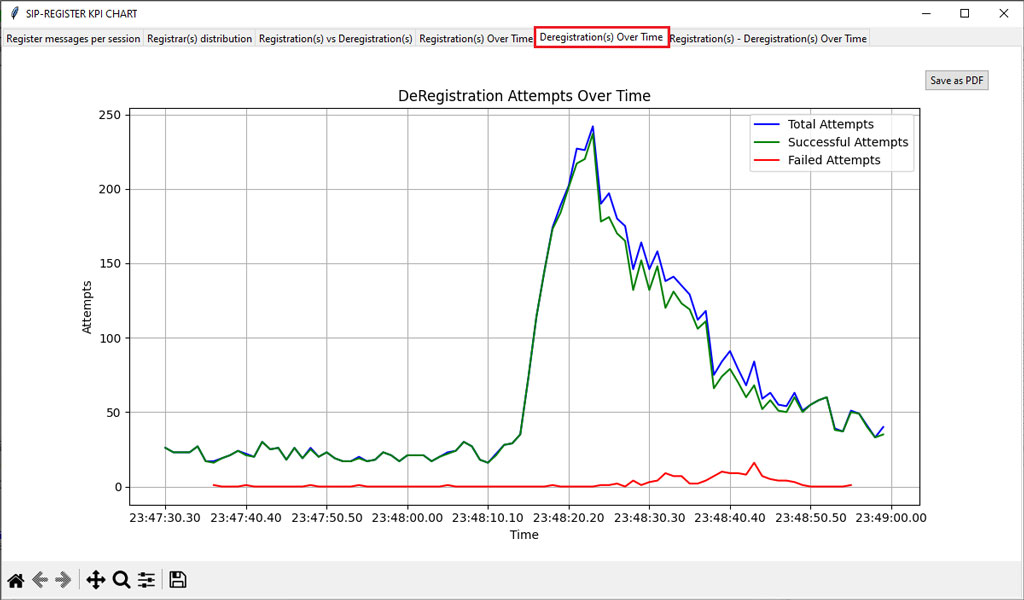
Deregistration(s) Over Time
(graph for Successful and Total Attempts per second.)
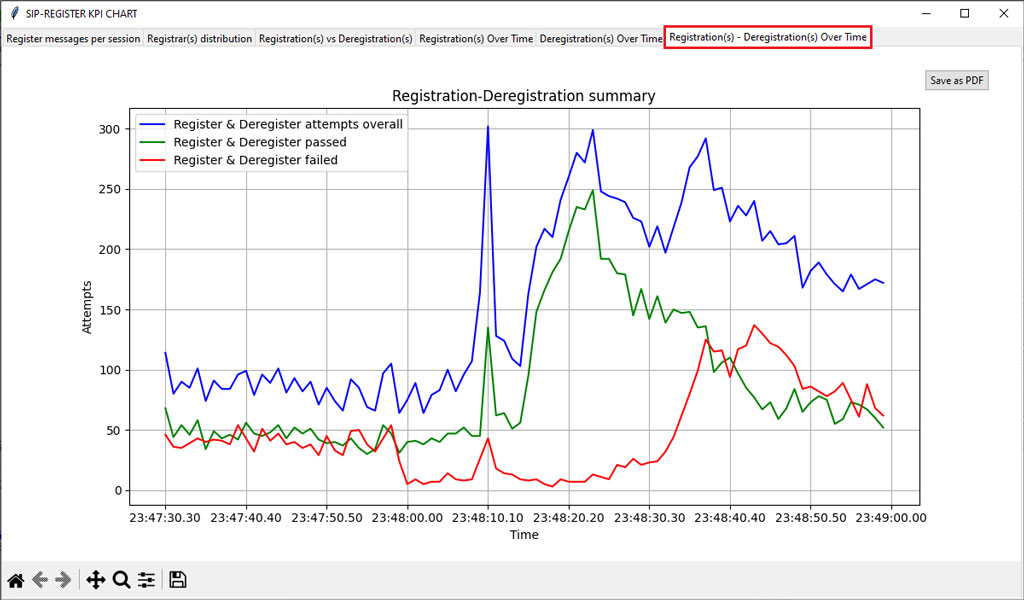
Registration(s) - Deregistration(s) Over Time
(graph for overall Register & Deregister attempts, Register & Deregister passed, and Register & Deregister failed attempts per second.)
PacketScan Web™
PacketScan Web™ extends the capabilities of the standalone PacketScan™ analyzer into a centralized, browser-based solution for enterprise and distributed network monitoring. Using a client-server architecture, it enables multiple users to remotely access PacketScan™ Probes, perform live and offline packet analysis, and collaborate through a secure web interface. Available on Windows® and Linux®, PacketScan Web™ simplifies deployment and centralized management across laboratories, data centers, Network Operations Centers (NOCs), and field environments.
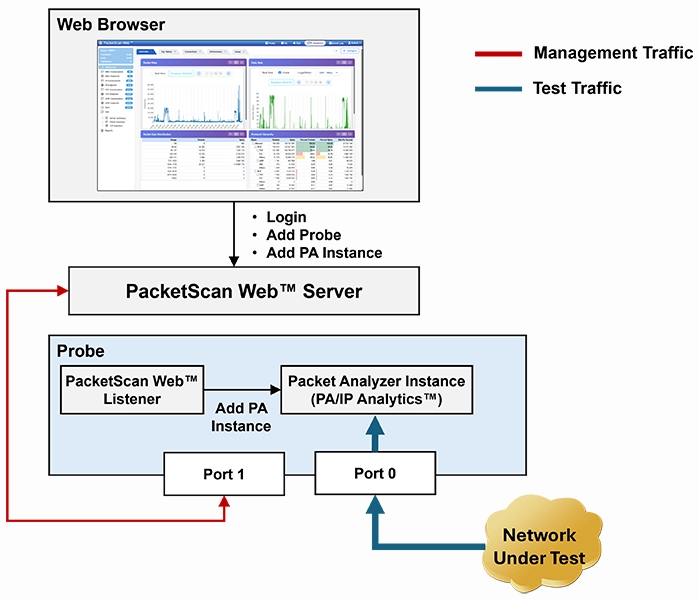
PacketScan Web™ Centralized Monitoring Architecture
Centralized Browser-Based Access
- Access PacketScan™ through any supported web browser without installing a desktop client
- Centrally manage and monitor multiple PacketScan™ Probes from a single interface
- Perform live packet capture and offline analysis of HDL and PCAP trace files
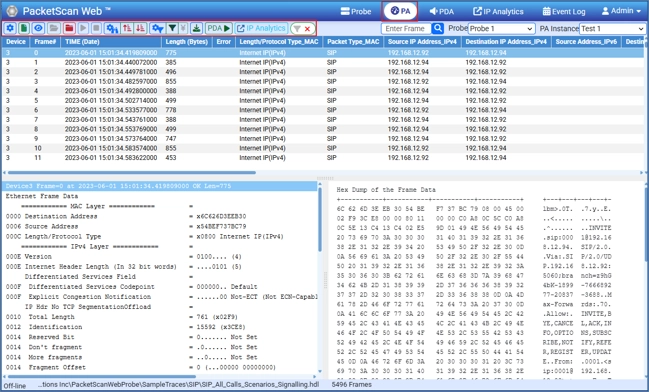
PacketScan Web™ Main Window
Comprehensive Traffic Analysis
- Decode protocols, inspect packets, and analyze sessions using integrated Packet Data Analysis (PDA) and IP Analytics™
- Monitor network traffic in real time with detailed packet views, protocol decoding, statistics, and session correlation
- Generate traffic statistics, ladder diagrams, Call Detail Records (CDRs), and export analysis results in CSV format
Multi-User Collaboration
- Support concurrent access by multiple engineers for collaborative troubleshooting
- Enable centralized configuration and management of distributed Probe systems
- Improve operational efficiency through shared access to packet captures and analysis results
Scalable Enterprise Deployment
- Available on Windows® and Linux® platforms
- Supports distributed Probe deployments for large-scale enterprise and service provider networks
- Provides REST APIs for automation and integration with external applications
IP Analytics™
IP Analytics™ is an integrated application within PacketScan Web™ that provides advanced visibility into IP network traffic for monitoring, troubleshooting, and root-cause analysis. It analyzes live and offline traffic to identify network performance issues, bandwidth utilization, TCP/UDP behavior, endpoint communications, and protocol distribution. Supporting both IPv4 and IPv6 networks, IP Analytics™ transforms captured packets into actionable network intelligence through interactive dashboards, statistical summaries, and graphical visualizations
Traffic Analytics
- Analyze live and offline HDL, PCAP, and PCAPNG trace files
- Monitor IPv4 and IPv6 traffic with protocol distribution and bandwidth statistics
- Visualize traffic trends through interactive charts and dashboards

IP Analytics Dashboard
Endpoint & Conversation Analysis
- Analyze endpoint communications and TCP/UDP conversations
- Identify top talkers, busiest hosts, and bandwidth utilization
- Monitor client-server communication patterns and traffic flows

TCP Conversation

TCP Endpoint
TCP Performance Analysis
- Analyze TCP session behavior, throughput, retransmissions, resets, and latency
- Detect congestion, packet loss, and failed or long-duration connections
- Identify network bottlenecks and performance issues
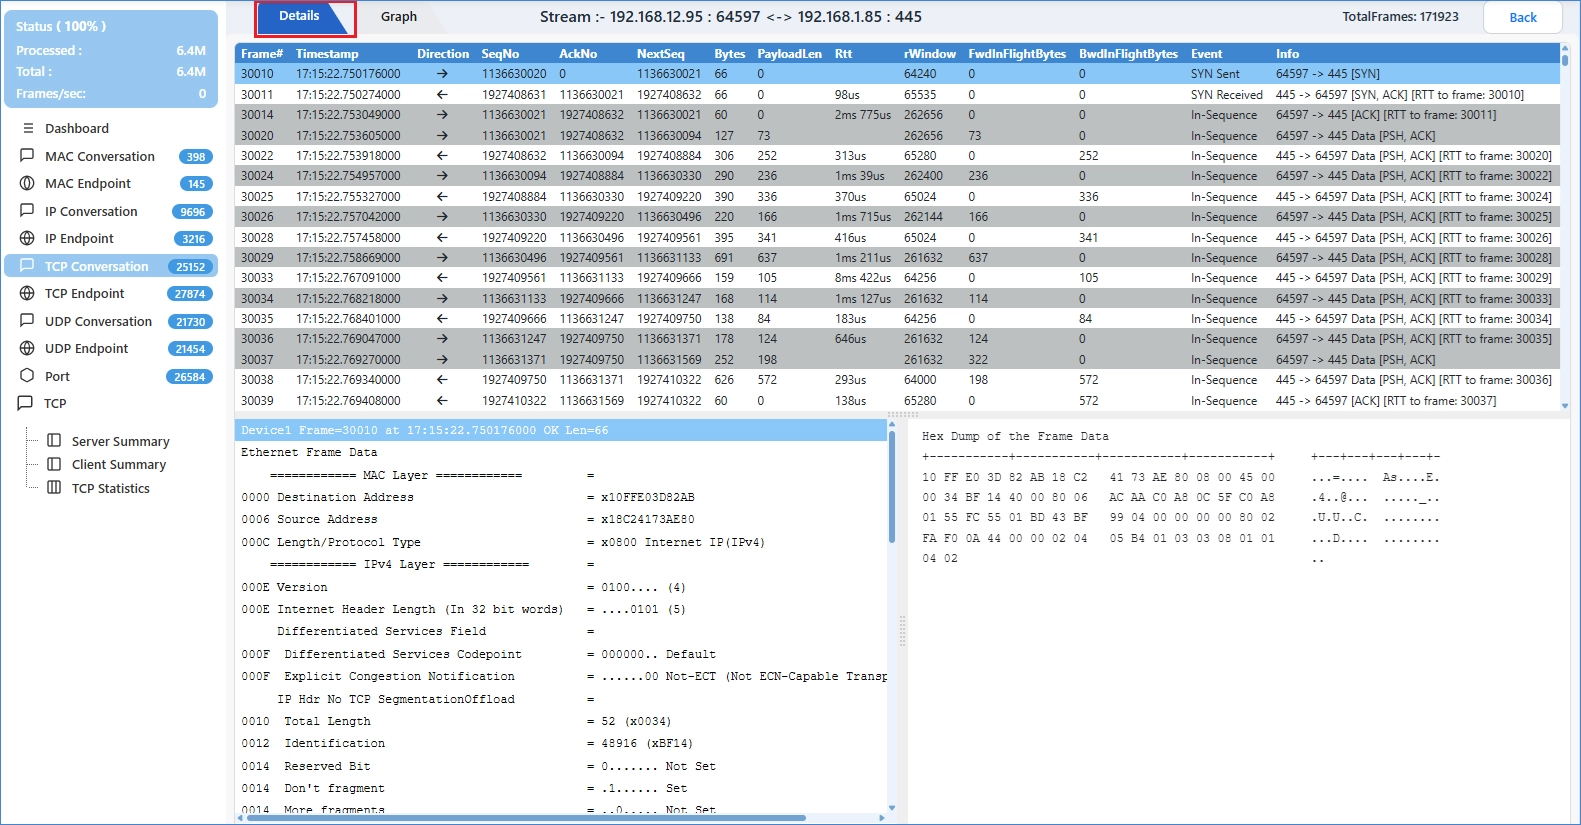
TCP Analysis View
Reporting & Troubleshooting
- Drill down from traffic summaries to packet-level analysis
- Generate comprehensive traffic statistics and analytical reports
- Export results in CSV format for further analysis
This structure is clean, avoids duplication, and matches the style used on the FastRecorder™ webpage while positioning IP Analytics™ as a major integrated capability of PacketScan™.

TCP Statistics
Frequently Asked Questions
Resources
Note: PCs which include GL hardware/software require Intel or AMD processors for compliance.
| Item No. | Item Description |
| PKV100 | PacketScan™ - All IP/VoIP Analysis Software (Online and Offline) |
| PKV101 | PacketScan™ - Offline |
| Add-on/Optional applications with PacketScan™ | |
|---|---|
| PKV110 | IMS Protocol Decodes |
| PKV107 | LTE (Long Term Evolution) Analyzer |
| PKV108 | Offline LTE (Long Term Evolution) Analyzer |
| PKV112 | 5G Analyzer |
| PKV113 | Offline 5G Analyzer - Optional with PKV101 (offline PacketScan™) and PKV170 (NetsurveyorWeb™) |
| PKV105 | SIGTRAN Analyzer |
| PKV106 | Offline SIGTRAN Analyzer |
| PKV103 | IP Based GSM and UMTS Analyzer |
| PKV109 | Offline IP Based GSM and UMTS Analyzer |
| PKV104 | FaxScan™ for SIP and Fax over IP (T.38) |
| PKV400 | TCP and IP Analytics™ (Optional with PacketScan Web™) |
| PCD103 | AMR Codec - Narrowband (requires additional license) |
| PCD104 | EVRC Codec (requires additional license) |
| PCD105 | EVRC-B Codec (requires additional license) |
| PCD106 | EVRC-C Codec (requires additional license) |
| PCD107 | AMR Codec - Wideband (requires additional license) |
| PCD108 | Optional Codec - EVS (requires additional license) |
| PCD109 | Optional Codec - Opus (requires additional license) |
| Hardware Appliance for High-Density Traffic Capture/Analysis | |
| PKV120 | PacketScan™ HD w/4 x 1GigE |
| PKV120p | PacketScan™ HD w/4 x 1GigE - Portable |
| PKV122 | PacketScan™ HD w/2 x 10GigE |
| PKV122p | PacketScan™ HD w/2 x 10 GigE - Portable |
| PKV123 | PacketRecorder™ HD & PacketRePlay™ HD |
PKV124 |
|
PKV124P |
|
| PKV301 | LAN Switch w/ Mirror Port Accessories Power Adapter (1) |
| Related Software | |
| PKS120 | MAPS™ SIP Emulator |
| PKS102 | RTP Soft Core for RTP Traffic Generation (additional) |
| PKV169 | NetsurveyorWeb™ Lite - Probe Level WebServer, PacketScan™, and Oracle 11g Express Edition; |
| PKV170 | NetsurveyorWeb™(Perpetual License, Unlimited Users/Nodes) – Includes Oracle 11g Standard Edition One and Standard Server-Grade Computing Platform |
| Packet over IP CDR Analysis System | |
| Refer to CDR Buyer's Guide | |
| For T1 E1 Datacom | |
| XX135 | T1 or E1 MLPPP Analyzer |
| OLV135 | Offline T1 or E1 MLPPP Analyzer |
| XX136 | PPP and MLPPP Packet Analysis – Real-time Packet Voice, Video, and Fax Analysis |
| For T3 E3 | |
| XX135 | T3 / E3 PPP Analyzer (GUI) |
| XX136 | PPP and MLPPP Packet Analysis – Real-time Packet Voice, Video, and Fax Analysis |
| For OC3 OC12 | |
| LTS205 LTS215 LTS305 LTS315 |
Protocol Analysis for PoS OC3 / STM1 Packet Data Analysis for PoS Protocol Analysis for PoS OC12 / STM4 Packet Data Analysis for PoS |
| LTS206 LTS216 LTS306 LTS316 |
Protocol Analysis UMTS OC3 / STM1 Packet Data Analysis for UMTS Protocol Analysis UMTS OC12 / STM4 Packet Data Analysis for UMTS |
| Presentations |
| PacketScan™ 5G Protocol Analyzer Presentation |
| PacketScan™ Presentation |
| IP Analytics™ Presentation |
| PacketScan™ HD Presentation |
| PacketScan Web™ Presentation |
| Webinars |
|