TCP Analytics
Analyzes TCP connections between both internal LAN and external WAN computers including servers and clients
Request a Demo / Quote Brochure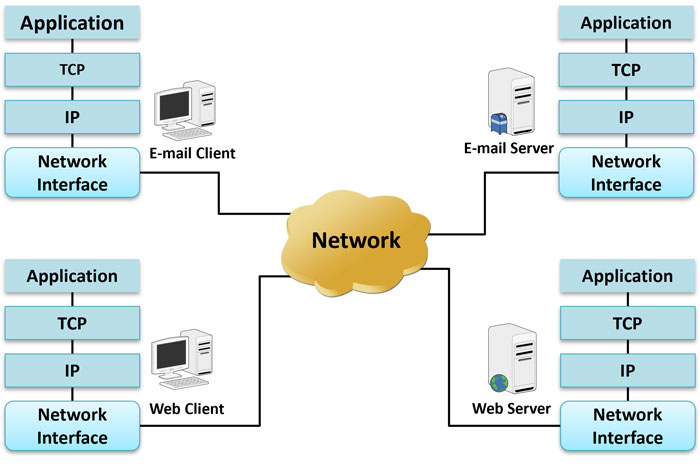
Overview
GL’s TCP Analytics application helps troubleshoot large bandwidth consumption, failed TCP sessions, packet loss, poor TCP throughput and more. TCP Analytics (PKV400) is an optional application with PacketScan™ - Network Monitoring Appliance.
The core functionality is based on the data structures created by sequential processing of the TCP segments in the offline trace file of the PacketScan™. Due to the requirement to process huge trace files with billions of records the TCP Analytics is not based on the protocol decode functions but rather on the optimized fast TCP record processing.
These data structures need to be created once when the offline trace file is opened and are used to produce derivatives analytics. When offline file is closed the data structures are destroyed releasing memory resources.
PacketScan™ offline user interface is used to create base data structures for TCP connection analysis from an offline trace file containing captured frames or importing Wireshark packet captures. These data structures can be huge if the captured data files are hundreds of gigabytes or even many terabytes (1OE+12) in size. The proper configuration of computer’s virtual memory is required to handle this data and is accomplished with the TCP Analytics program

Webinar : Advanced TCP Network Analytics
Main Features
- Analyze TCP connections between internal company LAN connected computers and outside computers on the WAN
- Analyze TCP connections of a particular client server pair
- Analyze TCP connections on a subset of a LAN
- Display top level statistics
- Filter out the traffic of interest by specifying TCP Server Port number
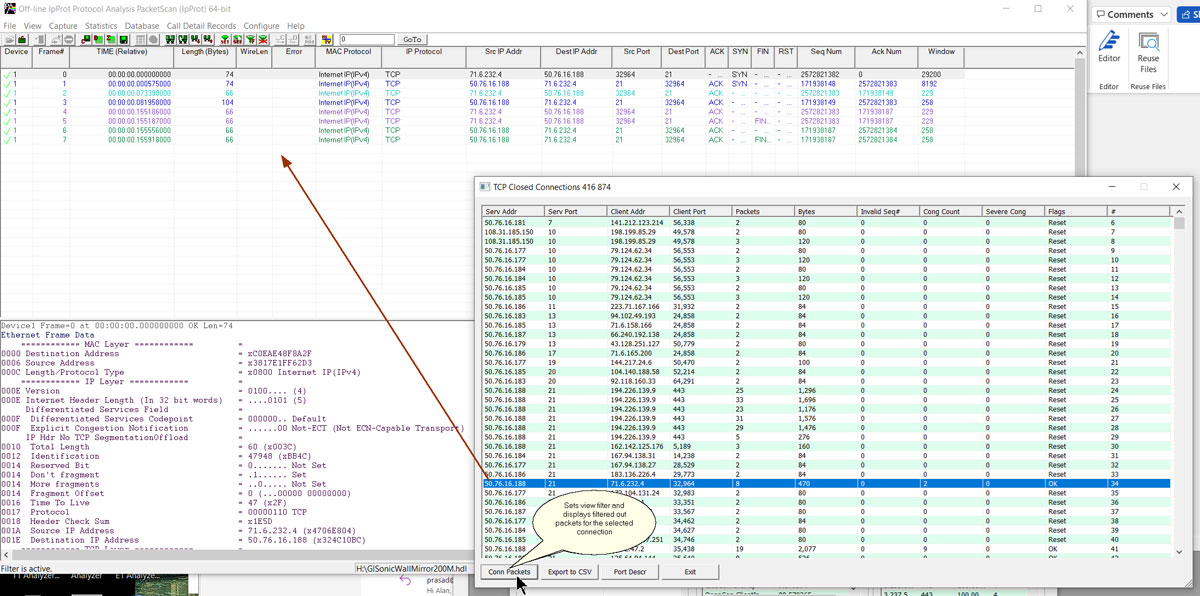
- Use PacketScan™ to display packets that belong to a selected TCP connection
- Export information to CSV files for subsequent Excel or a database import
- Sort tabular information by column values
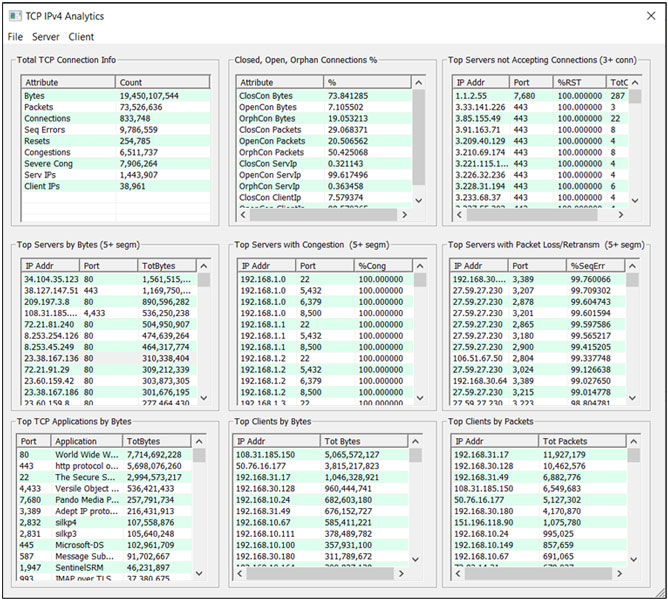
TAG IPv4 Dashboard
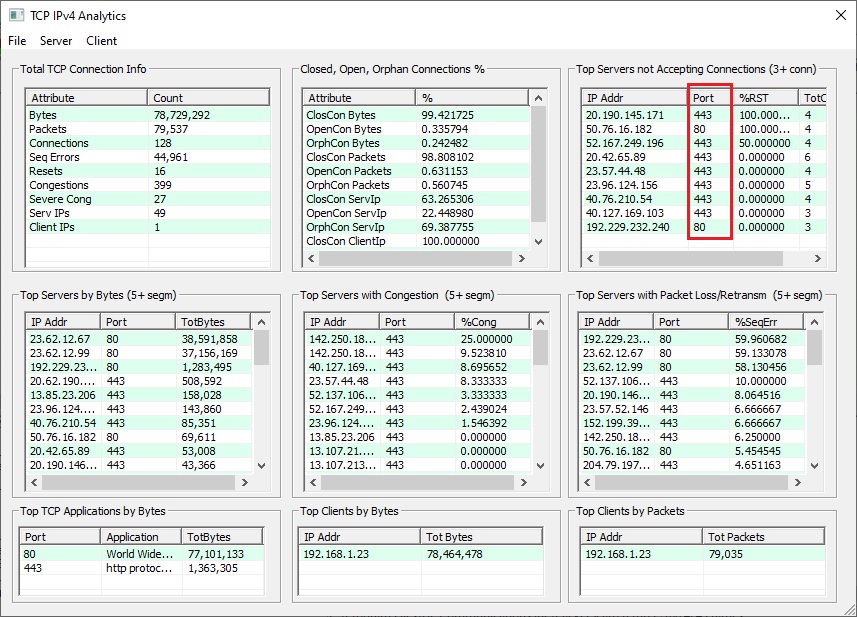
The TCP Analytics GUI (TAG) IPv4 Dashboard includes a menu to invoke detailed TCP IPv4 connection information and summary overview of TCP connections in the currently opened and processed trace file. The window is resizable to adjust column width. Columns can be sorted by clicking on the column header.
Sorting Columns
Sort columns in an ascending or descending order by clicking on the header.
Total TCP Connection Information
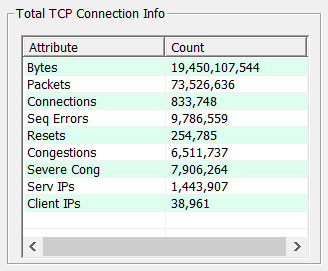
- Seq Errors for TCP Sequence Number field errors indicate missing, duplicate or out of order packets
- Resets are connections with RST flags usually indicates refused connections by servers etc.
- Congestions indicate reduced window size due to congestions (indication of the receiving side to slow down transmission on the other end)
- Severe Cong indicates 0 window size in the TCP header when receiving size cannot accept ANY TCP packets for the connection
- Serv IPs, Client IPs just counts the unique IPv4 addresses for servers and clients
Distribution in Percentage Among Closed, Open and Orphan Connections
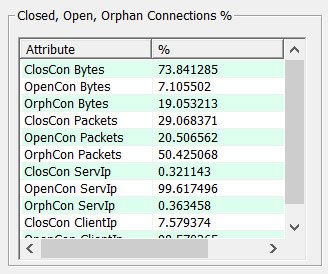
Display Closed, Open, and Orphan connections in percentage.
Top Servers Rejecting Client Connections
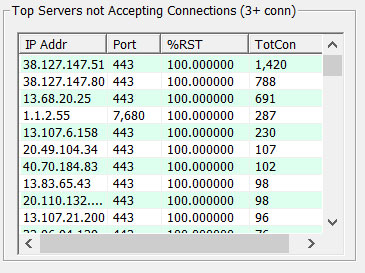
- IP Addr and Port columns display server IP address and TCP port number
- %RST (resets) is the percentage of connections being rejected. This list includes only servers with total of 3 or more connections to avoid noise
- TotCon is the total number of connections to the server addr/port pair
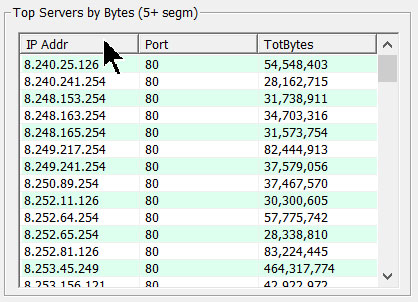
Top Servers by Bytes Transferred
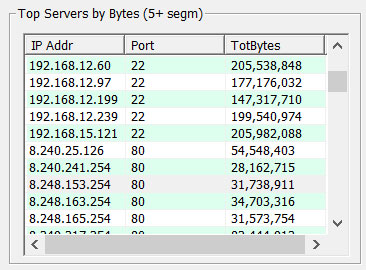
Information is collected only for connections with 5 or more segments for a connection. Each line is a total for all connections for a particular server TCP application with unique IP address and TCP port.
Top Servers with Reduced Windows Size (Congested)
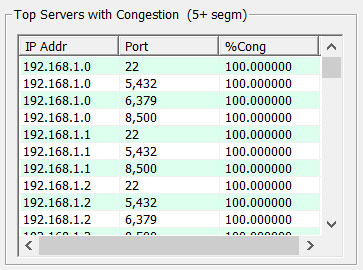
Includes connection with at least 5 segments (packets) and is showing servers with the largest percentage of packets with reduced window size.
Top Servers with Largest Percentage of Sequence Errors (Packet Loss/Retransmission)
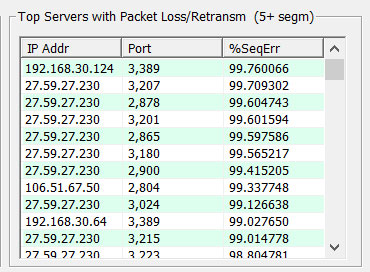
Indicates the most affected servers by percentage of TCP segments with sequence number errors caused by missed packets, packets retransmission and reordering etc.
Top TCP Applications by Received Bytes
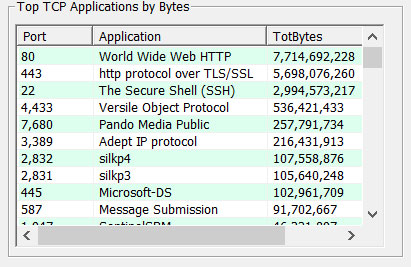
Total bytes are the sum of all bytes for all connections to all IP addresses with particular TCP port number.
Top Client IP Addresses by Bytes for all Client TCP Connections
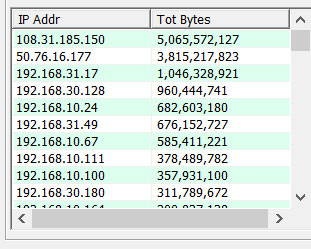
- Used to diagnose computers that cause the network congestions
- These are the clients that transmit or receive largest amount of data
- This is a total for all connections and all TCP applications per client
Top Client IP Addresses by Packets for all Client TCP Connections
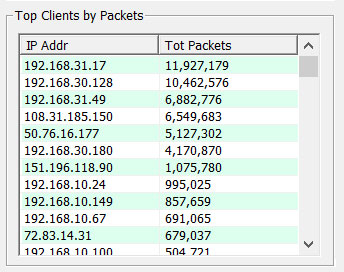
- Total for all connections and all TCP applications per client
- Used to diagnose computers that cause the network congestions and potential viruses or wiring and Hardware malfunctions
- These are the clients that transmit or receive largest number of packets
Filter Traffic Based on Specified TCP Server Port Numbers
Filter out the traffic of interest by specifying TCP Server Port number. The below screenshot shows the filtered traffic received only on “443 80” TCP port numbers
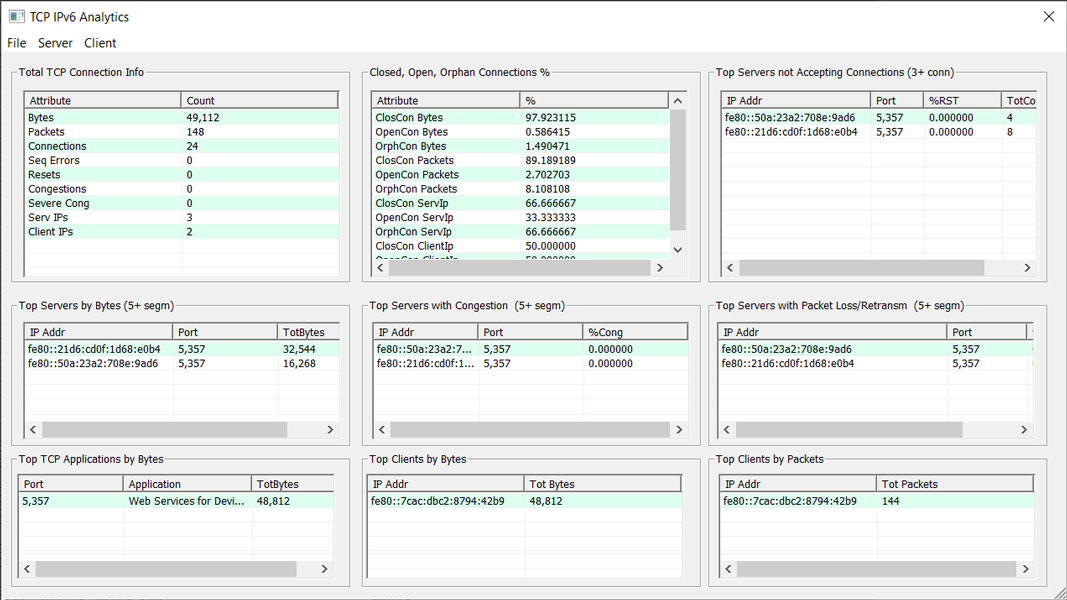
TAG IPv6 Dashboard
The TCP Analytics GUI (TAG) IPv6 Dashboard includes a menu to invoke detailed TCP IPv6 connection information and summary overview of TCP connections in the currently opened and processed trace file. The window is resizable to adjust column width. Columns can be sorted by clicking on the column header.
TCP Closed Connections Menu
Displays all the connection information one row per connection that are properly opened and closed.
Resources
Note: PCs which include GL hardware/software require Intel or AMD processors for compliance.
| Item | Description |
| PKV400 | TCP Analytics (Optional with PacketScan™) |
| PKV100 | PacketScan™ - (Online and Offline) |
| PKV120 | PacketScan™ HD High Density IP Traffic Analyzer |
| PKV101 | PacketScan™ - Offline |
| Brochures |
| TCP Analytics Brochure |
| Presentations |
| TCP Analytics Presentation |