High Speed Ethernet and IP Capture
Wirespeed Ethernet traffic filtering and recording up to 320 Gbps direct to disk.
Request a Demo / Quote BrochureOverview
Today's networks are built with switches, routers, and gateways interconnected with 1, 10, 25, 40, and 100 Gbps full duplex fiber optic lines. These fiber connections increasingly carry packets (vs. circuits) with data, voice, and video, interleaved, aggregated, and burst out at ever faster, bigger, and longer distances.
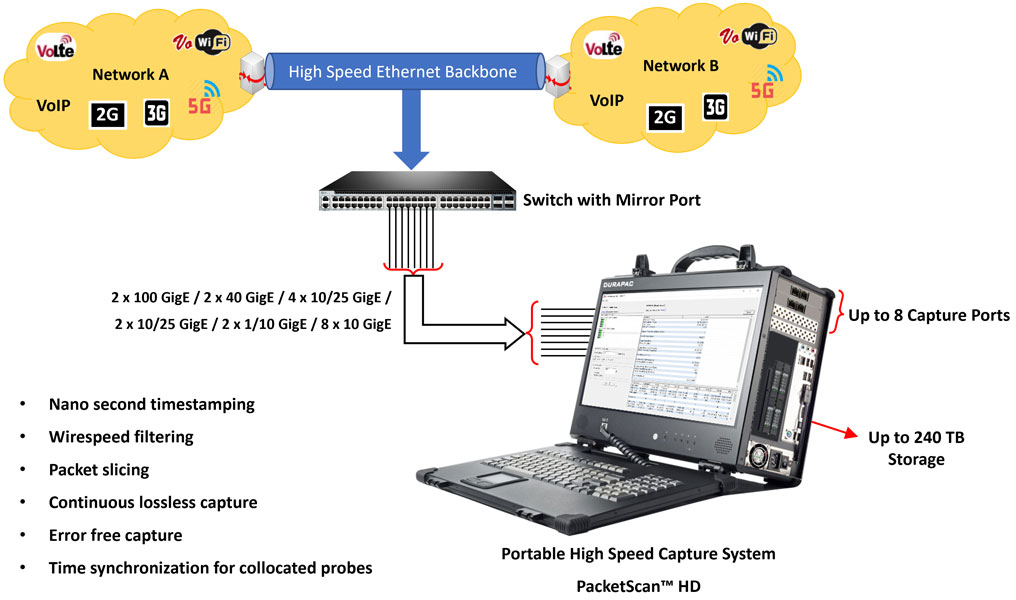
Diagnosing issues on these networks requires error free, non-intrusive interception at full line-rate (wirespeed) and then storing the captures for post analysis with a protocol analyzer. At such high rates, capturing and storing requires a unique architecture, large RAM, and hundreds of terabytes of storage. Additional features, like wirespeed filtering, packet slicing, storing and later extracting intended application streams are also vital.
The application includes four modules - FastRecorder™, PacketExtractor™, PacketRecorder™ , and PacketReplay™.
- FastRecorder™ and PacketExtractor™ provide extreme wirespeed IP traffic filtering and recording up to 320 Gbps direct to disk and offline filtering, extraction, and analysis. Supports 4 x 1 Gbps or 2 or 4 x 1/10/25 Gbps or 2 x 40/100 or 8 x 10 Gbps or 4 x 1/10/25 GigE Ethernet Interface
- PacketRecorder™ and PacketReplay™ provide record and playback of IP traffic up to 10 Gbps
FastRecorder™ and PacketExtractor™ Solutions
- High-Speed Packet Capture & Analysis: Supports lossless recording of IP traffic across 1, 10, 25, 40, and 100 Gbps links, enabling real-time capture with nanosecond precision
- Advanced Filtering & Storage: Hardware-based filtering for efficient capture of relevant traffic, with up to 240 TB of storage for long-duration recording
- Packet Extraction & Analysis: Extracts recorded data into PCAP, PCAPNG (Wireshark®), or HDL formats for post-analysis with tools such as GL’s PacketScan™
- Traffic Replay & Simulation: Enables replaying recorded traffic to recreate real-world network scenarios in a controlled lab environment
- Protocol & QoS Monitoring: Supports eCPRI, TCP, UDP, SCTP, and other protocols with deep packet inspection and Quality of Service (QoS) analytics
- Graphical Insights & Alerts: Provides real-time statistics, graphical trend analysis, email alerts, and trigger-based recording options
In FastRecorder™ mode, high rate real-time traffic can be recorded with precise hardware time stamping. The Record feature includes a powerful Hardware Filter that allows user to filter out unwanted traffic, and continuously capture the traffic of interest. The user can apply trigger conditions to Start or Stop writing to the Disk based on the Trigger criteria.
In PacketExtractor™ mode, the recorded traffic file on selected network interface ports and drives can be extracted to PCAP or PCAPNG (Wireshark® format), or HDL (GL Proprietary format) formats, and extracted trace files can be analyzed using any packet analyzer such as GL's PacketScan™. It also supports sequence number verification of extracted packets (BERT verification) Live traffic captured on a network using the Recorder utility, PacketScan™, or Wireshark® can be easily recreated in the lab. Also, PacketExtractor™ supports monitoring and analysis of eCPRI protocol.
GL's IP Analytics™ (PKV410) is an optional application that works with FastRecorder™ and PacketExtractor™ used to ensure Quality of Service (QoS) by analyzing IP-based data streams to meet performance standards. GL's IP Analytics™ offers detailed statistics for various parameters such as Layer 3, COS, Layer 4, IPv4/IPv6 Endpoints, UDP/TCP Endpoints, and conversations, enabling precise analysis of network performance. Capable to compute and visualize network metrics with millisecond precision, including Packet Count, Byte Count, Packets/sec, and Bits/sec, provides real-time insights crucial for optimizing network efficiency.
FastRecorder™ and PacketExtractor™ applications work with GL's PacketScan™ HD (or Wireshark®) Analyzers. GL's PacketScan™ HD is a complete IP traffic analyzer – similar to but more powerful than Wireshark®. For example, real time voice quality, fax quality, call and session separation, powerful ladder diagrams are included.
The traffic captured on a live network can be analyzed using packet analyzers such as PacketScan™ - All IP analyzer or Wireshark®.
Main Features
| FastRecorder™ | PacketExtractor™ |
|
|
Frequently Asked Questions
- What are FastRecorder™ and PacketExtractor™ used for?
- FastRecorder™ and PacketExtractor™ are used for high-speed Ethernet and IP traffic capture, filtering, recording, and analysis. They allow users to non-intrusively intercept network traffic at full line-rate and store the captures for post-analysis with a protocol analyzer.
- What speeds does FastRecorder™ support?
- FastRecorder™ supports wirespeed IP traffic filtering and recording up to 320 Gbps direct to disk. It supports various Ethernet interfaces, including 1, 10, 25, 40, and 100 GigE.
- What modules are included in the application?
- The application includes four modules: FastRecorder™, PacketExtractor™, PacketRecorder™, and PacketReplay™.
- Does FastRecorder™ and PacketExtractor™ require hardware?
- Yes, these applications are optional applications for PacketScan™ HD. PacketScan™ HD is a custom-built PC with specialized network interface cards, large RAM and storage and optimized cooling. Both rack-mount and portable form factors are supported.
- Where should these applications be deployed on a network?
- These applications are installed on PacketScan™ HD. PacketScan™ HD should be plugged into a mirror port on a switch in order to capture high speed traffic from the Ethernet network.
- What is FastRecorder™ mode used for?
- In FastRecorder™ mode, high-rate real-time traffic can be recorded with precise hardware time stamping. It includes a powerful hardware filter to filter out unwanted traffic and continuously capture the traffic of interest.
- What is PacketExtractor™ mode used for?
- In PacketExtractor™ mode, recorded traffic files can be extracted to PCAP, PCAPNG, or HDL (GL Proprietary format). These extracted trace files can be analyzed using packet analyzers such as GL's PacketScan™.
- What kind of filters are supported by FastRecorder™?
- FastRecorder™ provides predefined and advanced hardware filter options. Users can customize filters based on MAC, 802.1Q (VLANs), IPv4 or IPv6, Tunnel Traffic (GTP, GRE, VXLAN), TCP, UDP, SCTP, SIP and RTP parameters. Custom filters with logical conditions (AND, OR) can also be created.
- What is Packet Slicing and is it supported?
- Storing only a selected portion of the packet content. FastRecorder™ supports packet slicing to store only selected packet content such as protocol headers or portions of the payload.
- What output formats does PacketExtractor™ support?
- PacketExtractor™ can extract traffic into PCAP, PCAPNG, or HDL (GL Proprietary format) output traces.
- Can PacketExtractor™ be used to analyze eCPRI traffic?
- Yes, PacketExtractor™ supports monitoring and analysis of eCPRI protocol for packet impairments.
- What is IP Analytics™ and how does it relate to FastRecorder™ and PacketExtractor™?
- IP Analytics™ is an optional application that works with FastRecorder™ and PacketExtractor™. It is used to ensure Quality of Service by analyzing IP-based data streams. It offers detailed statistics for various parameters and computes network metrics with millisecond precision.
- What kind of statistics does FastRecorder™ collect?
- FastRecorder™ collects statistics such as:
- Filter Match Frames
- Filter Not Match Frames
- Total Frames
- Filter Match Frames %
- Dropped Frames
- Recorded Bytes
- Capture Rate
- Filtered Rate
- Capture Frame Rate
- Filtered Frame Rate
- Record Duration
- Buffer usage
- Port Link Status
- Error counters (L1/L2)
- Can FastRecorder™ automatically resume recording after a system interruption?
- Yes, FastRecorder™ has an Auto Resume option that allows it to continue recording after system interruptions like PC reboots or application crashes.
- What is the Packet Sanitize option in PacketExtractor™?
- The Packet Sanitize option within PacketExtractor™ is used to replace (mask) MAC, IPv4, and IPv6 Addresses.
- What is BERT verification in PacketExtractor™?
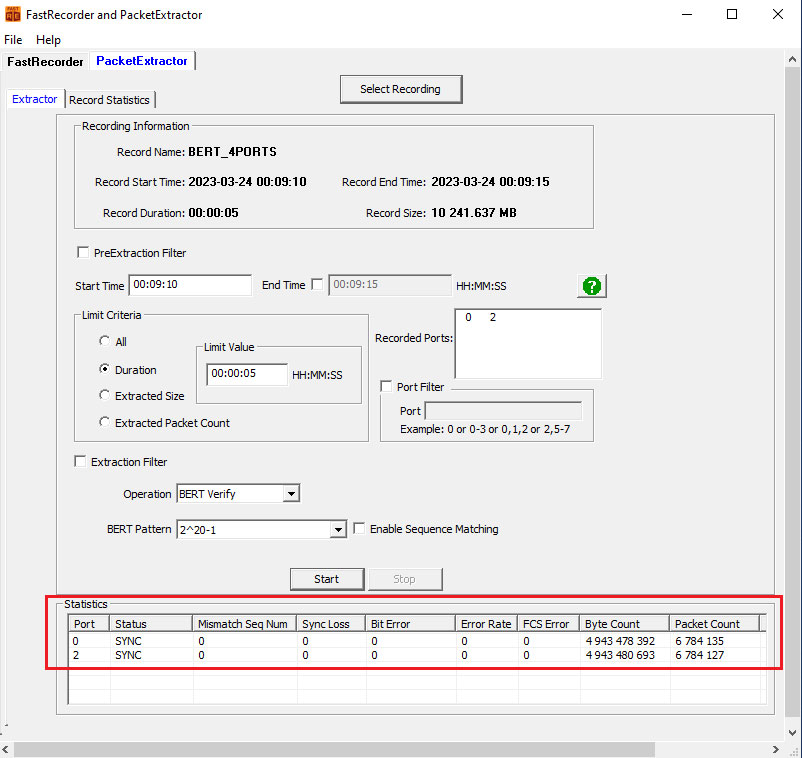
- BERT (Bit Error Rate Test) verification analyzes the sequence number of extracted packets to provide measurements such as Status, Mismatch SeqNum, Sync Loss, Bit Error, Bit Error Rate, and Byte Count.
Specifications
| Hardware Requirements | Requires GL's HD Network Interface adapters High Density Network Adapters can be any of the following types -
Hard Disk: SSD hard disk (For faster I/O operations) compatible with SATA verIII or RAM Disk System Configuration: 2U system with 32 GB to 128 GB RAM |
| Hardware Filters |
Supports defining up to 10 filters at Layer 2, 3, 4, and 5 |
| Record Rate | Max Rate is 320 Gbps |
FastRecorder™ Architecture
The traffic is captured on the selected port at the hardware level. The captured traffic will be timestamped and sent to the Host Buffer within the hardware. If the Hardware Filters are applied, then only the filtered traffic will be sent to the Host Buffer. In case of multiple port selection, the filtered traffic from the selected ports is aggregated and presented as a single stream.
The FastRecorder™ application has two modules such as Capture Module and Write Module. In the host buffer, the packets are segmented into different frames based on segment sequence number and segment sequence length and these stream of frames are captured from the selected network interface and the write module will save the captured traffic in the trace files in metadata format in to the SSD/RAM Disk.
PacketExtractor™ Architecture
The pre-recorded captured files (.dat format) stored in SSD/RAM disk will be fed to PacketExtractor™ application.
It reads the metadata file which contains the information of the recorded data on each drive with time stamp. The filters can be applied for extracting traffic of interest. The trace files segments are reassembled based on segment sequence number. The segment sequence number and segment length are used while analyzing or reassembling the segments.
The Extractor module extracts the packets from the reassembled segments. The write module will write the extracted packets to HDL or PCAP or PcapNG. The BERT verify option can be used to analyze the sequence number of extracted packets.
FastRecorder™ Application
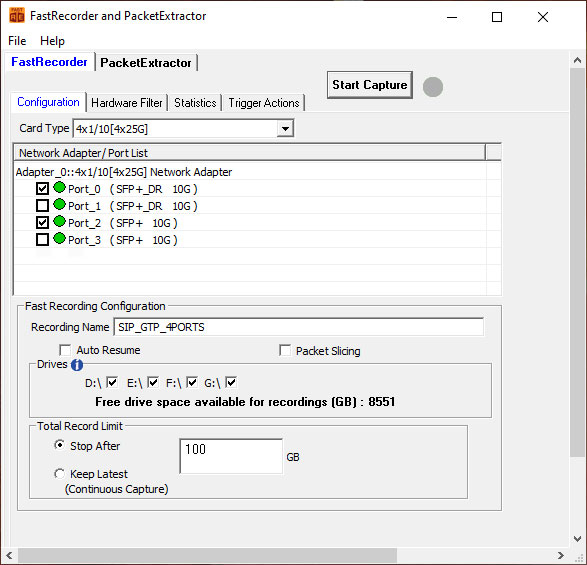
FastRecorder™ application provides various options to capture the high density real-time traffic on disk drives and store the recorded traffic into a file. The application can capture the traffic continuously until user stops the recorder or specify the size limit to stop the traffic capture.
Hardware Filters
The Hardware Filter option allows user to easily set up filter conditions to filter out unwanted traffic at line rate, continuously capture only the traffic of interest, and modify filters on the fly.
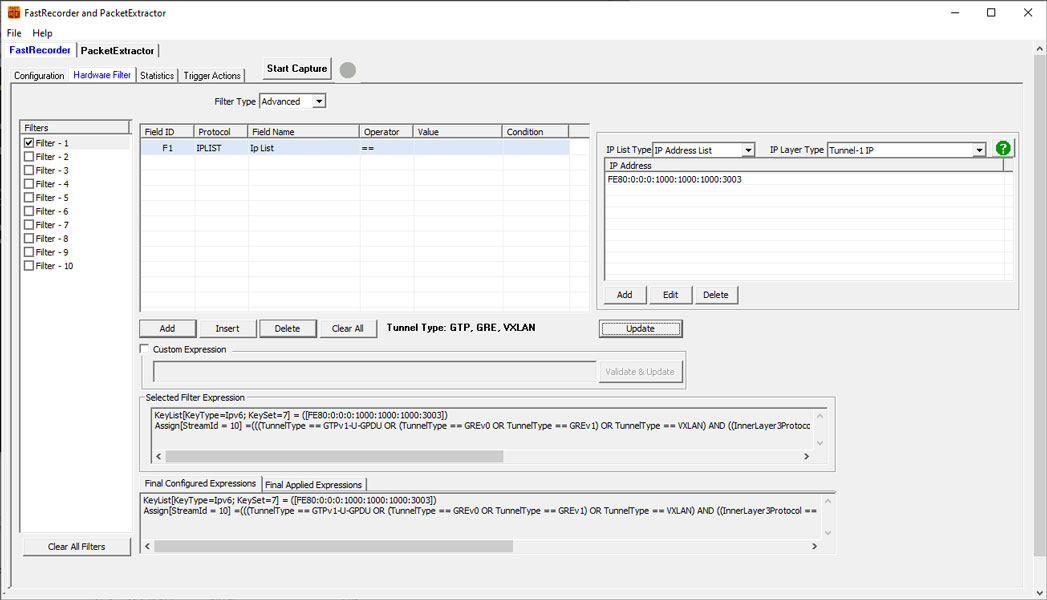
Example: Filtering Tunnel Traffic
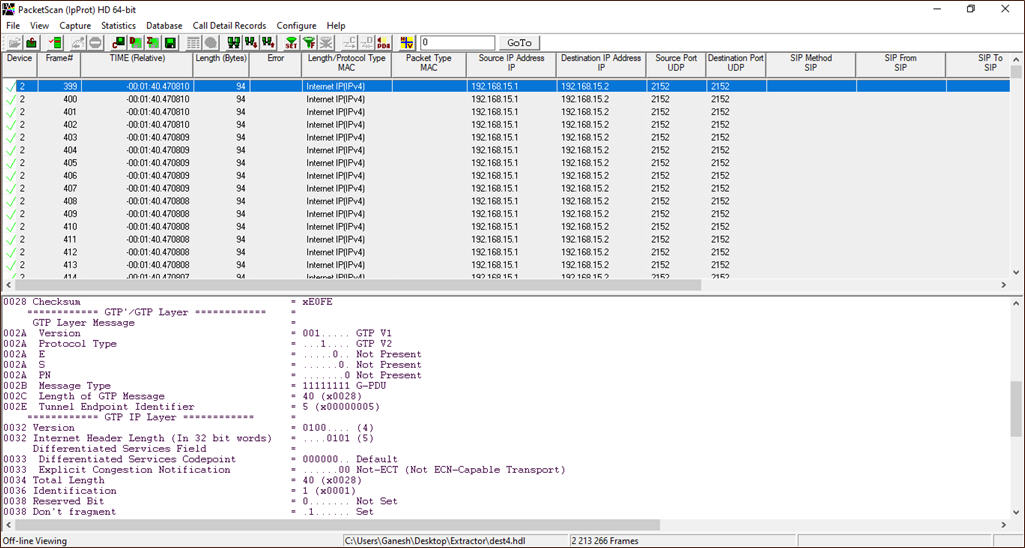
Up to 10 filters can be defined based on various parameters in the protocol layers. As an example, GTP is configured in the below figure.
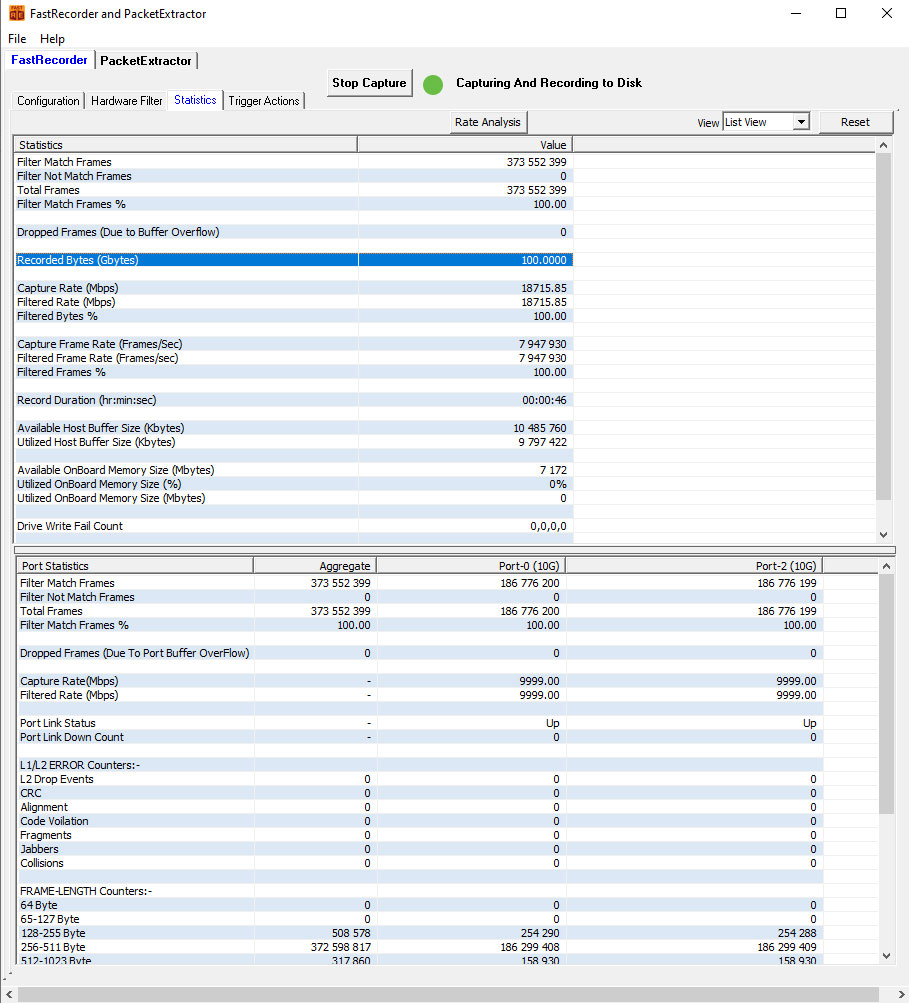
FastRecorder Statistics
Recorder statistics displays the statistics information of
- Filter Match Frames
- Filter Not Match Frames, Total Frames
- Filter Match Frames %
- Dropped Frames (Due to Buffer Overflow)
- Recorded Bytes (Gbytes)
- Capture Rate (Mbps)
- Filtered Rate (Mbps)
- Capture Frame Rate (Frames/Sec)
- Filtered Frame Rate (Frames/Sec)
- Record Duration (hr:min)
- Available Host Buffer Size (Kbytes)
- Utilized Host Buffer Size (Kbytes)
- Available OnBoard Memory Size (Mbytes)
- Utilized OnBoard Memory Size (%)
- Utilized OnBoard Memory Size (Mbytes)
- Disk Write Fail Count
- Port Link Status
- Port Link Down Count
- L1/L2 ERROR Counters:
- L2 Drop Events
- CRC
- Alignment
- Code Violation
- Fragments
- Jabbers
- Collisions
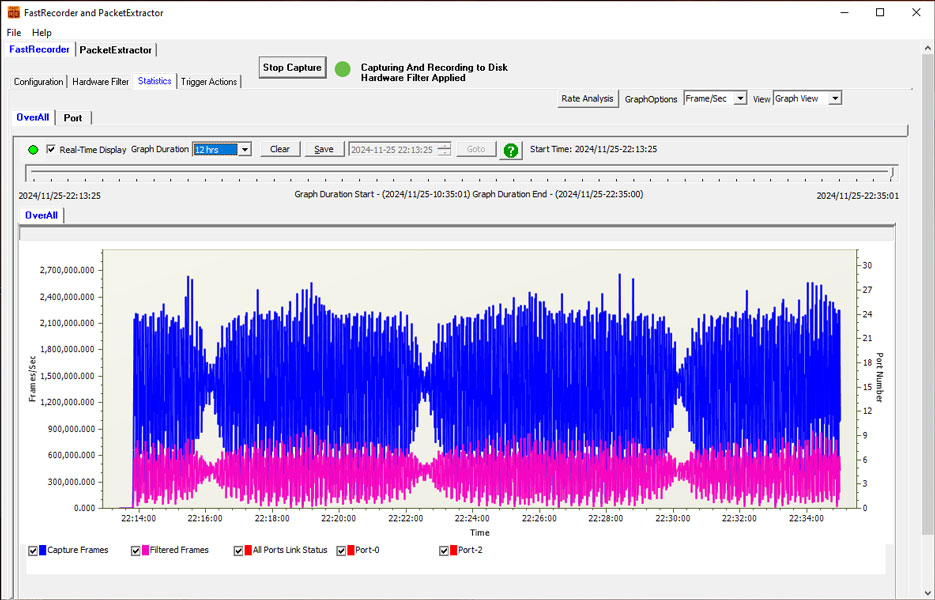
Overall Graph View
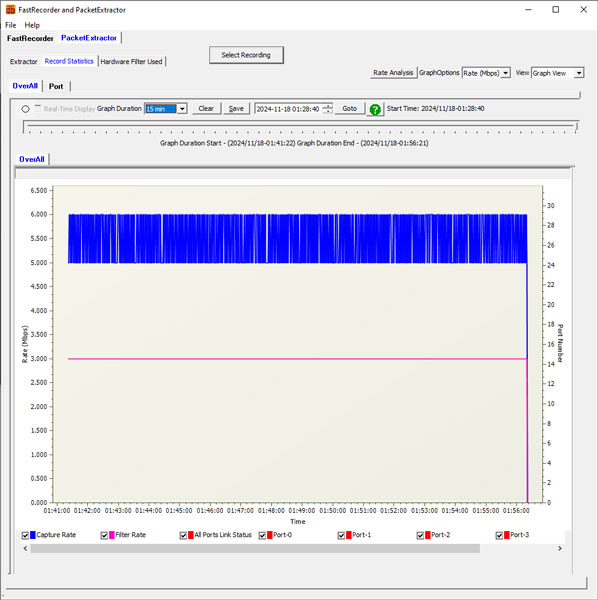
User can observe the real time display of graph (Time v/s Rate), Capture Rate, Filter Rate, and Port link Status from past 7 days.
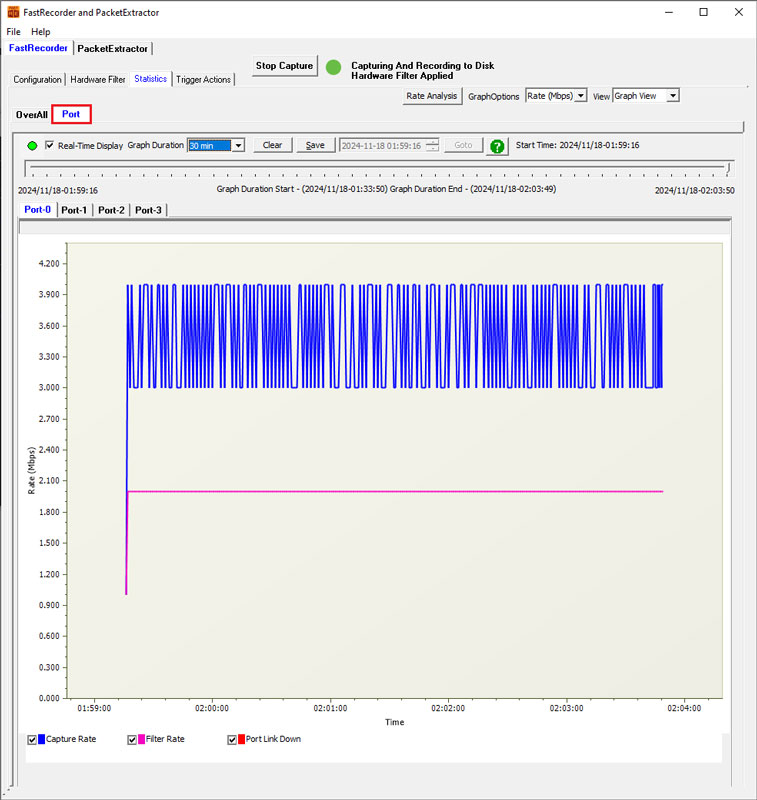
Per Port Graph View
User can observe the real time display of port graph (Time v/s Frames/Sec), Capture and Filtered Frames from past 7 days
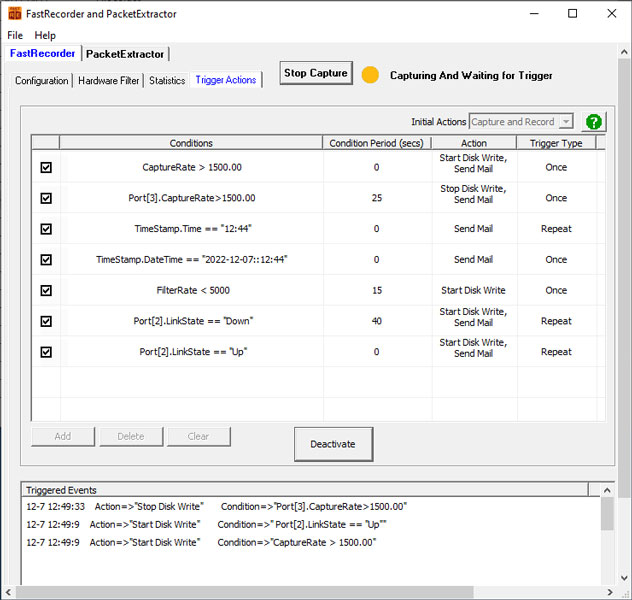
Trigger Conditions
User can specify the triggers to perform action based on the following conditions.
- CaptureRate (Mbps)
- FilterRate (Mbps)
- Port[n].CaptureRate (Mbps)
- Port[n].FilterRate (Mbps): where n is port number
- TimeStamp.DateTime, TimeStamp
- Time (min)
Recording Time Table
Packet Length |
512 |
Bytes |
|
Overhead |
20 |
Bytes |
12 bytes minimum IFG + 8 bytes Preamble+SFD |
Napatech Overhead |
16 |
Bytes |
Packet Header Overhead |
Actual Overhead |
-4 |
||
Link Speed |
10 |
Gbps |
|
Number of Links |
4 |
||
Disk Space/sec |
4.620233085 |
GB |
|
Duration (minutes) |
18 |
Minutes |
|
Total Disk Space |
4.872902082 |
TB |
|
PacketExtractor™ Application
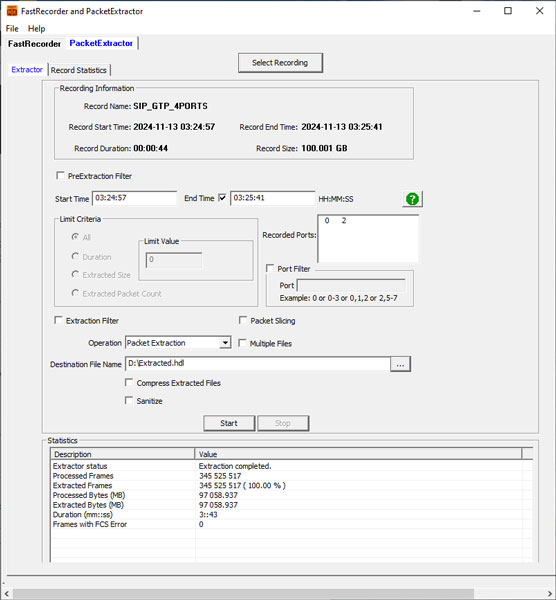
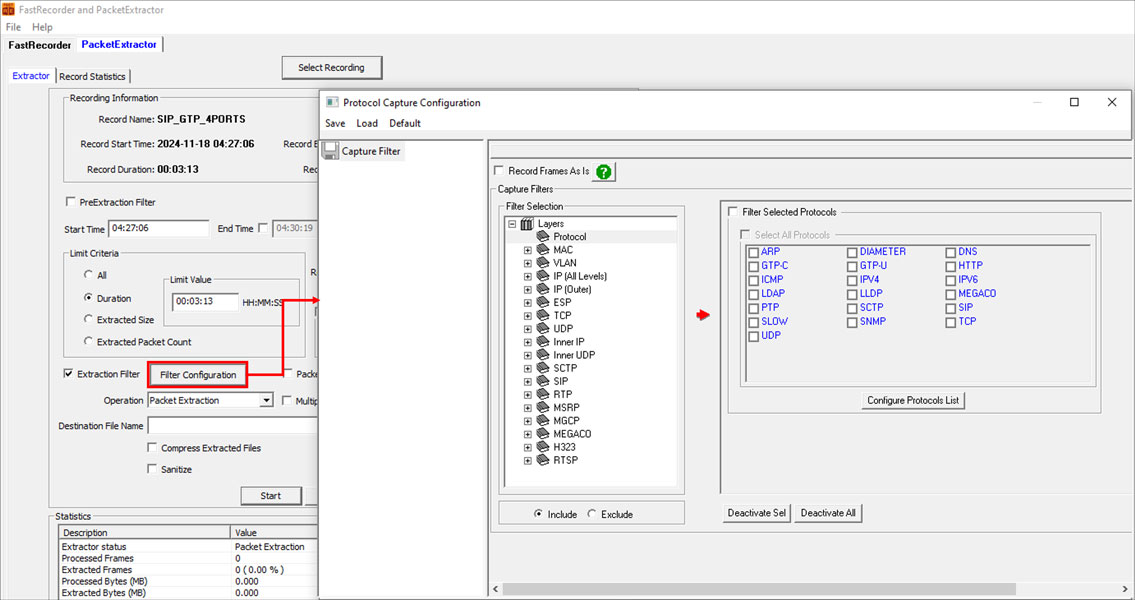
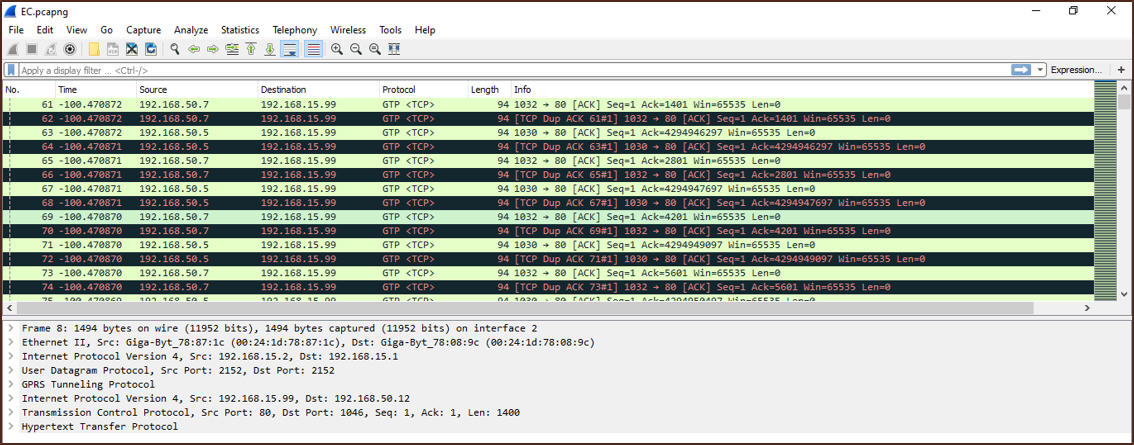
PacketExtractor™ application consists of configuration settings that allows user to extract recorded files on the selected HD NIC interface port with or without applying filters and by specifying the different limit criteria (Time, Packet Count and Size) into required output file format to analyze the results using PacketScan and Wireshark application . User can also save the extracted traffic in multiple files by providing the file size to create a new file after every specified file size.
In the packet extraction from the stored recordings without filter the Extractor Filter option is unchecked and no filter configurations are done to extract the traffic.
In the packet extraction from the stored recordings with filter the Extractor Filter option is checked and required filter configurations are done to extract the traffic.
ESP Deciphering
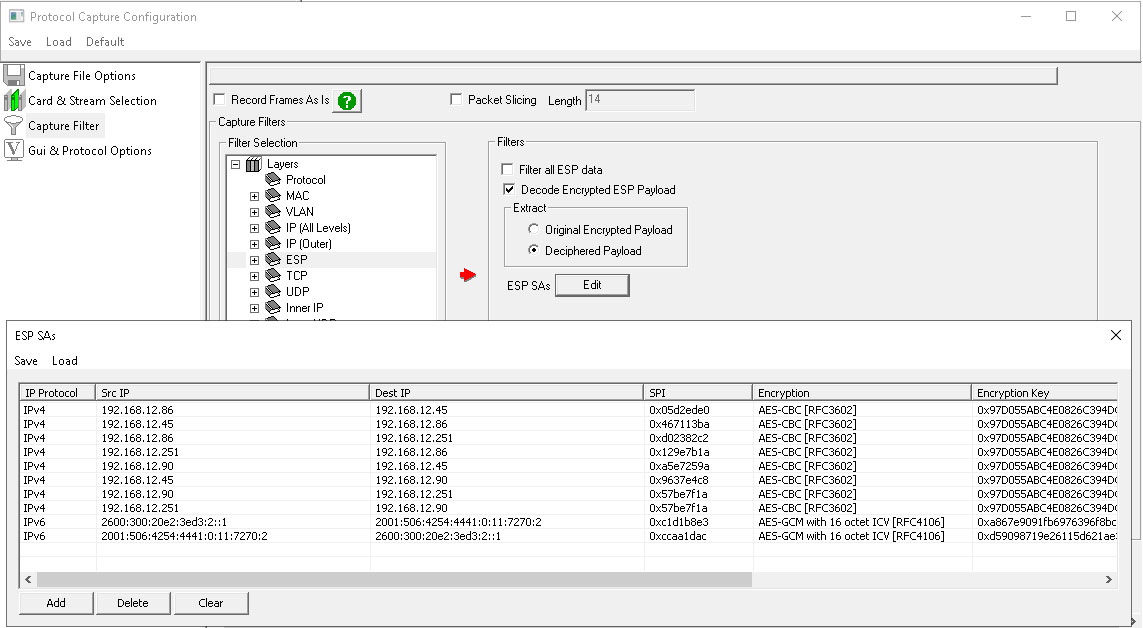
FastRecorder™ and PacketExtractor™ analyzer supports ESP protocol to decrypt ESP packets on both IPv4 and IPv6 by providing ESP SAs value.
eCPRI Analysis
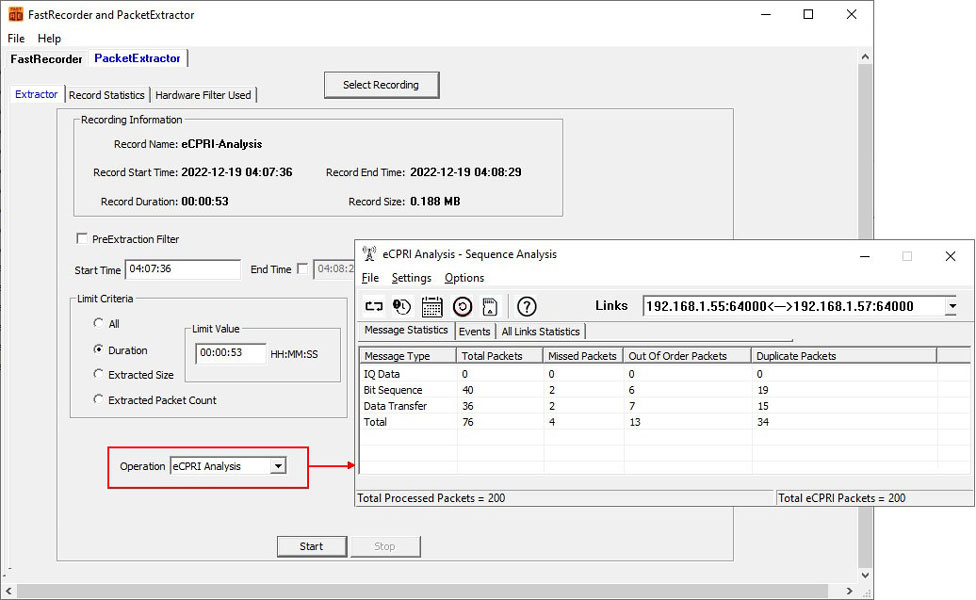
FastRecorder™ and PacketExtractor™ analyzer supports eCPRI analysis to monitor eCPRI traffic for packet impairments such as Missed Packets, Out of Order, Duplicate Packets, One-Way Delay etc. GL’s eCPRI protocol analysis tool supports eCPRI message types such as IQ Data, Bit Sequence, Generic Data Transfer, Remote Memory Access, One-way Delay Measurement, Remote Reset, and Event Indication for analysis and statistics
Analysis of Extracted Traffic
The extracted files can be analyzed using PacketScan™ HD and Wireshark application
BERT Verification
The BERT verification analyzes the received BER pattern and provides various vital measurements such as Status, Mismatch SeqNum, Sync Loss, Bit Error, Bit Error Rate, and Byte Count.
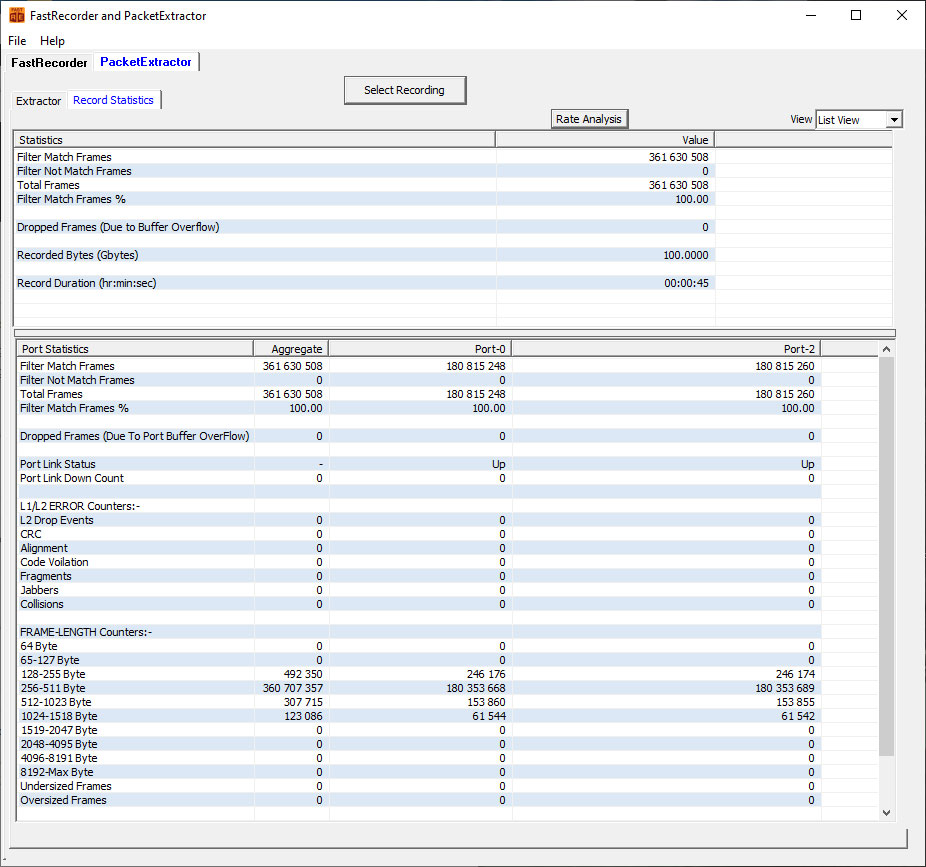
Record Statistics
Display the information of recorded file:
- Filter Match Frames
- Filter Not Match Frames
- Total Frames
- Filter Match Frames %
- Dropped Frames (Due to Buffer Overflow)
- Record Duration (hr:min:sec)
IP Analytics™
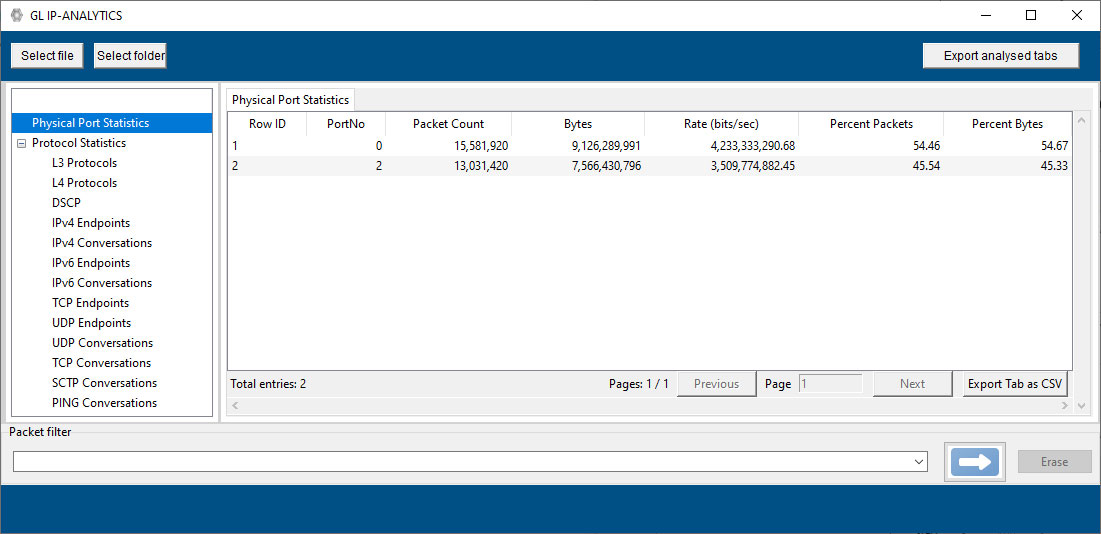
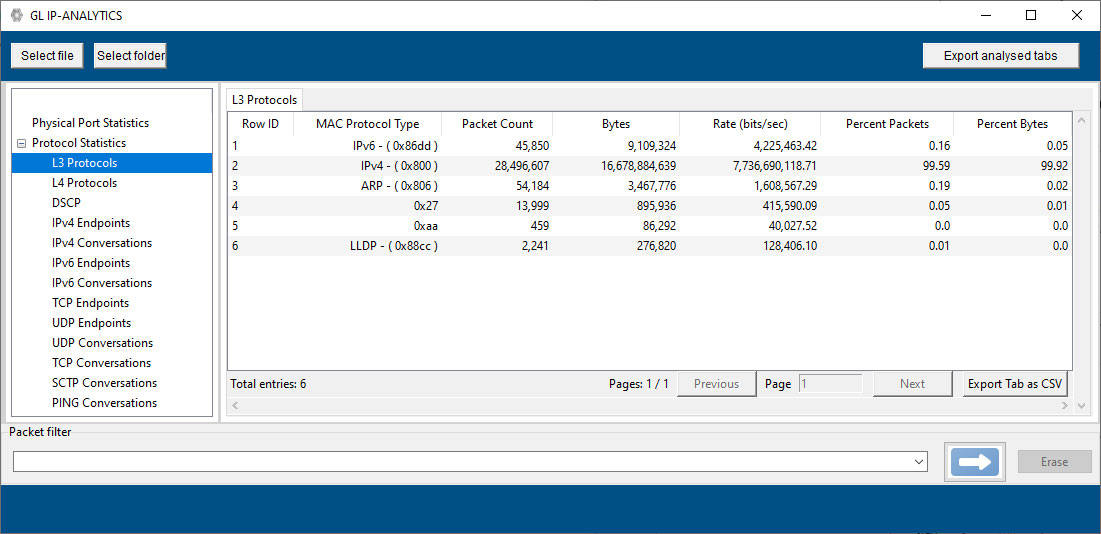
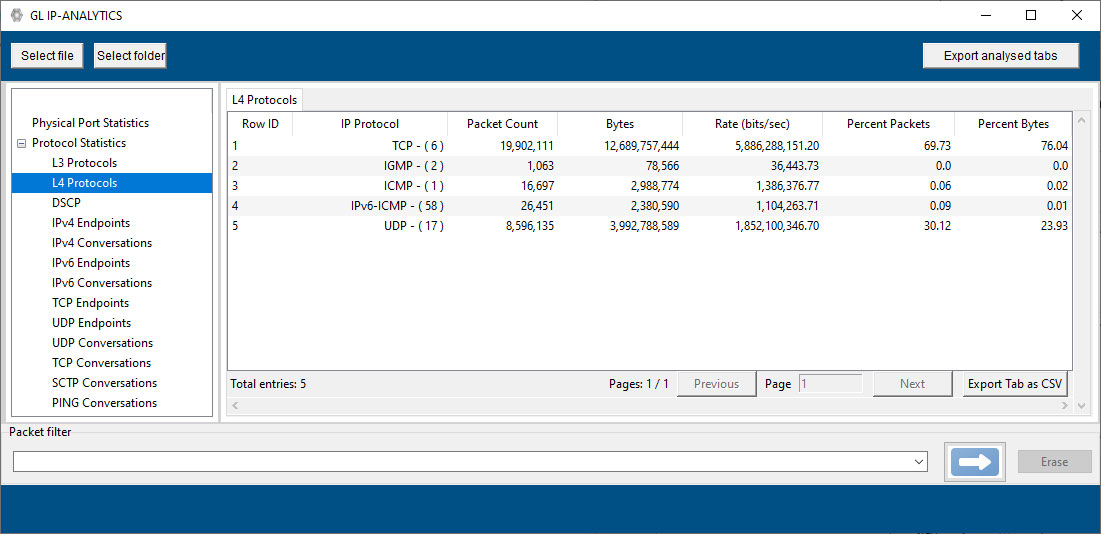
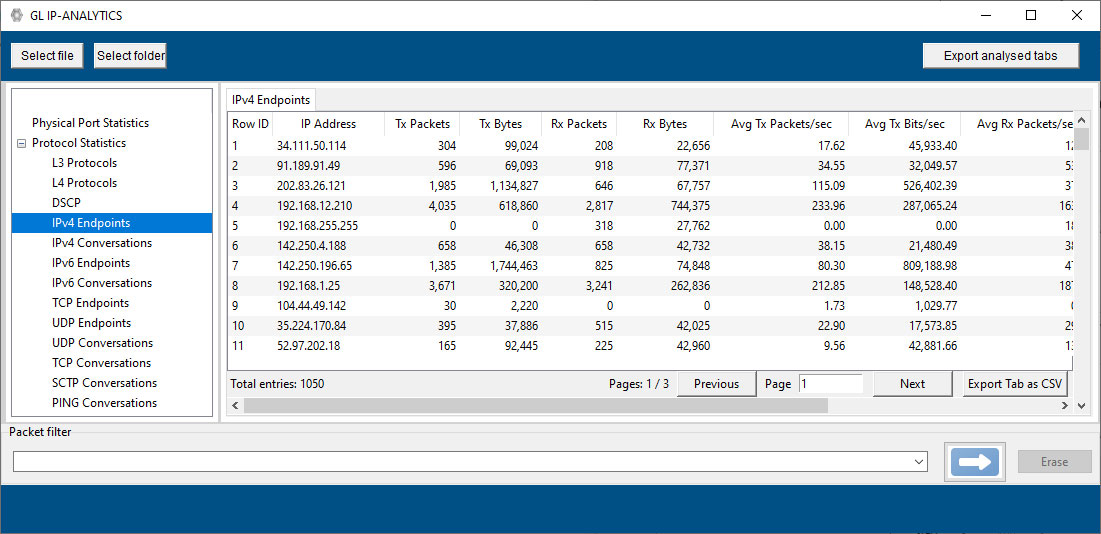
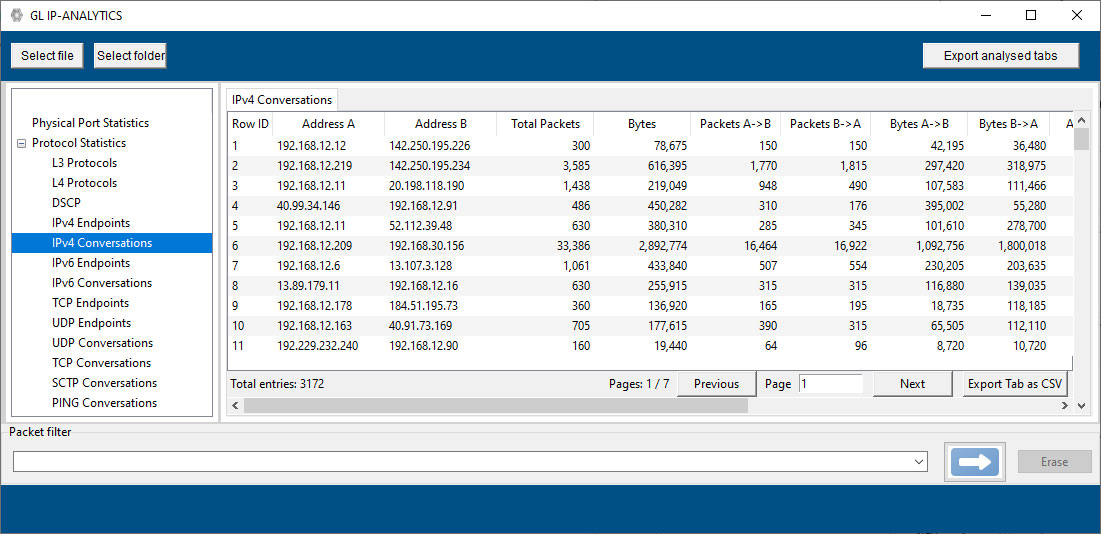
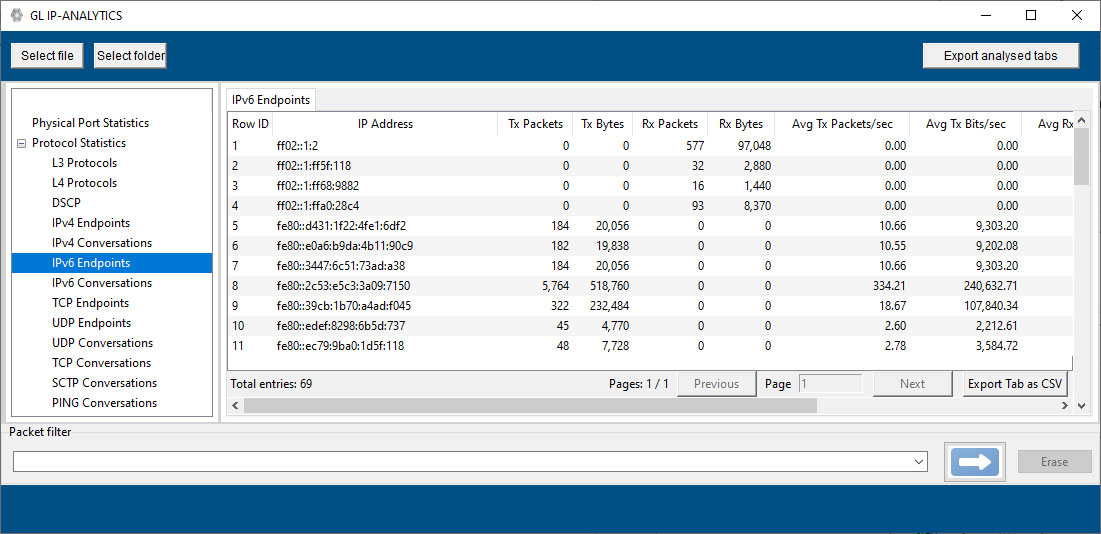
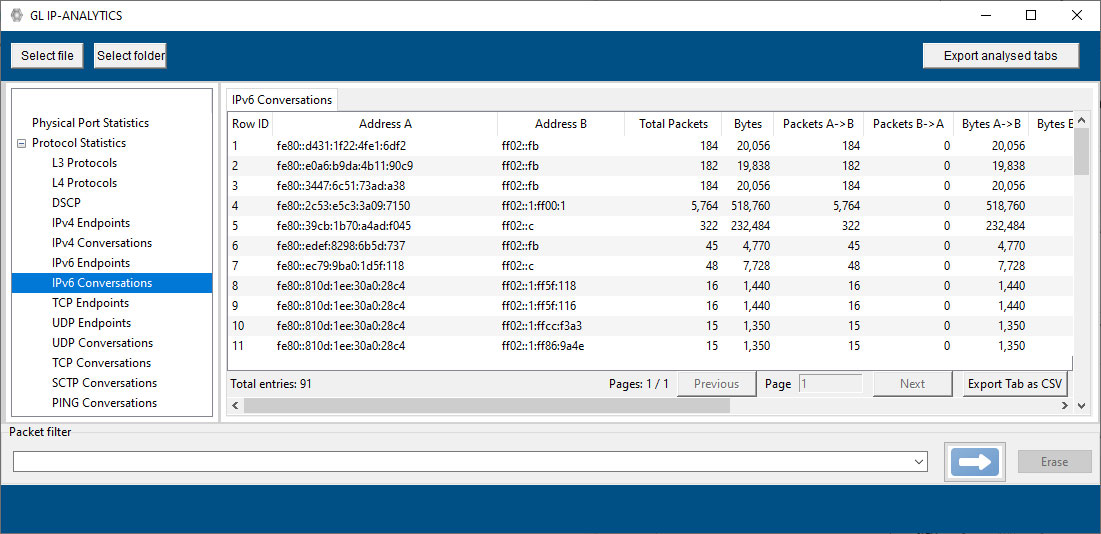
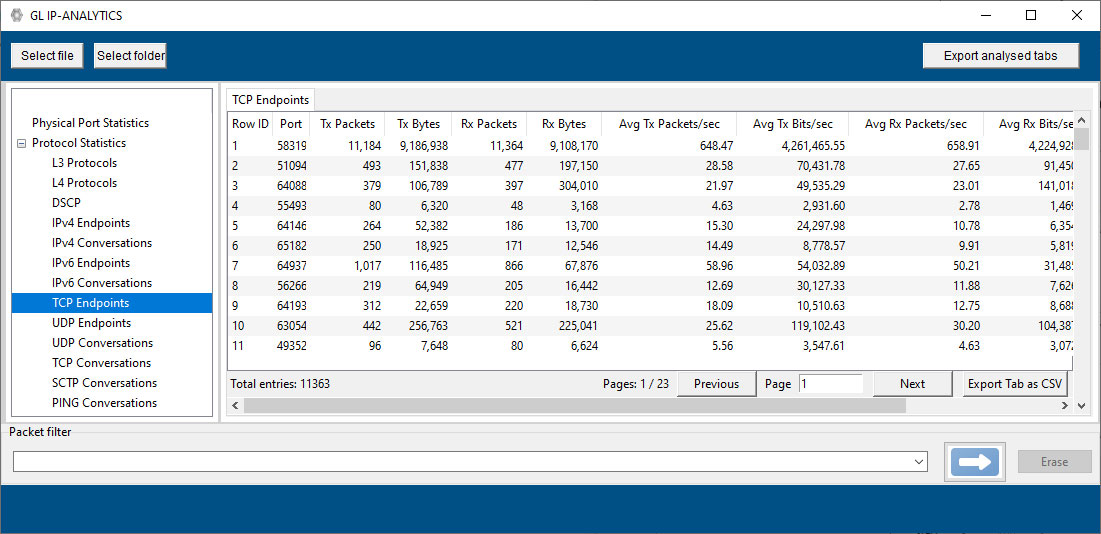
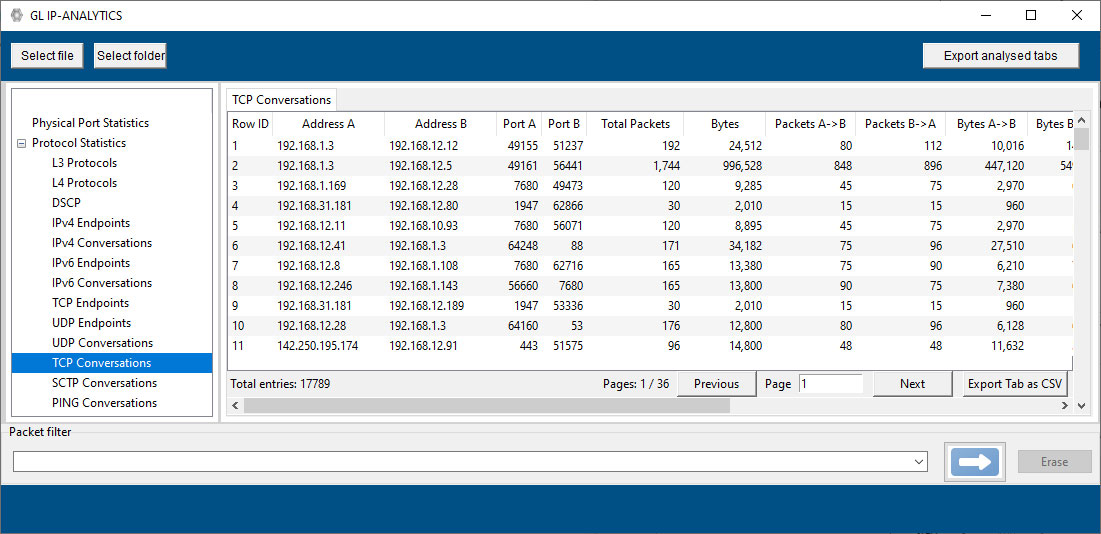
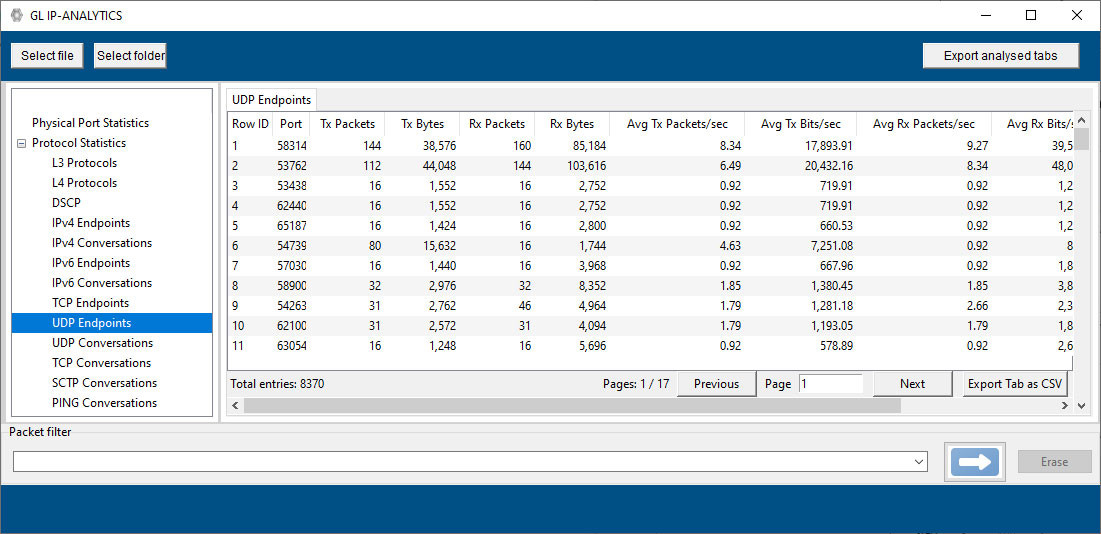
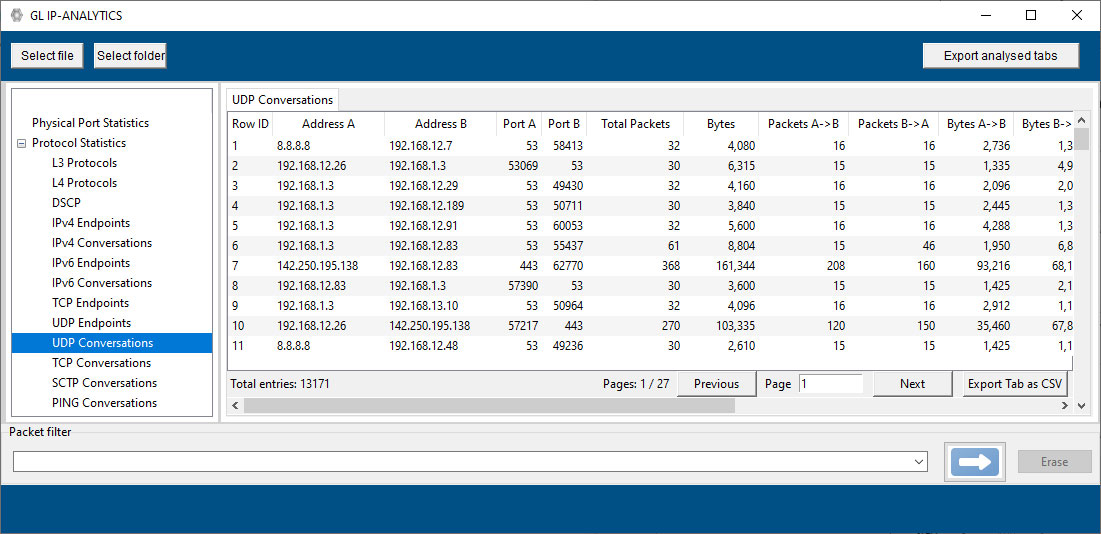
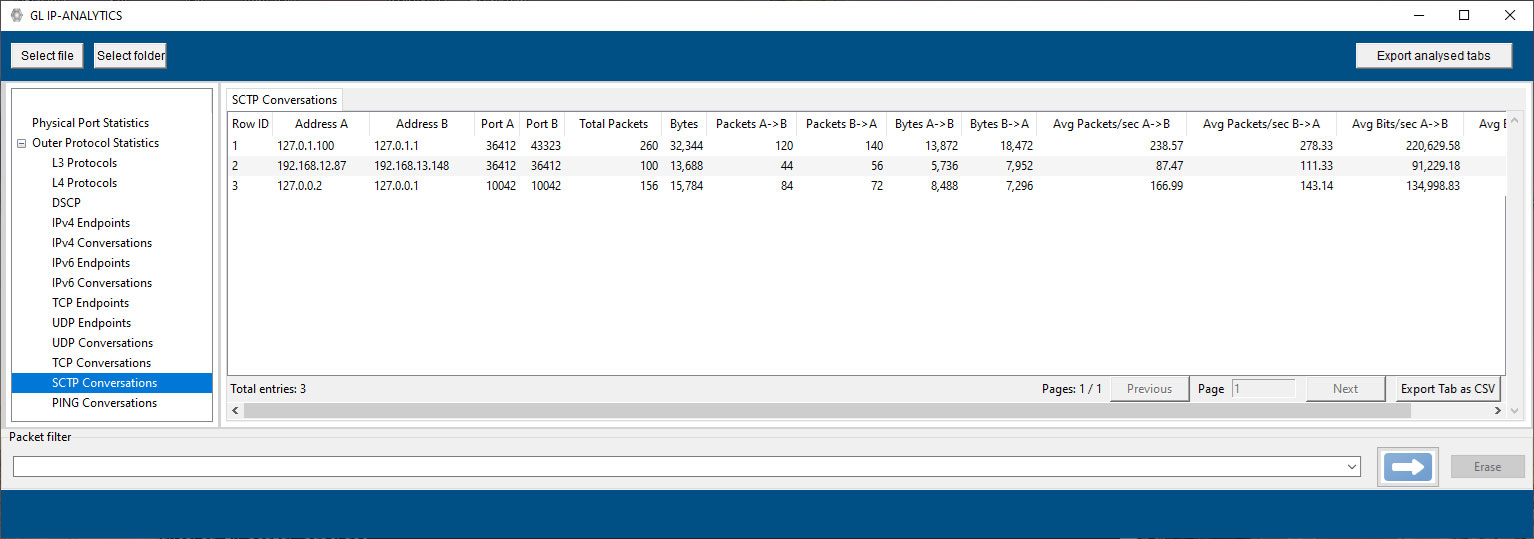
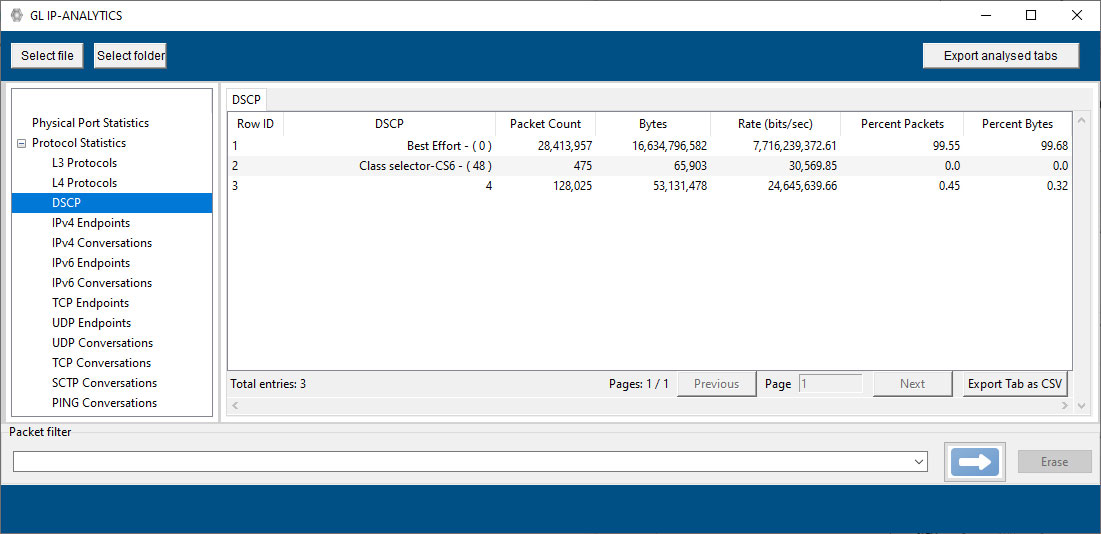
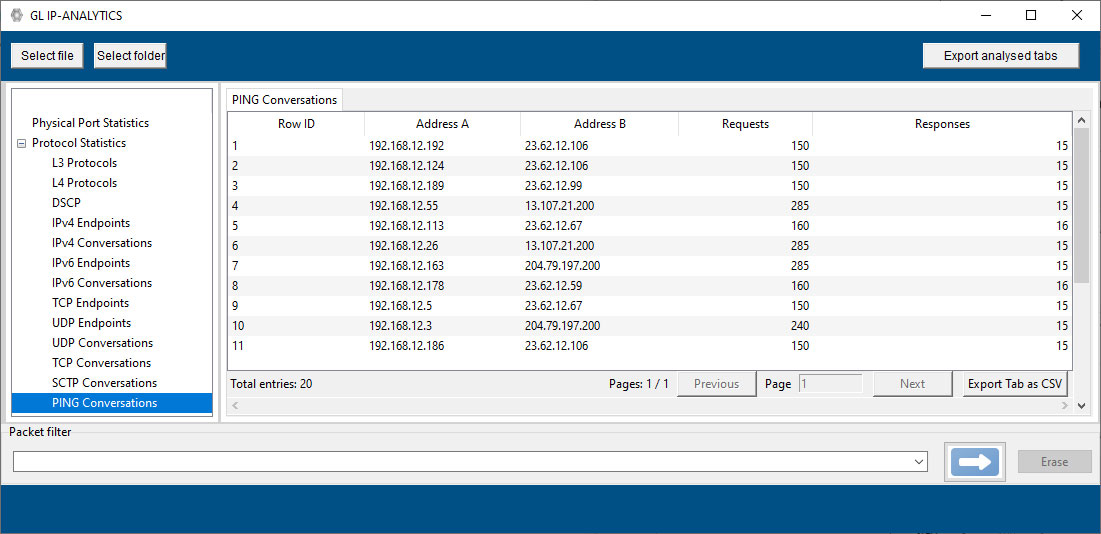
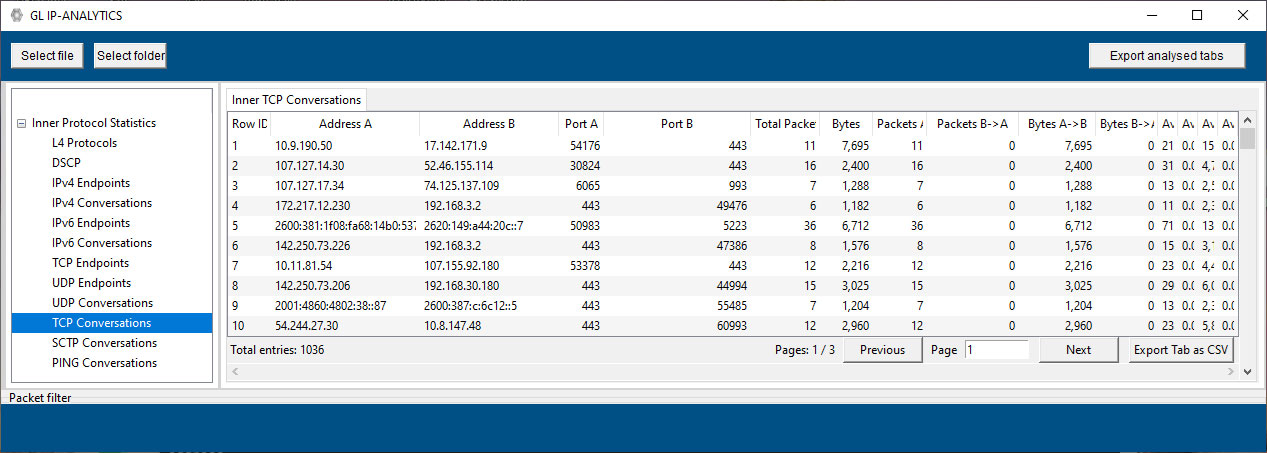
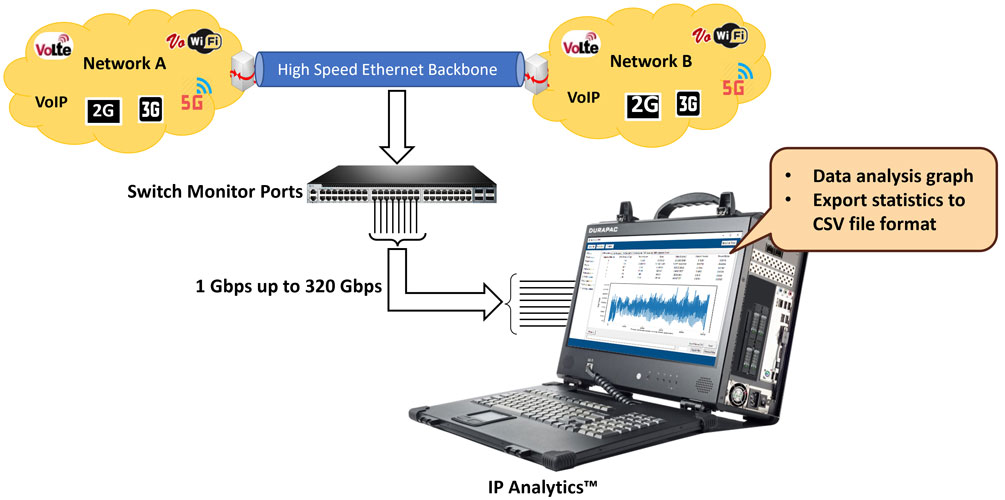
IP Analytics™ (PKV410), an optional add-on with FastRecorder™ and PacketExtractor™ plays a crucial role for monitoring and maintaining Quality of Service (QoS) in telecom networks. This involves analyzing IP-based data streams to ensure that voice, video, and data services meet predefined performance standards. IP Analytics™ provides detailed insight into recorded IP traffic captured at high speed. By analyzing IP traffic and data, telecom companies can enhance network performance, troubleshoot malfunctioning infrastructure, improve customer satisfaction, and increase operational efficiency. GL IP-ANALYTICS displays statistics for Layer 3, COS, Layer 4, IPv4 Endpoints, IPv6 Endpoints, UDP Endpoints, TCP Endpoints, UDP Conversation, and TCP Conversation.
At the core of IP Analytics™ lies its capability to capture all Ethernet packets and intricately organize them into flows, categorizing them based on key parameters such as IP Class Of Service, IP Address (both Source and Destination), and UDP/TCP Port Numbers (both Source and Destination).
IP Analytics™ enables you to categorize packets and flows with precision, offering several perspectives:
- Flow based on IP Class Of Service: Understand how different classes of service impact your network's performance
- Flow based on Unique IP Address: View the amount of traffic transmitted and received by individual IP nodes, offering insights into network load and potential bottlenecks
- Flow based on IP Conversation: Analyze the traffic between pairs of IP nodes, enhancing your understanding of network interactions
- Flow based on Applications: Identify application-specific traffic patterns based on TCP/UDP port numbers, crucial for application performance monitoring
Setting IP Analytics™ apart is its capability to compute and visualize crucial network metrics with millisecond precision. This includes measuring Packet Count and Byte Count for Each Flow, enabling assessment of data volume within each categorized flow. Additionally, dynamically calculating and plotting Packets/sec and Bits/sec offers real-time insights into network throughput. These metrics extend beyond individual flows to encompass each Ethernet port, furnishing a comprehensive overview of network performance.
Key Features
- Includes detailed analysis of different IP layers such as Ports, Layer 3 Protocols, L4 Protocols, DSCP, IPv4 Endpoints, IPv4 Conversations IPv6 Endpoints, IPv6 Conversations TCP Endpoints, UDP Endpoints, UDP Conversations, TCP Conversations, SCTP Conversations, and Ping Conversations
- Enhanced to support Tunneled Protocol Statistics for L4 Protocols, DSCP, IPv4 Endpoints, IPv4 Conversations, IPv6 Endpoints, IPv6 Conversations, TCP Endpoints, UDP Endpoints, UDP Conversations, TCP Conversations, SCTP Conversations, and Ping Conversations
- Provides in-depth graph analysis for both Bits/sec and Packets/sec
- Provides advanced filters to analyze the required packets
- Easily export information from all tabs or specific tab information to CSV file format for further analysis
- Allows selection of either a single Data Analysis HDF5 file or multiple HDF5 files from the folder
- Provides the flexibility to sort columns in Ascending or Descending order for easier data interpretation
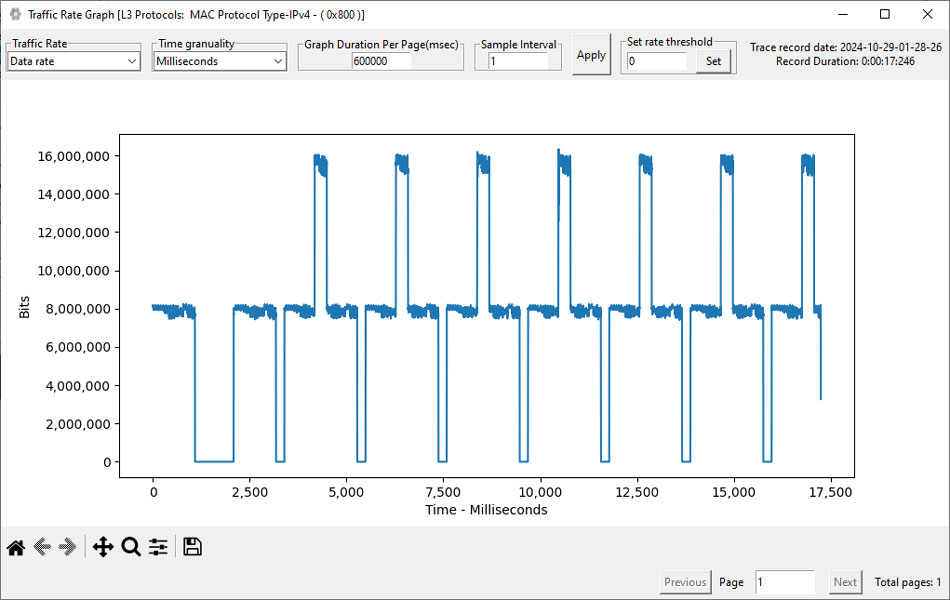
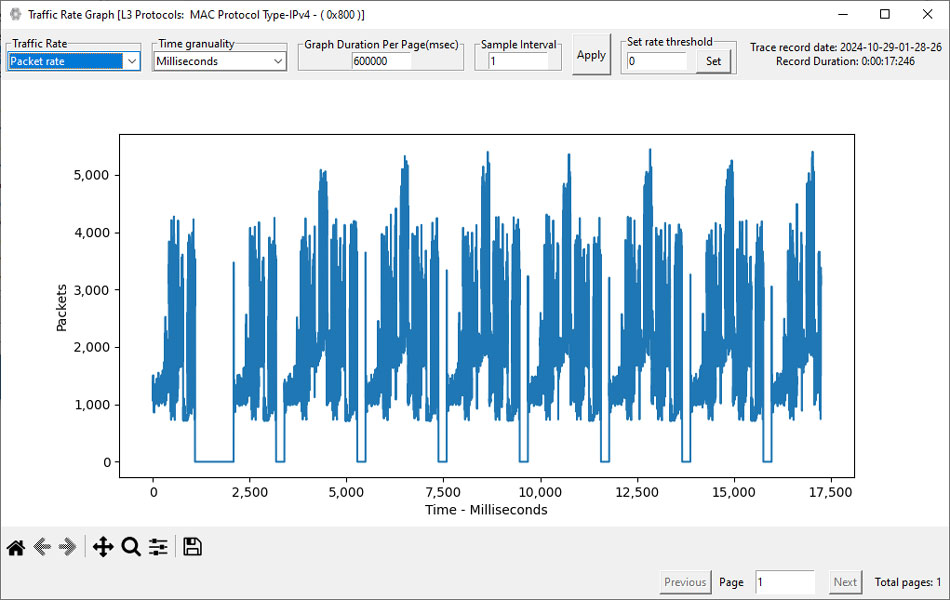
- Traffic Rate is supported for both Packet Rate and Data Rate with time granularity options of “Seconds”, “Milliseconds”, and “Microseconds” intervals
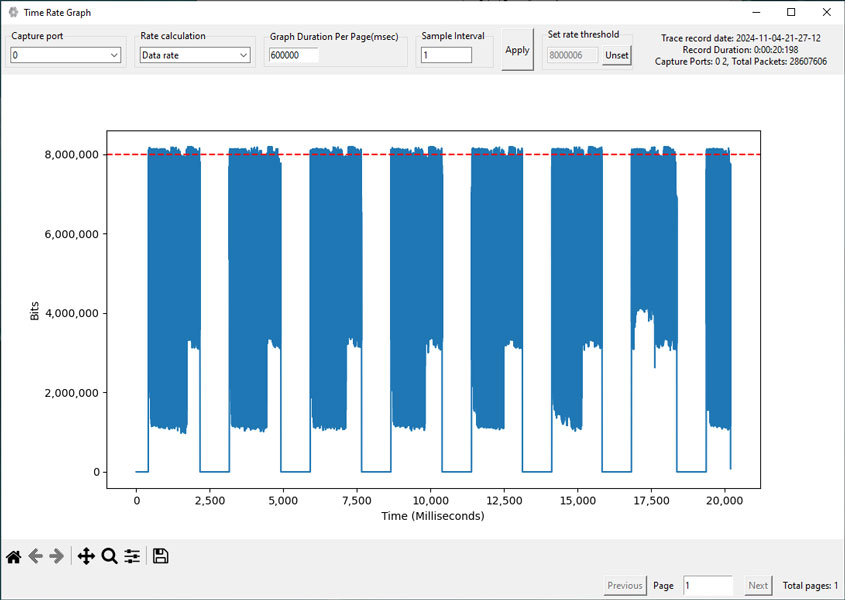
- Rate Analysis displays “Trace record date”, “Record Duration”, “Capture Ports” and “Total Packets” counts
- Added “Set Rate Threshold” option which allow users to define a threshold value for displaying a horizontal line across the y-axis
Data Analysis
Leveraging the export capabilities from IP Analyzer, which is then converted into HDF5 format, IP Analytics™ allows you to perform extensive data analytics operations using VAEX (Python Library). This integration ensures that you can easily handle large datasets, applying various analytics operations with efficiency and speed.
Additionally, IP Analytics™ introduces a powerful customized filtering mechanism. This feature empowers users to conduct detailed analysis on specific portions of the traffic, enabling targeted troubleshooting and performance optimization.
IP Analytics™ transforms how users view and manage network traffic. Whether users are looking to monitor application performance, optimize network flow, or simply gain deeper insights into the network's data patterns, IP Analytics™ provides the tools and precision you need.
Using PacketScan™ HD system along with FastRecorder™ application, users can capture the traffic and analyze the captured data using GL IP Analytics™ tool. This device comes in rack-mountable and portable form factors and supports data rates from 1 Gbps to 100 Gbps. Therefore, it is an all-in-one solution for both high speed capture and real-time analysis.
GL's IP Analytics™ tool is designed to analyze HDF5 files, extracting comprehensive statistics. From Layer 3 Protocols to Layer 4 Protocols, and beyond, it provides insights into IPv4 Endpoints, IPv4 Conversations, IPv6 Endpoints, IPv6 Conversations, UDP Endpoints, TCP Endpoints, UDP Conversation, TCP Conversation, SCTP Conversations, Ping Conversations, and Port wise details. It is an easy-to-use solution for in-depth data exploration.

Data Analysis Graph
Rate Analysis
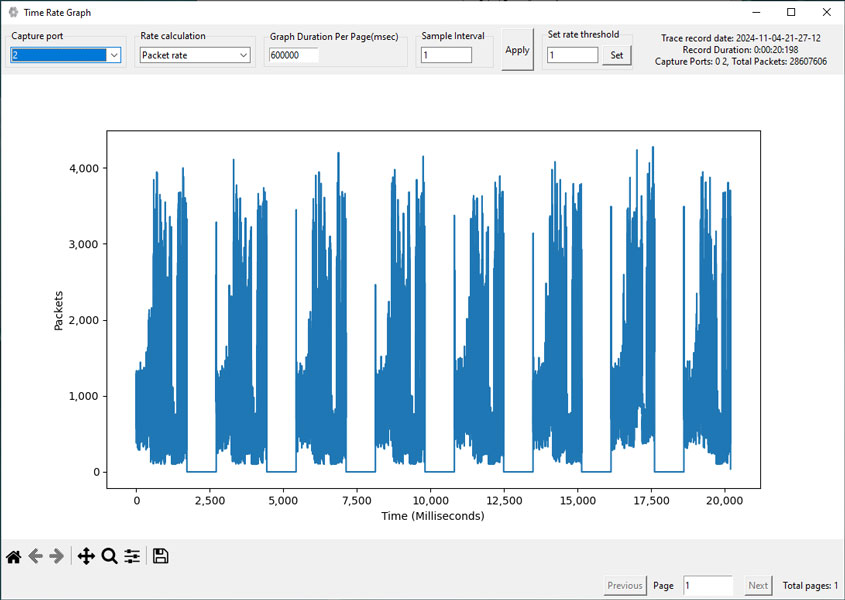
With PacketExtractor™, an optional add-on to PacketScan™ HD, users can now conduct Rate Analysis effortlessly. We have integrated GL's Time Rate Graph Plotter tool for enhanced functionality.
Rate Analysis Graph
With PacketExtractor™, conducting Rate Analysis is effortless using the Time Rate Graph. This feature analyzes HDF5 files and generates detailed graphs for each recorded port.
Protocol Statistics
Provides advanced filtering capabilities for Outer protocol with filter expressions such as “eth.type, length, ip.dscp, ip.addr, ip.src, ip.dst, ip.proto, udp.port, udp.src, udp.dst, tcp.port, tcp.src, tcp.dst, port, sctp.src, and sctp.dst”.
Inner Protocol Statistics
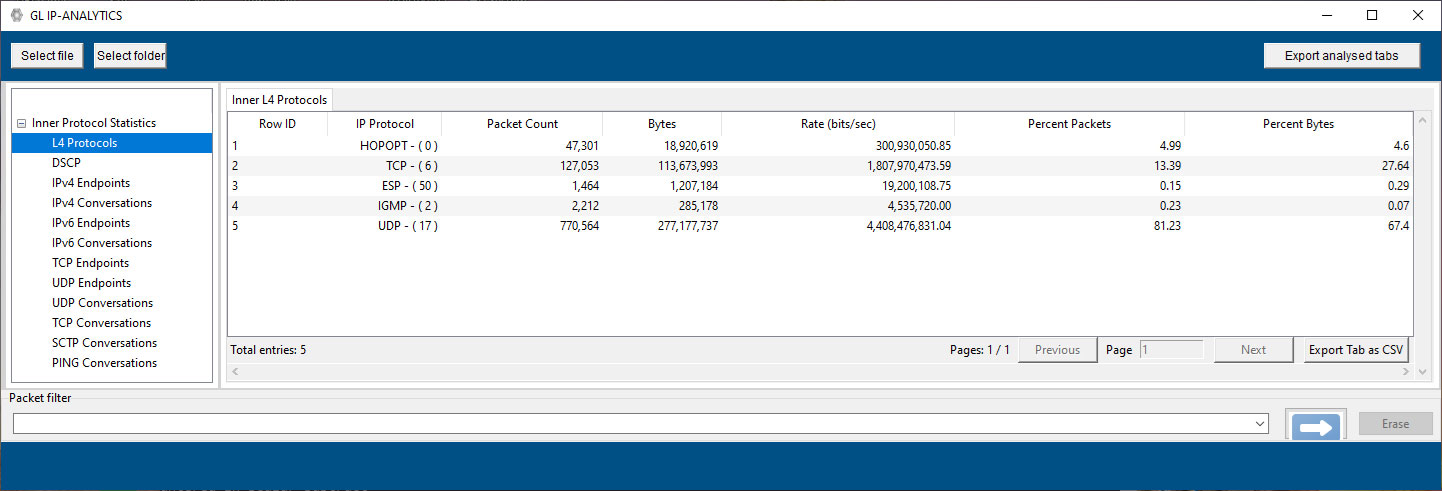
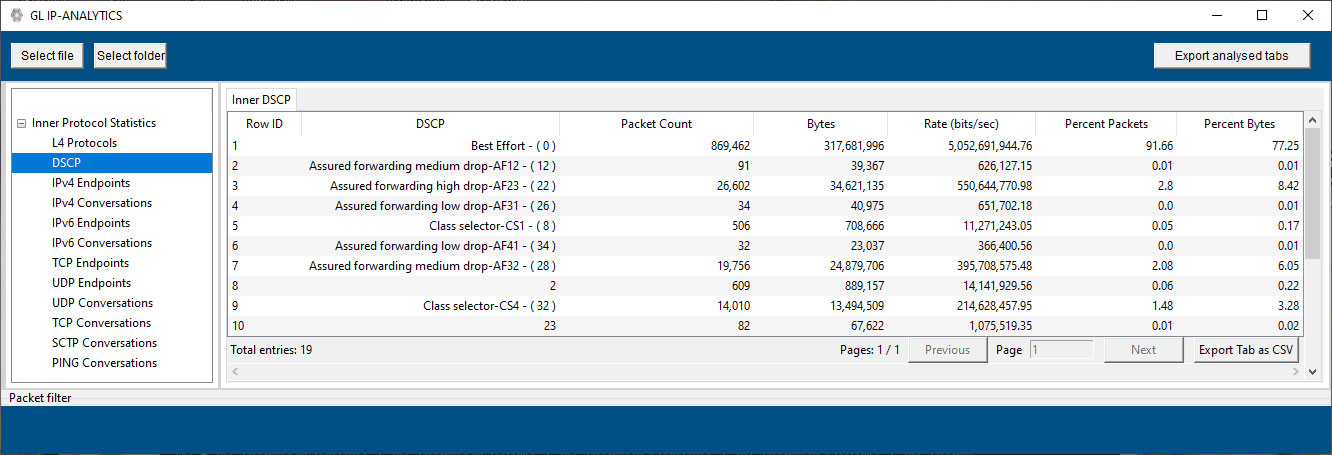
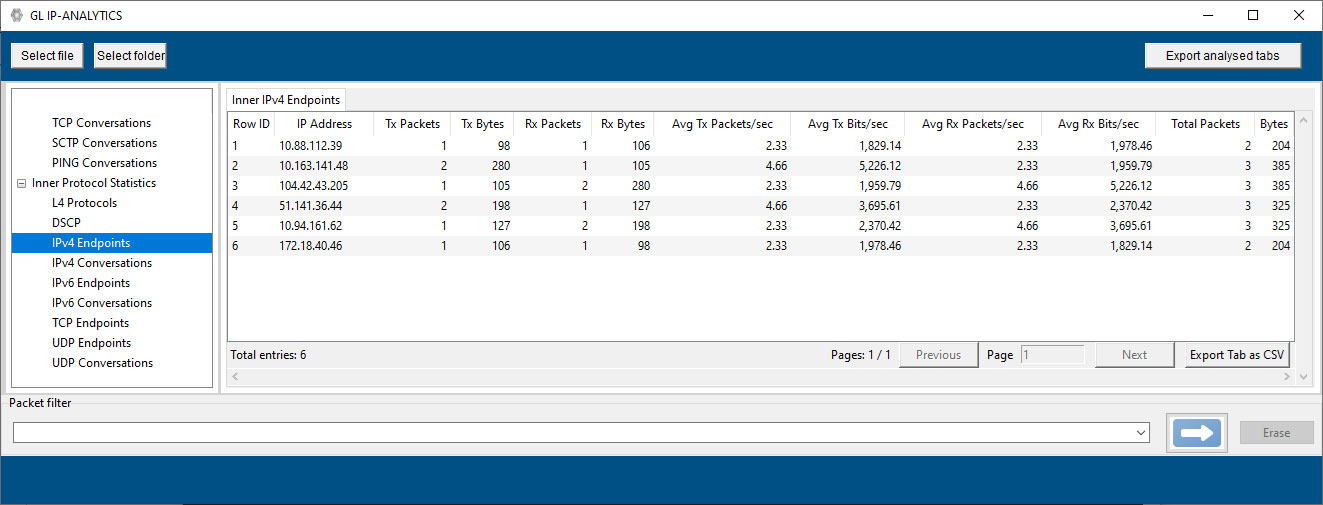
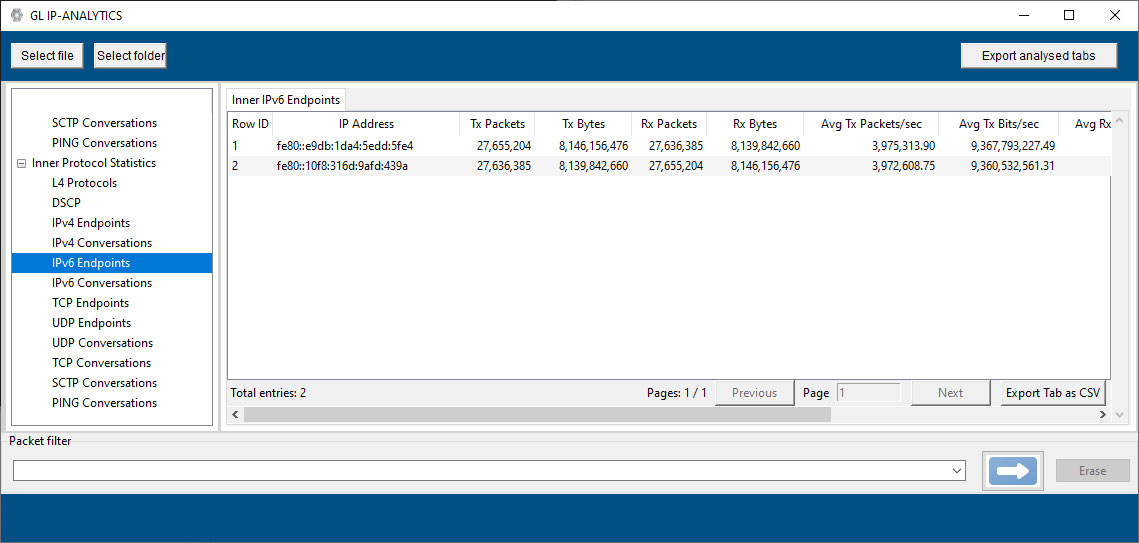
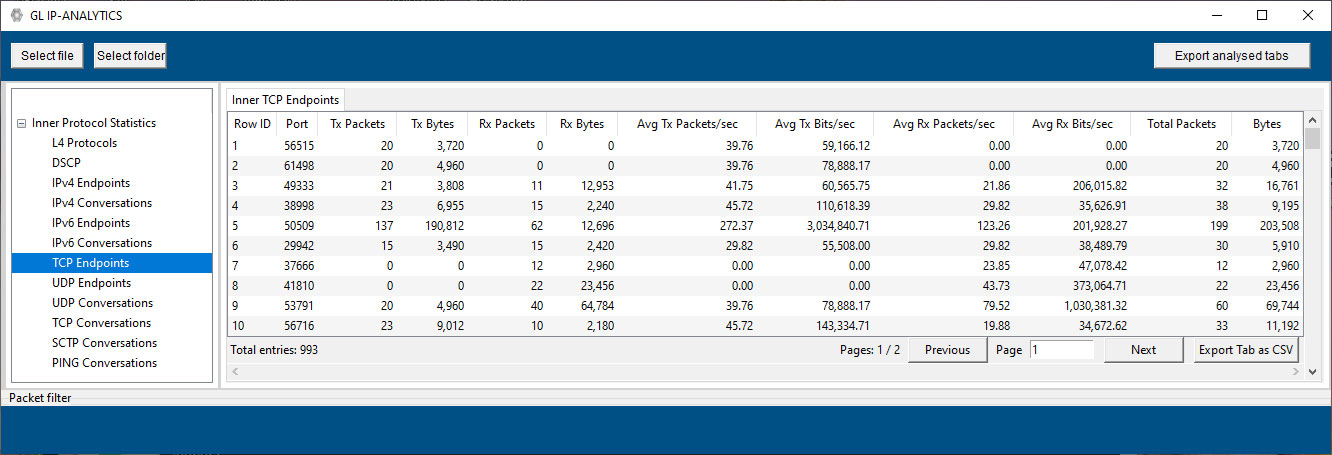
Supports Inner protocol statistics for L4 Protocols, DSCP, IPv4 Endpoints, IPv4 Conversations, IPv6 Endpoints, IPv6 Conversations, TCP Endpoints, UDP Endpoints, UDP Conversations, TCP Conversations, SCTP Conversations, and Ping Conversations. Also provides advanced filtering capabilities for Outer protocol with filter expressions such as “eth.type, length, ip.dscp, ip.addr, ip.src, ip.dst, ip.proto, udp.port, udp.src, udp.dst, tcp.port, tcp.src, tcp.dst, port, sctp.src, and sctp.dst”.
Resources
| Item No. | Item Description |
PKV123 |
FastRecorder™ and PacketExtractor™ |
| Related Software | |
| PKV410 | IP Analytics™ - Optional with FastRecorder™ and PacketExtractor™ (Gain extensive network intelligence with detailed information on endpoints and conversations for IP, UDP, TCP, and SCTP protocols; Requires PKV123) |
PKV100 |
PacketScan™ (Real-time and Offline) |
PKV101 |
|
PKV170 |
NetsurveyorWeb™ (Perpetual License, Unlimited Users/Nodes) |
PKV169 |
NetsurveyorWeb™ Lite |
| Related Hardware | |
PKV120 |
PacketScan™ HD - High Density IP Traffic Analyzer w/ 4x1GigE |
PKV120p |
PacketScan™ HD w/4 x 1GigE - Portable |
PKV122 |
PacketScan™ HD - High Density IP Traffic Analyzer w/ 2x10GigE |
PKV122p |
PacketScan™ HD w/2 x 10 GigE - Portable |
PKV124 |
|
PKV124P |
|
| Traffic Options | |
| GTP Mobile Traffic Options | |
|---|---|
ETH101 |
MobileTrafficCore - GTP |
| RTP Traffic Options | |
PKS102 |
RTP Soft Core (additional) |
PKS103 |
RTP IuUP Softcore |
PKS200 |
RTP Pass Through Fax Emulation |
PKS211 |
T.38 Fax Simulation |
PKS107 |
RTP EUROCAE ED-137B |
PKS108 |
RTP Voice Quality Measurements |
PKS106 |
RTP Video Traffic Generation |
PCD103 |
Optional Codec – AMR – Narrowband (requires additional license) |
PCD104 |
Optional Codec - EVRC (requires additional license) |
PCD105 |
Optional Codec – EVRC-B (requires additional license) |
PCD106 |
Optional Codec – EVRC-C (requires additional license) |
PCD107 |
Optional Codec – AMR - Wideband (requires additional license) |
PCD108 |
Optional Codec - EVS (requires additional license) |
PCD109 |
Optional Codec - Opus (requires additional license) |
| Brochures |
| FastRecorder™ and PacketExtractor™ Brochure |
| PacketScan™ Brochure |
| PacketScan™ HD Brochure |
| eCPRI Protocol Analysis Brochure |
| Supported Codecs |
| GL Product Lists |
| Presentations |
| FastRecorder™ and PacketExtractor™ - Presentation |
| PacketScan™ HD - Presentation |
| eCPRI Protocol Analysis Presentation |
| Webinars |
|

|
