Voice Quality Testing for Wireless, VoIP and Analog Networks
(POLQA v3, POLQA v2.4, PESQ)
Latest Software
- VQT SoftwareVer 8.3
- VQuad™ Software Ver 11.4.9
- Voice Analysis Tool (VAT™) Ver 1.2
- WebViewer™ (ORACLE & MySQL) Ver 7.0
- AutoVQT™ Software Ver 2.3
Brochure Request a Demo / Quote
Overview
GL's Voice Quality Testing (VQT) software actively supports the next-generation voice quality testing standard for fixed, mobile and IP-based networks using Perceptual Objective Listening Quality Assessment (POLQA) version 2.4 and optional upgrade version 3 (ITU-T P.863), Perceptual Evaluation of Speech Quality (PESQ ITU-T P.862), PESQ LQ / LQO (P.862.1), PESQ WB (P.862.2). VQT analyzes the degraded (received) files and compares them with the reference (sent) files using ITU standard algorithms PESQ LQ/LQO/WB, and POLQA (Narrowband, Wideband, Super wideband).
PESQ provides an objective measurement of subjective listening tests on telephony systems. POLQA, Perceptual Objective Listening Quality Analysis, is the successor of PESQ (ITU-T P.862) analysis and the next generation voice quality testing standard for fixed, mobile and IP-based networks.
POLQA® is a registered trademark of OPTICOM. GL is one of the Test & Measurement manufacturers that has adopted POLQA/P.863 in its Voice Quality Test solution, by obtaining the essential rights to use POLQA® standard, and hereby acknowledge that the images or text references to POLQA used in this document originally copyrights with Opticom.
VQT application is available with the following algorithms:
- POLQA only (Optional upgrade POLQA v3)
- POLQA (Optional upgrade POLQA v3) with PESQ
- PESQ only
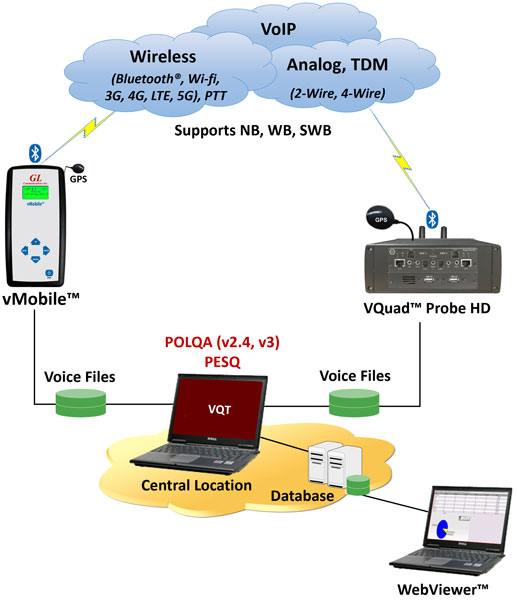
VQT works in conjunction with VQuad™, Voice Analysis Tool (VAT™), VQuad™ Probe HD or vMobile™ handheld device to provide "end-to-end assessment" with additional test and measuring capabilities. VQuad™ scripting allows for automated call control, and traffic simulation to conduct tests on Wireless, IP, PSTN and TDM networks. The captured data are analyzed in VQT and the results of the VQT algorithms, POLQA and PESQ LQ/LQO/WB, are displayed both in tabular format as well as graphically. Additional analytical results are displayed as part of the assessment such as POLQA MOS, E-Model, Signal Level, SNR, jitter, clipping, noise level, and delay (end to end as well as per speech utterance). All results are saved to file and database for post processing viewing along with sophisticated searching on the results within the VQT application and using the WebViewer™ (remote and local access).
VQT POLQA Measurements and Analysis
GL has improved its Voice Quality Test (VQT) with AutoVQT™, an advanced, automatic application that utilizes the POLQA algorithm (as per the ITU-T P.863 version 2.4 standard) to analyze thousands of voice files in mere minutes, effectively evaluating the quality of voice communication across various applications, including VoIP, Mobile, and PSTN networks
Indoor Tracking System (ITS) : ITS functionality provides plotting of the VQT results to the indoor location where GPS is not available. Indoor locations could include underground train stations, inside buildings, tunnels, or any location where you wish to plot Voice Quality and GPS is not available. The ITS results include the VQT measurements (based on user-defined ratings) plotted against the user-provided graphical location map. ITS is an optional application available within the VQuad™ and vMobile™ for both online and offline viewing of the results associated with the ITS.
Main Features
- Voice quality testing using POLQA version 2.4 (ITU-T P.863), with an upgrade to POLQA version 3 (ITU-T P.863), and PESQ (ITU-T P.862)
- Updates associated with POLQA v3 include a redesigned perceptual model for Full Band Audio analysis which is validated for VoLTE, 5G and OTT apps (supporting EVS and OPUS codecs)
- Supports PESQ ITU-P.862.2 and POLQA for Wideband
- POLQA ITU-T P.863 for next generation voice quality testing supporting NB (8000 sampling), WB (16000 sampling) and SWB (Super Wideband) (48000 sampling)
- Evaluate audio quality with MOS, E-Model, SNR, jitter, clipping, signal level, noise level, and delay measurements
- VQT also support analysis of uncompressed wav files consisting of narrow band, wide band and super wide band signals
- Provides POLQA and PESQ Mean Opinion Score (MOS) results
- Sophisticated search features on the results within the VQT application
- Playback and display of audio files from within VQT using Goldwave software
- Complete automatic logging of all results (both file and database) with the ability to import log back into VQT
- All results along with call control information are sent to central database. Query results remotely using the WebViewer™
- Support for Central DB Primary and Secondary IP addresses for backup and redundancy
- Real-time mapping (most countries supported) of results when optional GPS is used in conjunction with VQuad™/vMobile™
- Command Line Interface (CLI) support to control VQT nodes remotely. Supported on Windows® and Linux operating systems
POLQA v3 Upgrade Enhancements
- POLQA v3 Super Wideband supports 14kHz to full audio bandwidth up to 24kHz
- Full band analysis improves accuracy in assessment of codecs such as EVS, OPUS, AAC and LC3, as these codecs are used in many OTT applications
- With full band support the discriminative power of POLQA at the upper high-quality range of the MOS scale is increased
- Current OTT voice services using VoLTE/5G include highly dynamic delay jitter which leads to variations of the duration of very short pauses during speech. POLQA v3 handles these variations with increased precision
- POLQA v3 is less sensitive to linear frequency distortions than POLQA v2.4. This makes measurements less dependent on the frequency characteristics of headsets
- Perceptual model of POLQA v3 is significantly improved and streamlined
ITU Algorithms
The GL Voice Quality Testing (VQT) product utilizes several industry standard ITU algorithms in order to measure the speech quality of a transmitted voice file. VQT compares the original unprocessed signal with the degraded version using POLQA (ITU-T P.863) and PESQ (ITU-T P.862+P.862.1) international standard voice quality test methods. The GL VQT can either be installed or operated on a stand-alone system or reside as an optional feature, on other GL products. GL's VQuad™ also supports the POLQA (ITU-T P.863) standard for voice quality analysis
- Perceptual Objective Listening Quality Analysis (POLQA)
- Operations Performed by POLQA
- Results Provided by POLQA
- Perceptual Evaluation of Speech Quality (PESQ)
- Operations Performed by PESQ
- Results Provided by PESQ
- ITU.56 Measurements
POLQA Vs PESQ - Comparison
| POLQA | PESQ |
|---|---|
| Adopted in 2011, ITU-T P.863 | Adopted in 2001, ITU-T P.862 |
| Suitable for 3G and 4G networks, VoIP networks and NGN networks delivering HD- quality voice services such as "wideband" and "super-wideband" telephone calls, 7 kHz and 14 kHz frequency range. | Suitable for G.711 A law and u law, and low bandwidth 300 to 3400 Hz voice bandwidth. Also supports WB (7kHz frequency range) using PESQ ITU-T P.862.2. |
| POLQA works quickly and accurately. POLQA is superior to existing standards, and has overcome all known issues and limitations of PESQ. | PESQ-based measurements will still be considered an industry standard for several years, also for reasons of backward compatibility. |
Frequently Asked Questions
- What is GL’s Voice Quality Testing (VQT) software?
- VQT is GL’s software that compares reference (sent) and degraded (received) voice files using ITU algorithms POLQA and PESQ to objectively measure voice quality over fixed, mobile, and IP networks.
- Which ITU algorithms does VQT support?
- VQT supports POLQA (ITU T P.863) version 2.4 with optional upgrade to version 3, and PESQ (ITU T P.862, P.862.1, P.862.2) including PESQ LQ, LQO, and wideband modes.
- What kind of networks can be tested with VQT?
- VQT can test voice quality over wireless (3G/4G/LTE/5G), VoIP/OTT, PSTN, TDM, and next generation networks delivering narrowband, wideband, and super wideband services.
- What are POLQA and PESQ in simple terms?
- POLQA (P.863) and PESQ (P.862) are perceptual objective algorithms that emulate human listening tests by comparing a clean reference speech signal with a degraded version and outputting quality scores on MOS like scales.
- What is the main difference between POLQA and PESQ according to GL?
- PESQ was originally designed for narrowband voice quality assessment and did not perform reliably in VoIP environments with the introduction of Wideband (WB) audio. To address these limitations, POLQA was developed and provides accurate voice quality assessment across Narrowband (NB), Wideband (WB), and Super-Wideband (SWB) networks. This is why POLQA is the recommended standard for modern VoIP and wideband voice applications.
- Which bandwidths does POLQA support in GL’s VQT?
- POLQA in VQT supports narrowband (300–3400 Hz, 8 kHz sampling), wideband (100–7000 Hz, 16 kHz sampling), and super wideband (50–14000 Hz, 48 kHz sampling), with flexible user-configurable bandwidths that allow users to configure intermediate audio bandwidths between WB and SWB, such as 24 kHz or 32 kHz sampling, based on test requirements. In v3, full-band audio up to 24 kHz is supported.
- Which file types and sample formats can VQT POLQA analyze?
- VQT POLQA supports analysis of both Raw PCM and WAV audio files, including 16-bit uncompressed PCM/WAV files (NB, WB, and SWB), 8-bit compressed A-law and μ-law files, and 12-bit raw PCM degraded voice files across Narrowband, Wideband, and Super-Wideband modes.
- Which file formats does VQT PESQ support?
- VQT PESQ supports 16 bit uncompressed PCM and WAV files for NB and WB, and 8 bit compressed A law and μ law voice files.
- What quality metrics does VQT report besides MOS?
- VQT reports E Model R Factor, signal level, noise level, SNR, jitter, clipping, delay (overall and per utterance), attenuation, active speech ratio, and several level related measurements such as ASL, MNL, and RMS.
- What MOS ranges are used for POLQA and PESQ?
- The PESQ and POLQA algorithms are based on a 1-5 scale (5 being best score). However, the upper limit ranges for PESQ and POLQA results are limited as follows.
POLQA MOS LQO ranges from about 1 to 4.5 for narrowband and wideband, and up to 4.75 for super wideband, while PESQ raw scores range roughly from −0.5 to 4.5 and mapped PESQ LQ/LQO scores lie between 1.0 and 4.5. - What is POLQA v3 and how is it used in VQT?
- POLQA v3 is the latest ITU T P.863 release supported as an optional upgrade in VQT; it introduces full band audio analysis, better handling of delay jitter, and an improved perceptual model for VoLTE, 5G, and OTT applications.
- How does POLQA v3 improve testing for modern codecs and services?
- POLQA v3 improves accuracy for codecs like EVS, OPUS, AAC, and LC3, increases discriminative power at high MOS scores, is less sensitive to linear frequency response variations, and more precisely handles dynamic jitter and micropauses commonly seen in VoLTE/5G/OTT traffic.
- Why is POLQA v3 less dependent on headset characteristics?
- Because v3’s perceptual model has reduced sensitivity to linear frequency distortions, measurements are less affected by the specific frequency response of headsets and similar terminal devices.
- How does VQT work with VQuad™, vMobile™, and probes?
- VQT works as the analysis engine that evaluates voice quality by comparing reference (Tx) and degraded (Rx) audio, while VQuad™, vMobile™, and other probes handle the actual call execution and audio capture. VQuad™ and vMobile™ generate and receive real calls over Mobile networks, Radio, SIP, or PSTN, play reference audio, and record the received PCM files along with call events. These recordings are then sent to VQT and call events are sent to WebViewer™, which aligns the signals and calculates objective voice quality metrics such as POLQA or PESQ across NB, WB, SWB sampling rate. The results are presented through the VQT interface or WebViewer™ for reporting, troubleshooting, and network performance evaluation.
- What is the difference between Auto Mode and Manual Mode in VQT?
- In Auto Mode, VQT monitors configured network folders and automatically runs quality algorithms on incoming voice files, while in Manual Mode a user explicitly selects a single reference/degraded file pair for one off analysis.
- How can VQT and VQuad™ be automated using Python?
- GL provides Python libraries that wrap VQuad™ and VQT CLI commands, allowing scripts to remotely trigger call control, traffic generation, and manual or automatic VQT tests with configurable settings and scheduling.
- What remote access mechanisms exist besides Python?
- VQuad™ and VQT expose full command line interfaces and Windows/Linux APIs, enabling remote control of nodes, configuration, call control, traffic actions, and retrieval of results and statistics over LAN/WAN/Internet.
- How are VQT results stored and accessed?
- VQT logs all analysis results to files and a central database, which can be queried and viewed locally or remotely via the WebViewer web interface in tabular or graphical form and exported to Excel or text.
- What information does WebViewer display for POLQA results?
- WebViewer™ can show degraded filename, rating, POLQA score, E Model R factor, speech and noise level gains, jitter statistics, active speech ratios, number of utterances, and average/min/max delay values.
- What statistical views does VQT provide?
- VQT offers tabular min/max/average statistics for all metrics plus graphical views such as global rating history, global score history, per instance score history, and rating statistics per auto measurement instance.
- How are rating criteria used in VQT?
- Users can configure thresholds for Excellent, Good, Fair, and Poor for all algorithms and metrics; VQT labels results accordingly and can selectively save or display only samples meeting specific rating categories.
- How does POLQA perform temporal alignment?
- POLQA splits signals into frame pairs, estimates delay for each, refines delays stepwise, and searches for degraded segments within the reference to accurately handle time scaled and delayed signals with limited computation.
- What is POLQA’s approach to sample rate mismatch?
- POLQA estimates a sample rate ratio from frame delays and active segments; if the ratio exceeds 0.01, the higher rate signal is downsampled and processing restarts once to bring both signals into a safe temporal alignment range.
- What non perceptual metrics does POLQA compute and why?
- POLQA calculates attenuation, signal and noise levels, SNR, and active speech ratio so that engineers can diagnose issues such as excessive gain/attenuation, added noise, and speech activity patterns beyond MOS alone.
- How does PESQ handle time varying delay?
- PESQ first aligns utterances, then aligns overlapping frames to track variable delay within utterances, and finally realigns “bad intervals” after auditory processing to correct difficult delay patterns before computing the quality score.
- What is PESQ disturbance processing?
- PESQ derives an error surface between reference and degraded sensation surfaces, accounts for masking, and then computes symmetric and asymmetric disturbance parameters that are linearly combined into the PESQ score.
- How is jitter defined in GL’s VQT context?
- Jitter is measured as variation in time offset between reference and degraded utterances; VQT reports average, minimum, maximum, and standard deviation of these offsets as jitter statistics.
- How does VQT detect and describe clipping?
- By comparing degraded and reference signals, VQT derives diagnostics for muting, discontinuous transmission behavior, front end and back end clipping, and hangover periods where transmission continues after speech ends.
- What level related metrics does VQT compute?
- For each file, VQT computes Active Speech Level, Mean Noise Level, RMS mean level, and DC offset, and then derives speech level gain and noise level gain by comparing degraded and reference measurements.
- What is PESQ per utterance and why is it useful?
- PESQ per utterance provides PESQ, PESQ LQ, and PESQ LQO scores for each individual utterance, helping isolate localized impairments such as front end clipping that may disproportionately affect overall scores.
- What is the Indoor Tracking System (ITS) feature?
- ITS allows plotting VQT measurements onto a user provided indoor map (e.g., stations, buildings, tunnels) where GPS is unavailable, visualizing voice quality at specific indoor locations.
- How does VQT use GPS outdoors?
- When used with VQuad™ or vMobile™ and optional GPS, VQT can perform real time mapping of voice quality results on geographic maps and display measurement points in Google Maps via WebViewer™.
- How is delay measured in VQT using PESQ and POLQA, and why is audio synchronization required? How do VQuad™ and vMobile™ handle delay measurement differently?
- In VQT, delay is measured using PESQ or POLQA by aligning the reference (Tx) and degraded (Rx) audio signals and calculating the time shift required for the best match, which represents the mouth-to-ear delay.
This is why proper audio synchronization is essential to ensure the correct files are compared and to avoid misalignment that could lead to inaccurate delay or MOS results. VQuad™ and vMobile™ typically operate in controlled environments and can use hardware or GPS-based time synchronization, allowing more precise delay measurements.
These solutions support One-Way Delay (OWD) and Round-Trip Delay (RTD) measurements when both ends are at the same location or when the two ends are geographically separated and equipped with GPS for accurate timing, which is especially important for OWD. VQuad™/vMobile™ analyzes the recorded audio file against the sent reference file using a correlation algorithm to derive OWD and RTD, providing significantly more accurate delay measurements than the one-way delay estimated by PESQ/POLQA, which relies primarily on time-aligning the beginning of the voice file.
Perceptual Objective Listening Quality Analysis (POLQA)
Perceptual Objective Listening Quality Analysis (POLQA), the successor of PESQ (ITU-T P.862) analysis, is the next generation voice quality testing standard for fixed, mobile and IP-based networks. Based on ITU standard ITU-T P.863, POLQA supports the latest HD-quality speech coding, and higher-bandwidth audio signals suitable for Fixed, Wireless (3G, 4G/LTE) and VoIP networks.
The POLQA algorithm handles the higher bandwidth audio signals. POLQA supports measurements in the narrow band (NB, 300-3400 Hz), and significant new capabilities for wideband (WB, 100 - 7000 Hz), and super-wideband (SWB, 50-14000 Hz), commonly found in VoIP and next generation mobile networks.
The optional POLQA v3 (latest version of the POLQA algorithm) supports Full Band Audio Analysis which provides improved scoring for mobile based VoLTE, 5G and OTT applications using EVS and OPUS codecs. This latest POLQA v3 includes analysis which is more sensitive to distortions across the entire audio spectrum. In addition, POLQA v3 supports less harsh analysis of micropauses within the speech, reacts with less sensitivity to linear frequency distortions, and includes a significantly improved and streamlined perceptual model.
POLQA® is a registered trademark of OPTICOM. GL is one of the Test & Measurement manufacturers that has adopted POLQA/P.863 in its Voice Quality Test solution, by obtaining the essential rights to use POLQA® standard, and hereby acknowledge that the images or text references to POLQA used in this document originally copyrights with Opticom.
POLQA v3 Upgrade Enhancements
- POLQA v3 Super Wideband (SWB) supports 14kHz to full audio bandwidth up to 24kHz
- Full band analysis improves accuracy in assessment of codecs such as EVS, OPUS, AAC and LC3, as these codecs are used in many OTT applications
- With Full band support the discriminative power of POLQA at the upper high-quality range of the MOS scale is increased
- Current OTT voice services using VoLTE/5G include highly dynamic delay jitter which leads to variations of the duration of very short pauses during speech. POLQA v3 handles these variations with increased precision
- POLQA v3 reacts with less sensitivity to linear frequency distortions than POLQA v2.4. This makes measurements less dependent on the frequency characteristics of headsets
- Perceptual model of POLQA v3 is significantly improved and streamlined
Main Features
- VQT software supports both POLQA ver 2.4 (ITU-T P.863), optional upgrade POLQA ver3 (ITU-T P.863) and PESQ (ITU-T P.862/862.1/862.2)
- Updates associated with POLQA v3 include redesign perceptual model for Full Band Audio analysis which is validated for VoLTE, 5G and OTT apps (supporting EVS and OPUS codecs)
- POLQA testing is available directly from VQT or VQuad™ software
- All Results are available within WebViewer™ Central Database
- Manual or Automated mode of operation using VQT Auto Measurement
- VQT CLI or API is enhanced to fully support both Windows® and Linux for remote operations
- VQT POLQA supports analysis of 16-bit uncompressed PCM and WAV files, including NB (8000 sampling), WB (16000 sampling), SWB (48000 sampling)
- VQT POLQA supports analysis of 8-bit compressed a-Law and mu-Law files
- VQT POLQA supports 12-bit Raw PCM Degraded voice files (NB, WB, SWB)
- Fully supports POLQA ITU version 2.4 for POLQA NB and SWB (including WB) modes
- POLQA supports user-specified Sampling Rate (specify any rate between 8K to 48K)
- FR (Full Reference algorithm) measurements with high accuracy for dedicated tests in live networks
- Supports Level Alignment of Degraded to Reference voice files
- POLQA analysis results include POLQA MOS, E-Model R-Factor, Signal Level, Noise Level, Delay, and Jitter
- Real-time mapping of results with GPS option used in conjunction with VQuad™
- Playback and display of audio files from within VQT using Goldwave software
Operations performed by POLQA
Temporal alignment
The basic concepts of the temporal alignment are:
- To split the signals into equidistant pairs of frames and to calculate a delay for each frame pair
- Whenever possible, the matching counterparts of the degraded signal sections are searched for in the reference signal and not vice versa
- Stepwise refinement of the delay per frame to avoid long search ranges (long search ranges require high computing power and are critical in combination with time scaled input signals)
Sample rate estimation
The sample rate ratio detection is required to compensate for perceptually irrelevant differences in the play-out speed of both, the reference and the degraded signal.
The detection of this effect as implemented in the ITU-T P.863 algorithm is based on the delay per frame vector and the detected active sections of the speech signals, as determined by the temporal alignment.
Resample
If the detected sample rate ratio is larger than 0.01, the signal with the highest sample rate will be down sampled and the entire processing starts from the beginning. This happens at most one time to avoid excessive looping in case of signals for which the sample rate ratio cannot be determined in a reliable manner.
Even if the sample rate determination cannot be made with perfect accuracy, e.g., in case of signals with additional variable delay, the detected sample rate ratio is still accurate enough to bring the signals back to the safe operating range of the temporal alignment.
Level alignment
The ITU-T P.863 algorithm is designed to take into account the impact of the play back level for the perceived quality prediction in super wideband mode; the playback level is calculated relative to a nominal level of –26 dBov, which represents 73 dB(A) SPL in dichotic presentation.
In narrowband operational mode the ITU-T P.863 algorithm is designed to determine the listening speech quality at a constant listening level of 79 dB(A) SPL.
Frequency response and time alignment
The ITU-T P.863 algorithm can operate in two modes, narrowband mode, and super wideband mode. In the narrowband mode, both the reference and degraded signals are pre-filtered with an IRS receive filter representing a listening situation in which subjects judge the quality of the speech signals over an IRS receive handset in monotic mode or over an IRS receive headset in monotic mode. In the super wideband mode, both the reference and degraded signals are not filtered, representing a listening situation in which subjects judge the quality of the speech signals over a diffuse field equalized headset in dichotic mode.
Results Provided by POLQA
Perceptual Results
MOS-LQO
The most eminent result of POLQA is the MOS-LQO. It directly expresses the voice quality on the MOS scale. It is important to understand and consider the two different operational modes supported by the ITU-T P.863 algorithm:
- super wideband mode for listening over super wideband headphones
- narrow-band mode for listening over loosely coupled IRS type handsets
In the super wideband mode the impact of play back level is modeled and the default calibration factor (C) of 2.8 has to be used in combination with the standard –26 dBov scaling for play back levels of 73 dB(A) SPL (dichotic). Play back levels down to 53 dB(A) SPL and up to 78 dB(A) SPL may be used and MOS-LQO scores should be reported in the format MOS-LQOsw (dB level). In narrowband mode only the play back level of 79dB(A) SPL (monotic) is supported. Narrowband mode MOS scores are referred to as MOS-LQO.
The maximum ITU-T P.863 MOS-LQO score is 4.5 in narrow-band while in super wideband mode this point lies at 4.75. Under some circumstances, when the reference signal contains noise or when the voice timbre is distorted, a transparent chain will not provide the maximum MOS score of 4.5 in narrowband mode or 4.75 in super wideband mode.
Below table compares PESQ and POLQA MOS scores:
| Mode | P.862.1/2 MOSmin | P.862.1/2 MOSmax | POLQA MOSmin | POLQA MOSmax |
| NB | 1 | 4.5 | 1 | 4.5 |
| WB | 1 | 4.5 | ||
| SWB | 1 | 4.75 |
G.107 R-Factor / Ie Value
POLQA also provides a mapping of the MOS-LQO score to the scale used by G.107 (e-model). The resulting parameter is equivalent to an Ie – Value. Many people also refer to it as an R-factor. The scale ranges from 0 (bad) up to 100 (best). All values below 60 indicate unacceptable quality.
Non-Perceptual Results
Attenuation
Especially all analog equipment modifies the level of the speech signal. A high attenuation generally leads to a worse perception of voice. In contrast to PESQ, POLQA does weight this as degradation of the signal. Knowing the value of the attenuation is also important for optimizing the overall system design. Attention should be paid to signals which show either a negative attenuation, or attenuations larger than approximately 10dB. In the first case, the signal was amplified instead of attenuated. This may eventually lead to level clipping during the transmission. In the second case, the quantization noise may become an important source of degradation, if low level analog signals are converted to the digital domain and are subsequently amplified in the digital domain. Depending on the test setup, both cases may be ok and intended, but this has to be decided on a case by case basis.
In order to calculate the attenuation, POLQA computes P.56 like active speech levels of the reference as well as the degraded signal in dB. The level of the degraded signal minus the level of the reference signal is then used as the attenuation.
Level and Background Noise Measurements
In transmission systems it is frequently important to know the exact levels of the signals. Especially for VoIP systems and voice activity detection (VAD) it becomes also important to know the signal level during the silent intervals as well as during active speech. It is important, that the received background noise does not exceed a certain limit. Levels can be measured in dB if you want to relate the level directly to a sound pressure or electrical level, or as loudness levels.
Signal to Noise Ratio (SNR)
POLQA calculates the SNR for the reference and the degraded signal independently. The noise as well as the signal level is calculated by the VAD which POLQA uses for the temporal alignment.
Active Speech Ratio (ASR)
ASR is calculated by POLQA based on the information calculated by the Voice Activity Detection (VAD) which is part of the temporal alignment. The ASR defines the ratio between active speech and the overall signal length.
POLQA support within Voice Quality Testing (VQT) and VQuad™
GL's enhanced VQuad™ and stand-alone Voice Quality Testing (VQT) software, both support the next-generation voice quality testing standard for fixed, mobile and IP-based networks using PESQ (ITU-T P.862), POLQA ver 2.4 and optional upgrade ver3 (ITU-T P.863). As part of the POLQA analysis, results include POLQA MOS, E-Model, Signal Level, Noise Level, and Jitter. Automated voice quality testing using POLQA can be performed through scripting in VQuad™.
The VQT software can work either independently, in conjunction with VQuad™ - Dual UTA HD, or in conjunction with VQuad™ Probe HD. Using GL's VQuad™ application along with the Dual UTA HD, or all-in-one VQuad™ Probe HD, voice, video, and data tests are supported for practically any end-point (customer experience) interfaces. The VQuad™ Probe HD (combines with VQuad™-Dual UTA HD - PC into one single box) provides multiple interfaces for connecting to any communication device on a network using an efficient, portable, single box solution. The VQuad™ Probe HD can work with variety of networks, including Wireless (Bluetooth®, Wi-fi, 3G, 4G, LTE, PTT Mobile Radio), VoIP, Analog, and TDM, practically allowing any end-point interfaces to be tested for voice, data, and video quality. Various associated applications (Voice Quality, Video Quality, Data tests, Echo and Delay tests, Fax tests, VBA) works with VQuad™ Probe HD to provide "end-to-end assessment" with additional test and measuring capabilities. All the applications work in conjunction with the VQuad™ for automatically and remotely analysing the captured data and sending the test results to the central database. You can query results or control the tests remotely using web-based WebViewer™.
Third party Goldwave software (SA048) is required for playback, viewing, and analysis of audio from within VQT software.
The GL VQT software automatically analyzes the degraded voice files while sending the results to a central database. The results associated with the POLQA analysis include POLQA MOS, E-Model, Signal Level, Noise Level, and Jitter.
As an additional feature, POLQA is added directly to VQuad™ software with support for automated testing within the VQuad™ script. In this scenario, the degraded voice files remain at the VQuad™ node for analysis and display within the VQuad™ software.
For more details, please visit VQuad webpage.
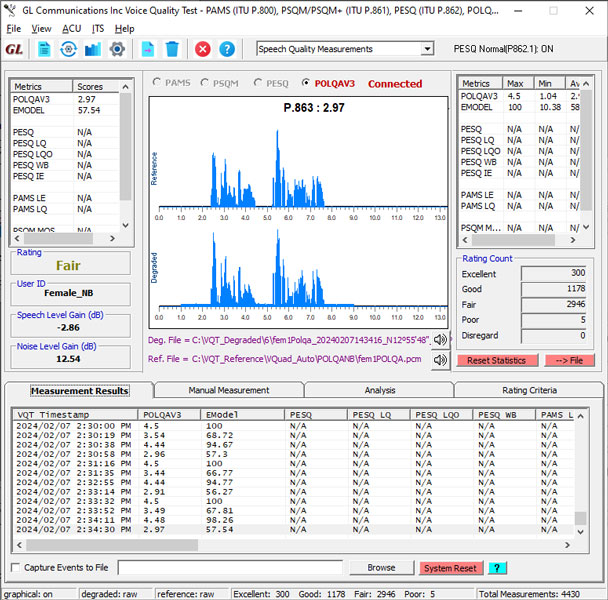
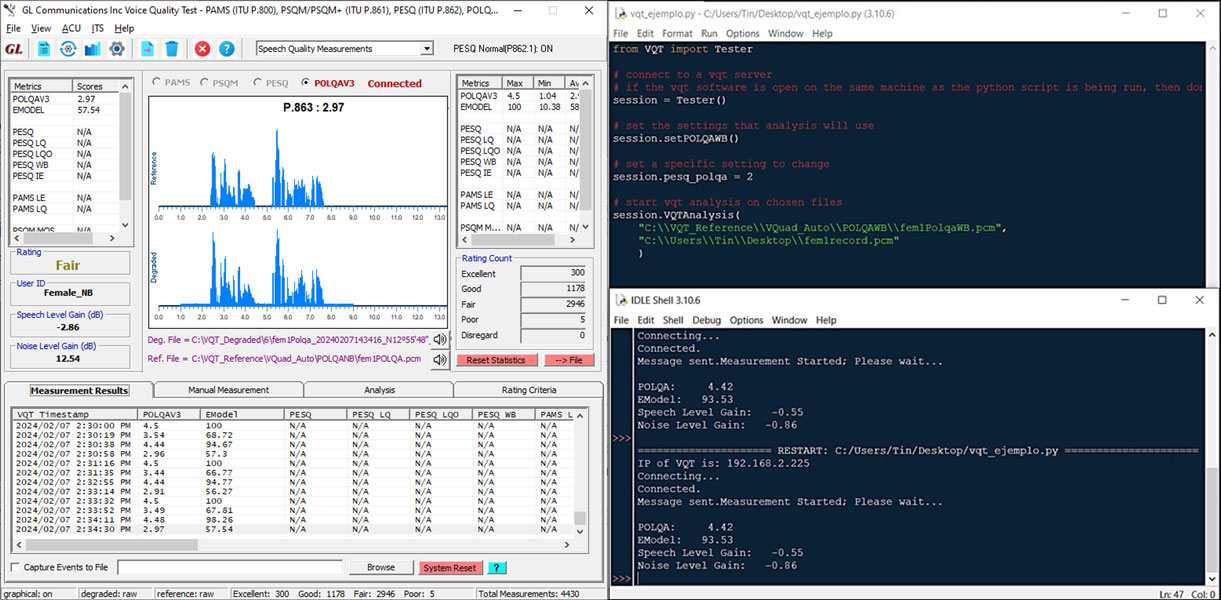
VQT POLQA Measurements and Analysis
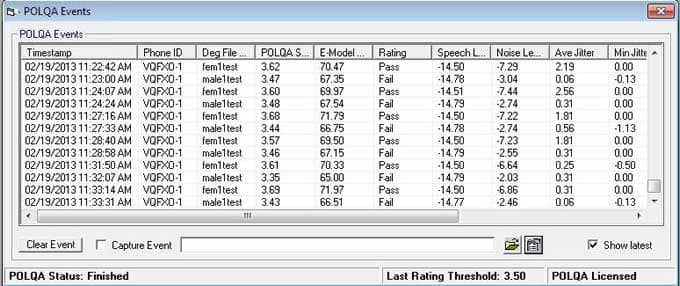
VQuad™ with POLQA Events Log
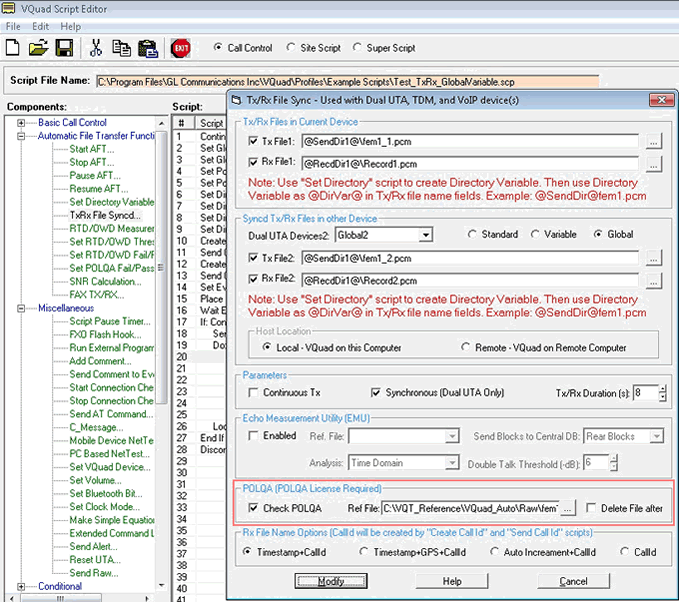
Automated VQT with POLQA through Scripts
Perceptual Evaluation of Speech Quality (PESQ)
Modern communications networks include elements (bad coding, error-prone channels and voice activity detection) that cannot reliably be assessed by such conventional engineering metrics as signal-to-noise ratio. One way to measure customers' perception of the quality of these systems is to conduct a subjective test involving panels of human subjects. However, these tests are expensive and unsuitable for such applications as real-time monitoring.
PESQ provides an objective measure that predicts the results of subjective listening tests on telephony systems. To measure speech quality, PESQ uses a sensory model to compare the original, unprocessed signal with the degraded version at the output of the communications system. The result of comparing the reference and degraded signals is a quality score. This score is analogous to the subjective Mean Opinion Score (MOS) measured using panel tests according to ITU-T P.861.
PESQ incorporates many new developments that distinguish it from earlier models for assessing codecs. These innovations allow PESQ to be used with confidence to assess end-to-end speech quality as well as the effect of such individual elements as codecs.
In addition to the standard PESQ score, the GL VQT also provides the PESQ LQ and LQO (P.862.1) score. These revised scores exhibits better correlation to subjective listening quality test scores.
Third party Goldwave software (SA048) is required for playback, viewing, and analysis of audio from within VQT software.
Main Features
- All Results are available within WebViewer™ Central Database
- Manual or Automated mode of operation using VQT Auto Measurement
- Remote operation using CLI or API
- VQT software supports both POLQA (ITU-T P.863) and PESQ (ITU-T P.862/862.1/862.2)
- VQT PESQ supports analysis of 16-bit uncompressed PCM and WAV files, including NB (8000 sampling) and WB (16000 sampling)
- VQT PESQ supports analysis of 8-bit compressed a-Law and mu-Law files
- Playback and display of audio files from within VQT using Goldwave software
- Supports latest PESQ ITU release including ITU-T P.862, 862.1 and 862.2 (supports PESQ, PESQ LQ, PESQ LQO, PESQ WB)
- PESQ analysis results include PESQ, PESQ LQ, PESQ LQO, PESQ WB, PESQ Ie, and PESQ per Utterance
- PESQ Results also include Signal Level, Noise Level, Delay, Delay per Utterance, and Jitter
- Real-time mapping of results with GPS option used in conjunction with VQuad™
- The results can be accessed remotely from a database, queried and displayed in web browser using WebViewer™ either in tabular or graphic format
Operations Performed by PESQ
The processing carried out by the PESQ algorithm includes the following stages.
Level Alignment
In order to compare the signals, the reference speech signal and the degraded signal should be at the same, constant power level. This is necessary because the reference signal does not have to be at a defined level and because the gain of the system under test is unknown before testing. PESQ assumes that the subjective listening level is a constant 79dB SPL at the ear reference point [ITU-T P.830, section 8.1.2]. A gain is applied to both the reference and degraded signals to bring them to this level.
Input Filtering
Analog connections often introduce some degree of filtering. For example, PESQ models the receive path of the telephone handset using an input filter. This takes account of the effect of the electrical and acoustic components of the handset. The filter used is similar to the standard "modified IRS receive characteristic" [ITU-T P.830]. It is generally accepted that this has less effect on quality than coding distortions do. PESQ compensates for any filtering that has taken place in the network.
Time Alignment
The system under test may include a delay, which may be variable. In order to compare the reference and degraded signals, they need to be lined up with each other. PESQ applies voice activity detection to the signals to identify those parts of the signal that are speech, ignoring noise. The PESQ time offset measurements do not take account of the delay of the test equipment generating or recording the signal. This means that a time offset reported by PESQ on a file collected will be dependent upon the way in which the test process is executed.
- First, PESQ aligns the overall speech signals (utterances). An utterance is a continuous speech burst identified by the voice activity detector that does not contain pauses longer than a pre-determined threshold (200ms). This process detects delay over major sections of the degraded signal compared to the reference signal
- Second, PESQ aligns overlapping sections of the speech (frames). This process detects delay that is variable over the length of an utterance, as this can be significant in packet-based networks
- The third stage does not occur immediately after the second stage, but is performed after the auditory transform has been calculated. The third stage realigns "bad intervals" (sections of the speech with very large disturbance), and improves the model's accuracy with a small number of files where delay changes are not correctly identified by the initial time alignment process
Auditory Transform
In order to compare the reference and degraded signals, taking account of how a listener would have heard them, each is passed through an auditory transform that mimics certain key properties of human hearing. This gives a representation in time and frequency of the perceived loudness of the signal, known as the sensation surface.
Equalization
Part of the auditory transformation equalizes certain processes that have little subjective effect. First, the transfer function of the system is estimated, and is used to equalize the reference to the degraded in the auditory transform domain. This takes account of filtering in analogue components of the network such as telephone handsets. Second, the frame-by-frame amplitude gain of the system is estimated and used to equalize the auditory transform of degraded file to the reference. In both cases the equalization is partial - large amounts of filtering or gain variation are not cancelled, and therefore result in errors being measured.
Disturbance Processing
The difference between the sensation surfaces for the reference and degraded files is known as the error surface; this shows any audible differences introduced by the system under test. The error surface is analyzed by a process that takes account of the effect that small distortions in a signal are inaudible in the presence of loud signals (masking).
From the positive and negative errors, two disturbance parameters are calculated. They are calculated as non-linear averages over specific areas of the error surface. These disturbance parameters are:
- The absolute (symmetric) disturbance - a measure of absolute audible error
- The additive (asymmetric) disturbance - a measure of audible errors that are significantly louder than the reference
This analysis gives two error parameters that summarize the amount of each type of audible error. Finally, the error parameters are converted to a quality score, which is a linear combination of the average symmetric disturbance value and the average asymmetric disturbance value.
Results Provided by PESQ
PESQ (P.862)
PESQ returns a quality score, known as PESQ score, which conforms to ITU-T P.862. PESQ score lies on a scale from -0.5 to 4.5, though in most cases it is between 1 and 4.5. PESQ score correlates with subjective quality scores. However the PESQ score tends to be optimistic for poor quality speech and pessimistic for good quality speech. Alternative mappings for PESQ score have been developed which do exhibit a better correlation to subjective test scores. These are referred to as the PESQ-LQ and PESQ-LQO scores.
PESQ-LQ
PESQ-LQ scores are closer to the listening quality subjective opinion scale, which is standard in the industry and is defined in ITU-T P.861. Listening quality scores lie between 1 and 5. PESQ-LQ score lie between 1.0 and 4.5. This is because 4.5 is usually the maximum obtained in a subjective test.
Listening Quality Scale:
| Score | Quality of the speech |
|---|---|
| 5 | Excellent |
| 4 | Good |
| 3 | Fair |
| 2 | Poor |
| 1 | Bad |
The score gives a measure of customers' perception of quality. The highest score, 4.5, means that no distortion is measured. As the amount of distortion increases the quality falls.
PESQ-LQO (P.862.1)
The aim of a separate recommendation ITU-T P.862.1 is to provide a single mapping from raw P.862 score to the Listening Quality Objective Mean Opinion Score (LQO-MOS). This latest ITU standard improves on the original PESQ (P.862) by correlating better to subjective test results.
Typical PESQ Score Comparisons
Based on simulations and real measurements, the table below represents the results of a number of typical networks and codecs with no errors or packet loss. In addition, it gives the scores that can be expected in some mobile network conditions where errors are significant.
| Network Condition | PESQ | PESQ-LQ | PESQ-LQO |
|---|---|---|---|
| Clean ISDN network | 4.3 | 4.4 | 4.4 |
| Analog network (G.711) | 4.1 | 4.2 | 4.2 |
| G.728 codec (16kbit/s) | 3.8 | 3.9 | 3.9 |
| G.729 codec (8kbit/s) | 3.6 | 3.7 | 3.7 |
| G.723.1 codec (6.3kbit/s) | 3.5 | 3.4 | 3.5 |
| GSM EFR codec (12.2kbit/s) | 3.9 | 4.0 | 4.0 |
| GSM FR codec (13kbit/s) | 3.5 | 3.5 | 3.5 |
| GSM-EFR mobile network in typical operating range | 3.6 to 3.1 | 3.6 to 2.9 | 3.7 to 3.0 |
| GSM-EFR mobile network in very poor conditions | 2.2 | 1.6 | 1.8 |
For more details, please visit PESQ Measurement webpage
Mode of Operations
Auto Measurement
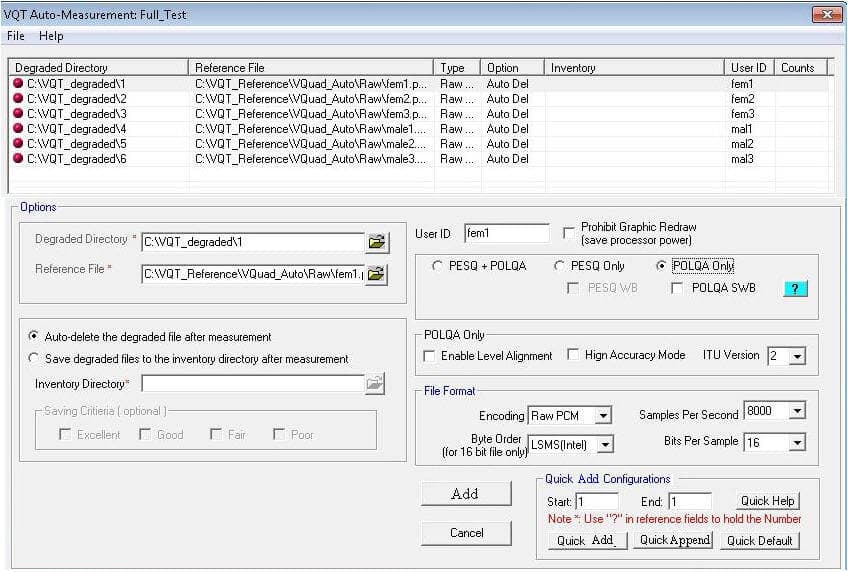
The GL VQT may also be executed in Auto Mode. This allows the GL VQT to reside anywhere in a network and monitor multiple user-specified network drives/directories for voice files. GL VQT automatically performs the voice quality algorithms on these recorded voice files and displays the results. Multiple GL VQT Auto-Measurement sessions may be configured, each session with a unique set of requirements and a unique reference voice file. In addition, the user may specify voice files to be saved based on the rating criteria (i.e. if VQT is fair or poor, save the degraded voice file).
Manual Measurement
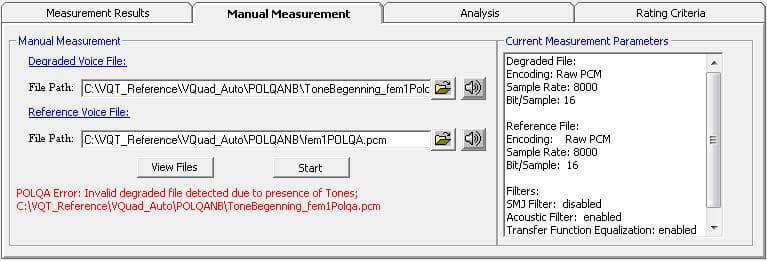
For manual mode measurement, users can configure a single degraded and reference voice files. VQT automatically performs the voice quality algorithms for the voice files and the current measurement parameters are displayed. Manual mode is limited to single voice file analysis at a time, which are configured from the specified network drives/directories.
Detailed Analysis in GL’s VQT software
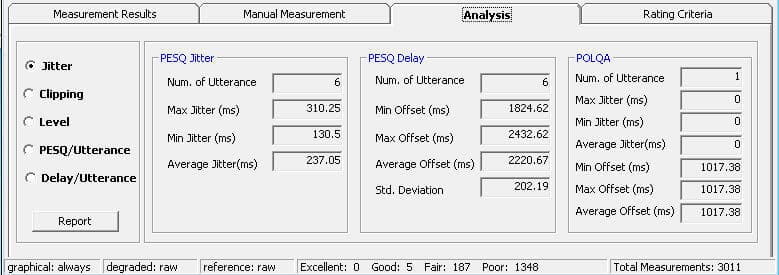
The GL VQT software automatically analyzes the degraded voice files while sending the results to the central database. The VQT analysis results include MOS, E-Model, SNR, Signal Level, Noise Level, Clipping, Delay, and Jitter.
VQT detailed analysis includes following measurements:
- Jitter
- Clipping
- Level
- PESQ/Utterance
- Delay/Utterance
Jitter
Jitter data is obtained from the time alignment process. The utterance-by-utterance offset must be determined accurately to get a speech quality measure. Jitter is the variation in time offset between reference and degraded utterances. The GL VQT reports utterance offset by providing a minimum/maximum and standard deviation value. These three are measures of jitter in the speech as delivered to the listener. GL also reports the average offset.
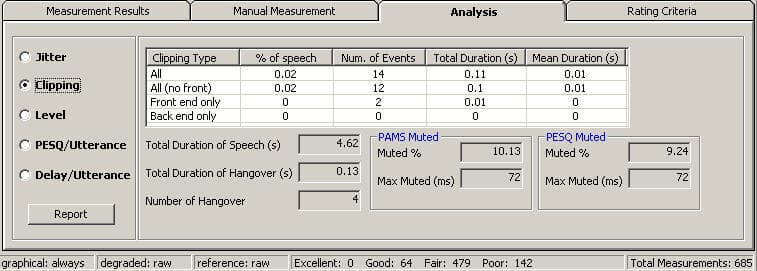
Clipping
Performance Examiner provides a number of diagnostic outputs that relate to the use of muting algorithms and discontinuous transmission. These outputs are generated by comparing the degraded signal to the reference signal.
Muting of a signal typically occurs when an error concealment algorithm at a receiver has insufficient information to replace missing or corrupted data. The muting estimate is provided in terms of the proportion of signal frames that have been muted by the system under test.
Discontinuous transmission (DTX) schemes aim to increase transmission efficiency by ceasing transmission during periods of talker inactivity. Temporal clipping occurs when the voice activity detection (VAD) algorithm in a DTX system misclassifies part of a speech utterance as noise, and replaces it with comfort noise at the receiver.
Front-end clipping refers to the case where the start of an utterance has been clipped. Back-end clipping refers the case where the end of an utterance has been clipped.
Hangover is a term applied to the period after the end of an utterance when a discontinuous transmission scheme continues to transmit as normal, rather than generating comfort noise.
Level
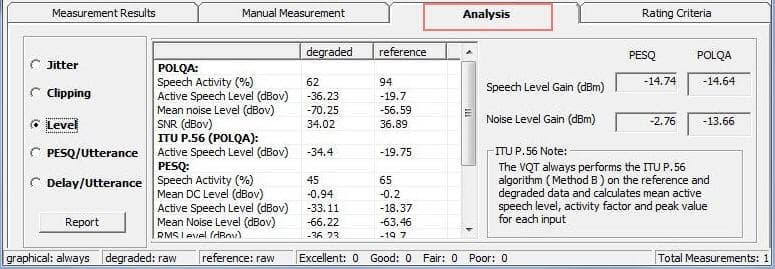
For each measurement levels are calculated for the reference and degraded files. These levels are described below:
| Measurement | Definition |
|---|---|
| Active Speech Level (ASL) (dBov) | Power Level (RMS) during periods of speech |
| Mean Noise Level (MNL) (dBov) | Power Level (RMS) during periods of silence |
| RMS Mean Level (dBov) | Power Level (RMS) of entire sample |
| DC Offset (PCM Units) | DC Offset of input sample |
The following results are interpreted from the data above:
| Measurement | Definition |
|---|---|
| Speech Level Gain (dB) | Speech Level Gain of the system under test. Calculated: (ASL of degraded signal) minus (ASL of reference signal). |
| Noise Level Gain (dB) | Gain calculated for noise in silent periods. Calculated as (MNL of degraded signal) minus (MNL of reference signal). May differ from the system gain if noise is added or suppressed. |
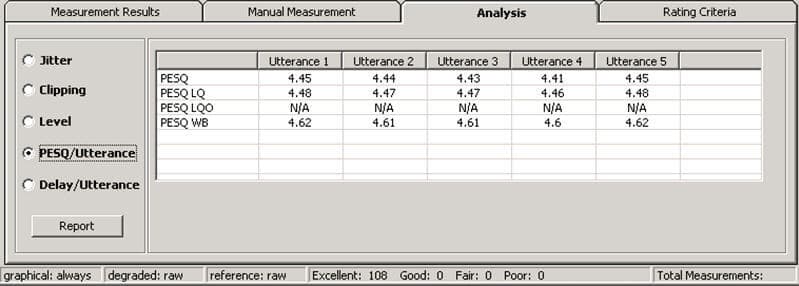
PESQ/Utterance
A PESQ/PESQ LQ/PESQ LQO score is available on a per utterance basis. Each sample is broken into distinctive utterances; which GL provides an ITU score for each of the utterances.
For example, front end clipping, which would only affect the 1st utterance, could cause the overall scores to be lower than expected. PESQ/Utterance will indicate this cause.
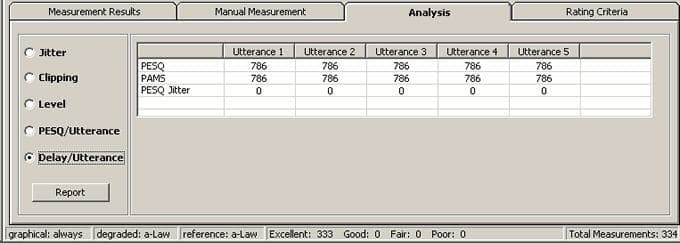
Delay/Utterance
The delay per utterance results are acquired by comparing the beginning of each utterance in the reference file to the beginning of each utterance in the degraded file. This comparison takes place for each utterance in the reference and degraded files.
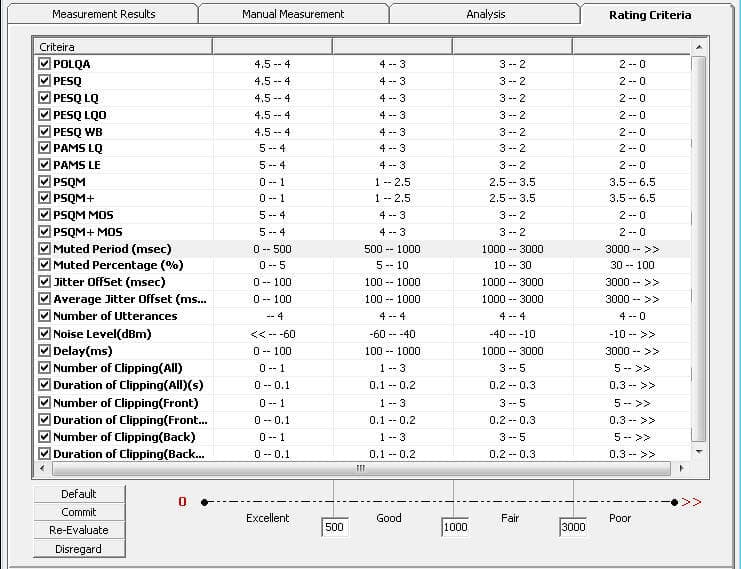
Rating Criteria
The user may configure a Rating Criteria for all VQT algorithms as well as the additional analytical results. The rating criteria may be configured for Excellent, Good, Fair, and Poor and the results of the rating criteria may be saved to file for post processing viewing. Thus, the user may view only Fair and Poor results if desired. Full statistics are also available that include all measurement results as well as Rating Criteria results.
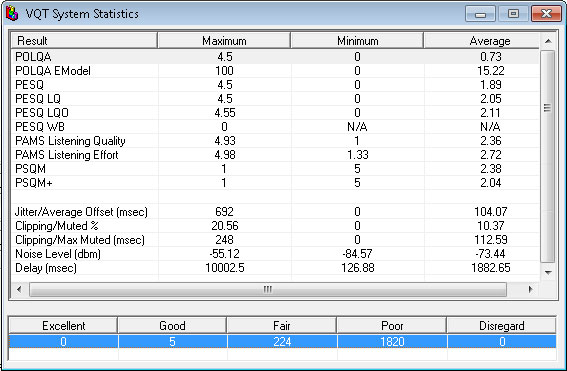
Statistics
VQT system also provides algorithm, rating, and graphical statistics. The tabular statistics includes Min, Max and Average measurements for the complete VQT system results including POLQA and PESQ analysis results (Jitter, Clipping, Speech/Noise level, and more).
The statistics for the VQT system also include the following graphical statistics:
- Global Rating History (24 hour) - displays the number of Excellent/Good/Fair/Poor results calculated in past 24 hours
- Global Score History (24 hour) - shows the PESQ/POLQA scores that are calculated in past 24 hours
- Score History Per Auto Instance - shows the PESQ/POLQA scores that are calculated in past one hour for the selected auto measurement instance
- Rating Statistics per Instance - shows graph statistics for each instance
Results
GL's WebViewer™ provides the method to display and access, in real time, the entire VQuad™/VQT network including all individual VQuad™ Probe HD as well as the central location. Current status of the entire test is displayed along with customized user statistics and results of the active tests.
The results/events associated with the VQuad™ and the VQT analysis is sent to the central database and can be queried using the GL WebViewer™ (web browser). Outputs of the query can be displayed in tabular or graphical format while also output to Excel® or Text. Results can also be displayed in Google Maps (GPS connectivity is required).
The POLQA analysis results sent to central database system, which can be queried over web interface includes Degraded Filename, Rating, POLQA Score, EModel (R-factor), Speech Level Gain (dBv), Noise Level Gain (dBv), Jitter Ave (ms), Jitter Min (ms), Jitter Max (ms), Active Speech Ratio – Ref (%), Active Speech Ratio – Deg (%),Number of Utterance, Delay Ave (ms), Delay Min (ms), and Delay Max (ms).
For details, visit Live and Interactive Product Demo webpage.
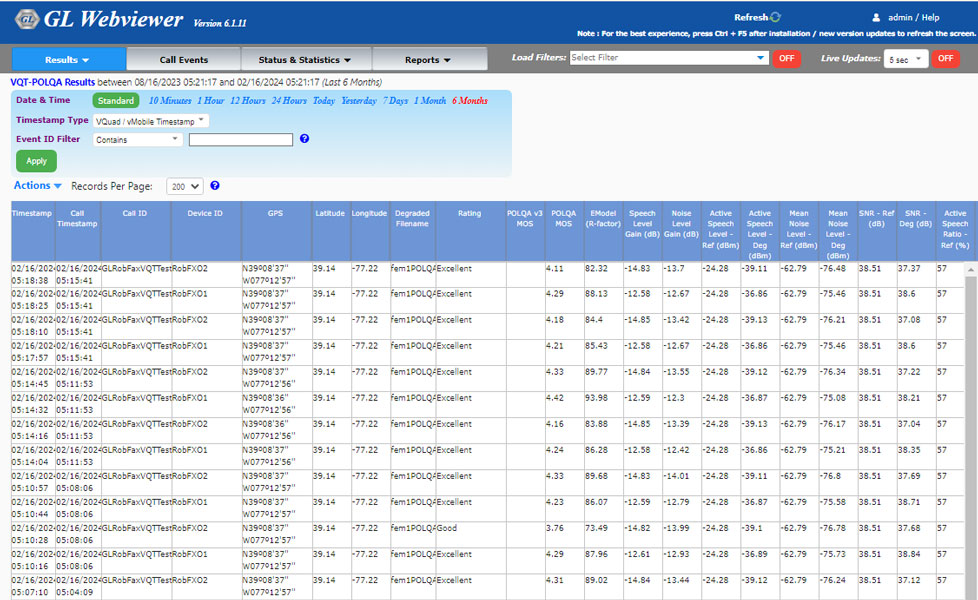
WebViewer™ displaying VQT POLQA Measurements
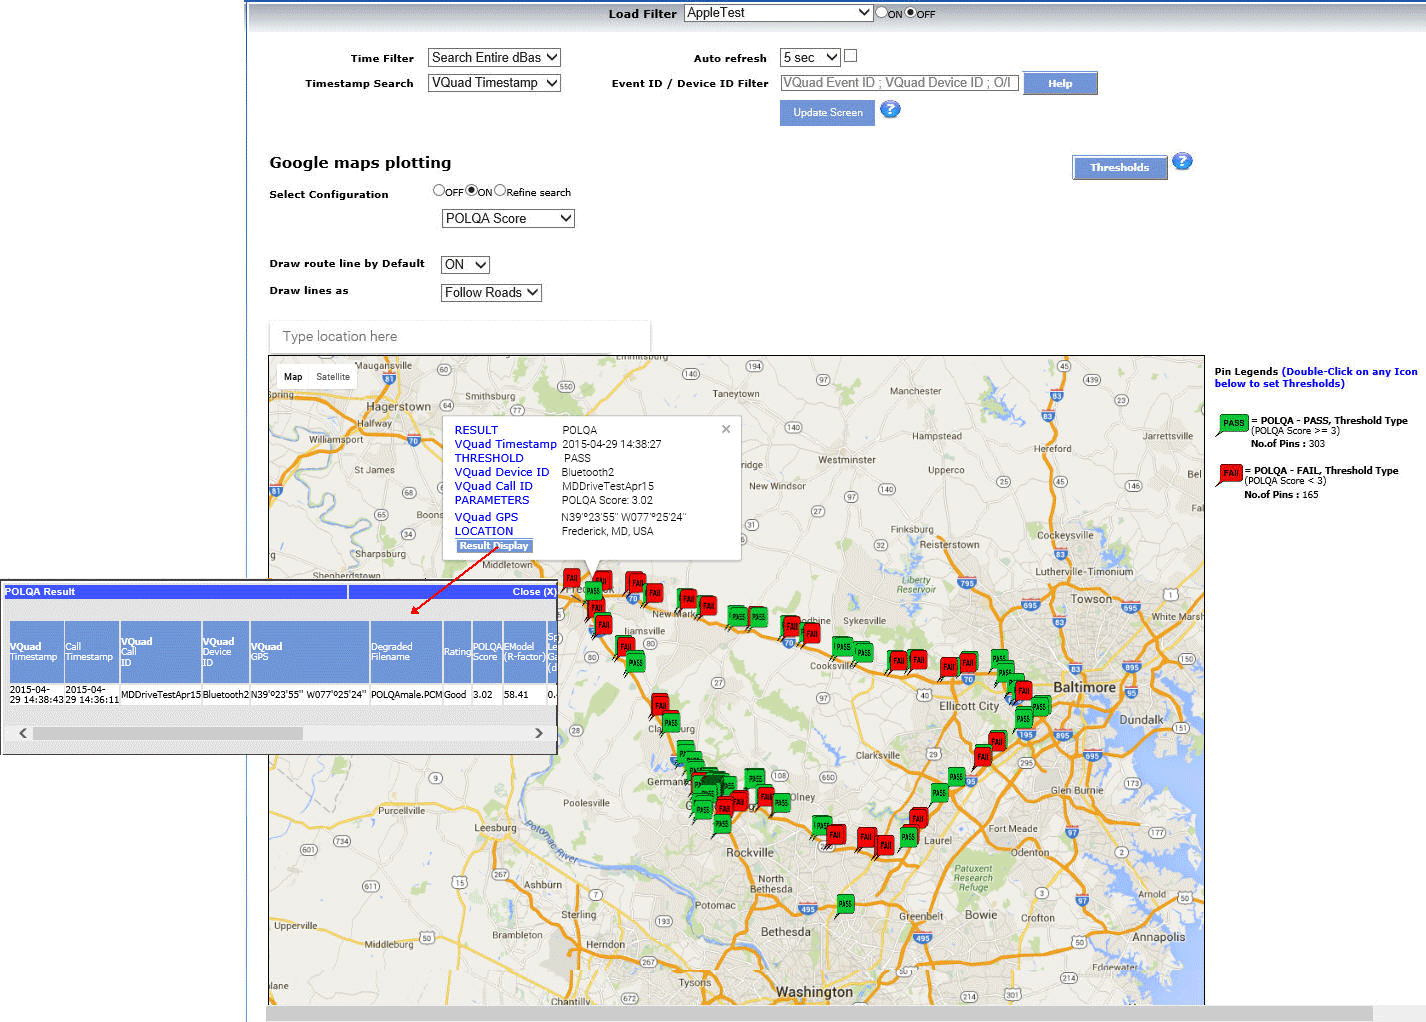
POLQA results plotted on Google Map
Python Scripting for Automation and Remote Access of Voice Quality Testing
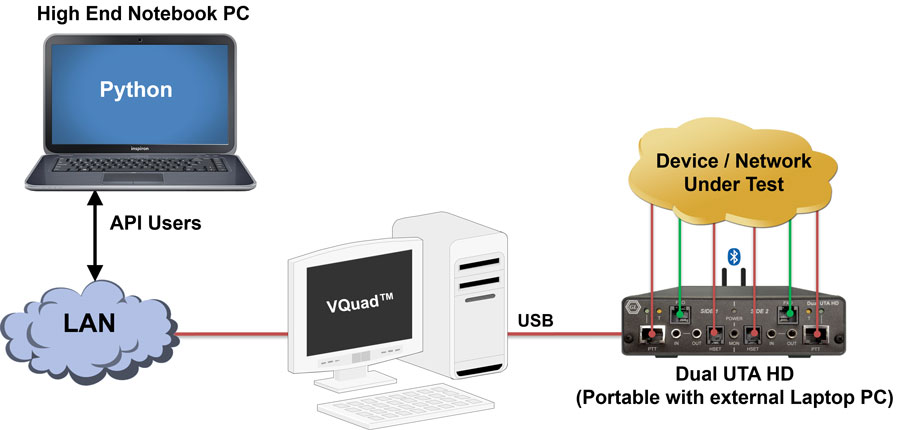
The VQuad™ and Voice Quality Testing (VQT) Python libraries provide a range of Python functions which can be used to remotely or locally control these two applications. The VQuad™ library provides the functionality of the existing VQuad™ Command Line Interface (CLI) as well as the ability to run prewritten scripts sequentially. The VQT library can be used to run automatic and manual VQT tests with custom settings.
Python for VQuad™ works by connecting to the existing VQuad™ CLI and using a portion of the CLI commands to make simple functions. This connection to the CLI makes the library fast and responsive. Python scripts can perform a variety of Call Control and Audio operations on any device associated with the VQuad™ system. Additionally, access to the original CLI functions is possible through use of the VQuad™ library and the Python ctypes library.
Python for VQT works by connecting to the existing VQT CLI and using a portion of the CLI commands to run manual and automated VQT tests. Class variables are linked to the settings for each test and can be changed easily.
Main Features
- Python scripts support accessing VQuad™ and VQT functionalities remotely
- Controls VQuad™ and VQT nodes located at various destinations
- Automation with enhanced Python scripting and remote operation includes traffic generation, call control, and automated scheduling of operations
Command Line Interface (CLI) for remote access
VQuad™ provides full support for CLI on both Windows® and Linux environment. VQuad™ CLI also supports both IPv6 and IPv4.
The VQuad™ Command Line Interface (CLI) is designed to remotely access various application functionalities and thus controlling VQuad™ nodes located at various destinations.
The VQuad™ Remote Access (Client) allows VQuad™ operations to be remotely controlled by one (or several) VQuad™ clients over a LAN, WAN, or Internet.
All Call Control functions, and traffic simulation functions are supported. These includes - Load Call Control Script Configuration, Load VQuad™ Master Configuration, Start Stop Call Control Script, Place Call, Answer Call, Disconnect Call, Set and Get Log Files, and many other operations. It also supports traffic functions such as Send and Record Voice Files, Transmit and Detect Digits, Send and Detect Tones, Send and Receive Fax, OWD/RTD Correlation, and Stop Traffic.
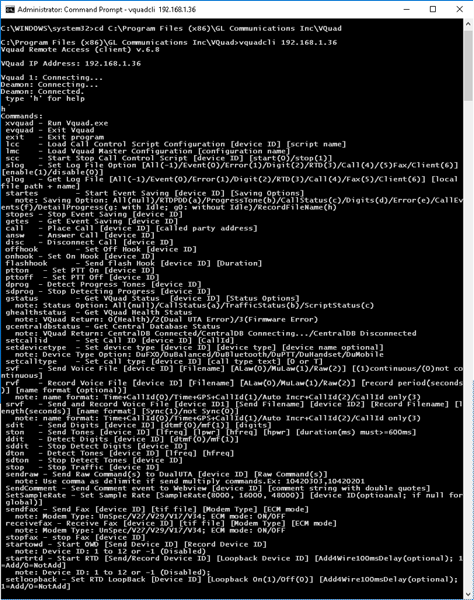
VQuad™ CLI (Windows)
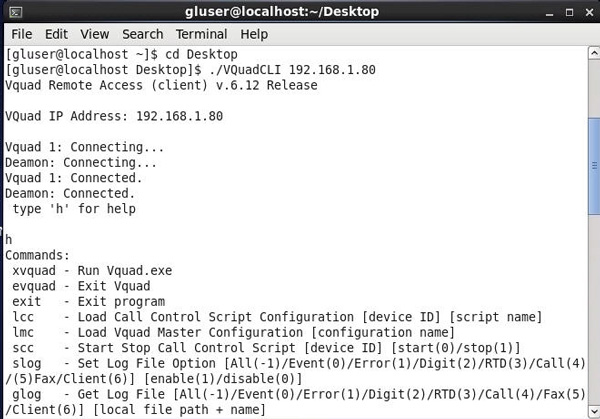
VQuad™ CLI (LINUX)
Windows® and Linux APIs for VQuad™ and VQT
GL has developed Windows® and Linux APIs for VQuad™ and VQT. Customers can now build custom, faster and cheaper applications using the features already available with GL applications. All important functionalities required to control VQuad™ and VQT remotely are available through APIs to ease the most complex application development activities.
The VQT API environment provides two-way traffic to the VQT server, ability to control the VQT server remotely and provides for instant feedback of VQT client actions.
The VQT functions that are generally available through APIs are listed below –
- Connect/disconnect the client applications with a VQT Server
- Automatically perform VQT with PESQ/POLQA algorithms
- Start/Stop VQT Auto-mode operations
- Capture individual VQT events to file in real-time
- Retrieve the VQT Statistics
- Load VQT auto measurement configuration files
The VQuad™ functions that are generally available through APIs are listed below –
- Connect/disconnect the client applications with a VQuad™ Server and GL Listener
- Perform all general device configurations
- Send and receive files on the configured devices
- Load auto traffic configuration files and scripts
- Perform call control functions (place call, receive call, disconnect)
- Perform all traffic actions (send/detect tones/digits/files, send/record voice)
- Perform voice quality, delay, noise, and echo measurements
- Retrieve the all results and statistics
- Monitor status of all remote VQuad™ nodes
Resources
Note: PCs which include GL hardware/software require Intel or AMD processors for compliance.
| Item | Description |
|---|---|
| VQT002 | Voice Quality Testing (PESQ only) |
| VQT006 | VQT w/ POLQA Server license (no limitations) |
| VQT007 | VQT POLQA v3, server license for 20 nodes |
| VQT008 | Voice Analysis Tool (VAT™) |
| VQT014 | AutoVQT™ |
| VQT014U | Upgrade from VQT POLQA to AutoVQT™ |
| Related Software | |
| VQT010 | VQuad™ Software (Stand Alone) |
| VQT251 | Dual UTA HD Next generation Dual UTA with FXO Wideband support |
| VQT252 | Dual UTA HD – Bluetooth Option |
| VQT461 | Dual UTA HD Smartphone ACC Cable |
| VQT601 | Mobile Device Controller (MDC) Software |
| VQT600 | VQuad™ NetTest Data Server Solution (Requires annual license renewal to remain functional) |
| VBA032 | Near Real-time Voice-band Analyzer |
| EMU037 | Echo Measurement Utility (EMU) Software |
| VQT040 | WebViewer™ |
| Item | Related Hardware |
| VQT251 | Dual UTA HD Next generation Dual UTA with FXO Wideband support Accessories USB Cable 2.0 (1) 3.5 mm jack audio cable (2) RJ 11 cable (2) |
| VQT280 | VQuad™ Probe HD (with Dual UTA HD) Accessories Power Adapter 12V, 3Amps (1) 3.5 mm jack audio cable (2) RJ 11 cable (2) |
| VQT281 | VQuad™ Probe HD w/o Dual UTA HD |
| VQT291 | vMobile™ - Portable VQT Test Solution |
| Download Complete Product Lists |
| Quick Install Guide |
|---|
| VQT Quick Install Guide |
| VQuad Quick Install Guide |
| WebViewer and Data Import Quick Install Guide |
| Product Video |
|---|
GL Android VQT App Demo |