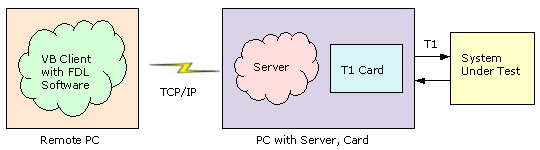
VB Client for Client Server Software
Overview
GL's VB Client is a Windows based GUI Client application that communicates with the GL's Server Software to execute and display basic functions on T1 and E1 lines. The VB Client application can be invoked as a stand-alone Client or in the case when it is co-resident with GL's T1/E1 analyzer cards, from the special application drop down menu --> WCS VB client. GL can provide free assistance in developing additional capability in the VB Client or GL Server.
VB Client includes the following functionalities:
- Capture Tones/Digits:
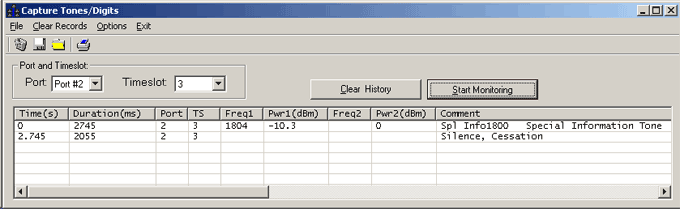
VB client's Capture Tones/Digits application is used to capture tones and identify special tones (DTMF, MF and others) on a single timeslot.
You can select the Port and Timeslot on which the tone has to be captured. The Start Monitoring button is enabled the real-time tone capture begins.
All of the tones captured are listed in the display area of the window. Clear History window deletes the records listed in this area. Task monitoring will continue until the application is exited or the Stop Monitoring button is enabled.
Any previously saved text file containing captured tone information can be selected for monitoring. For real time capture tone monitoring, tone is transmitted using 'Transmit Tone' application of T1/E1 and tones being captured are monitored in WCS Vb Client application.
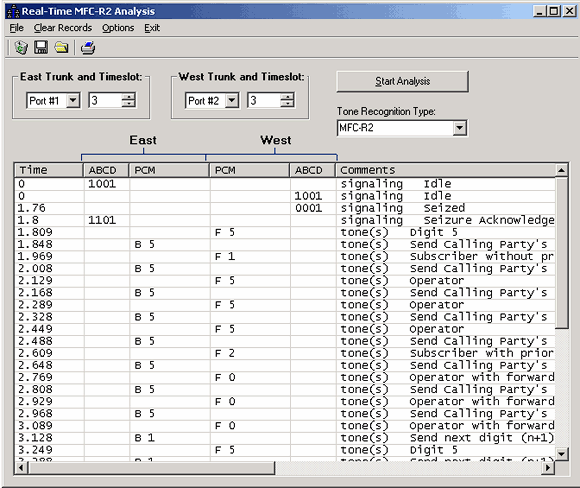
- Real-time MFC-R2 Analysis:
VB client's MFC-R2 Analysis application is used to analyze R2 signaling on E1 trunks and R1 signaling on T1 trunks in real-time.
Select port from Port Selection drop down box and timeslot from Timeslot selection scroll button for real-time capture. These (ports) are represented as east and west trunk for PCM data capture. The selection of R2 for E1 and R1 for T1 is through a drop down box labeled Tone Recognition Type.
The signaling capture display area has ABCD signaling and PCM data labeled columns for east and west trunks. Further, the Time of capture and the Comments for various captured events of R2 & R1 are labeled with separate column heads.
Any previously saved text file containing R2/R1 signaling can be used for off-line analysis.
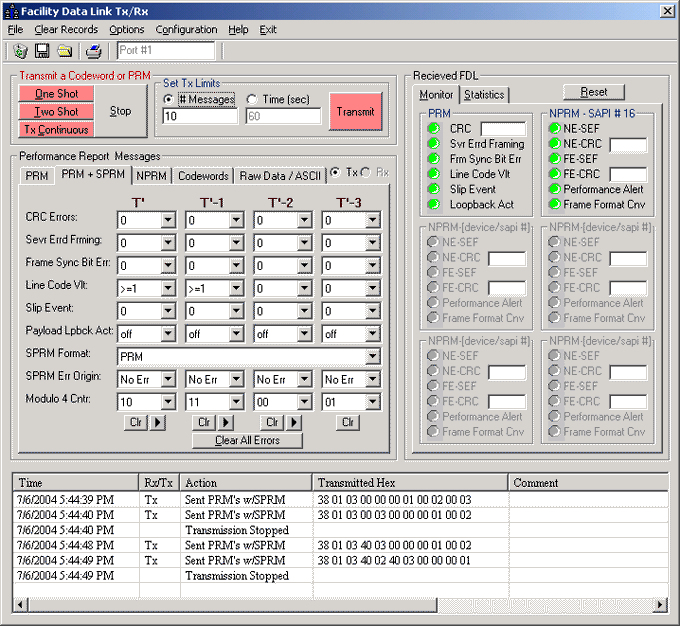
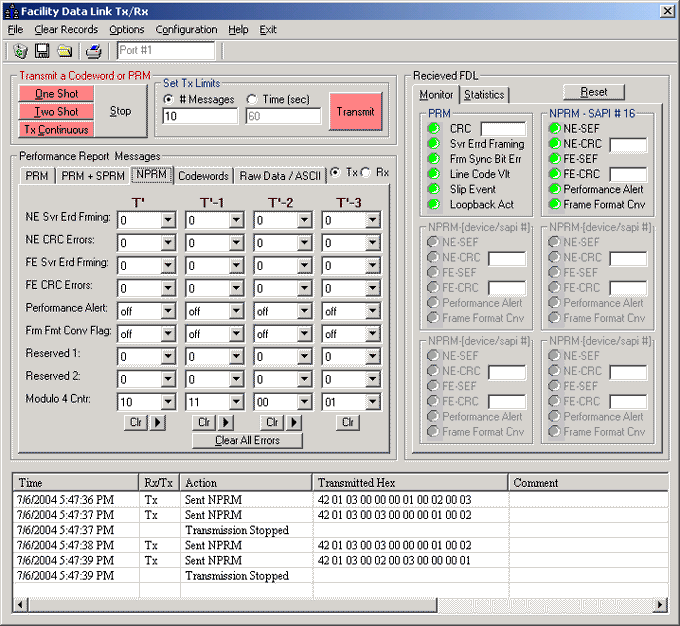
Facility Data Link (FDL) Rx/Tx Utility:
This can be invoked by selecting FDL Tx/Rx from the Special Applications menu. FDL utility can simulate and decode FDL messages. These messages (in the real network) are used to check whether degradation exists in the network or in the CI (Customer Installations) or in both.
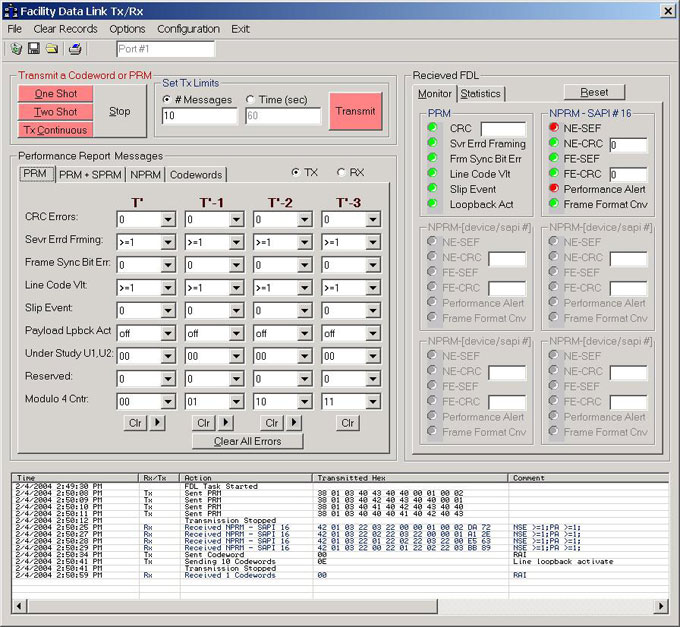
This window consists of four parts:
- Transmit a Codeword or PRM.
- Performance Report Messages.
- History window.
- Received FDL.
Transmit a Codeword or PRM:
This can be used for the transmission of all FDL messages. The mode of transmission depends upon the user requirement. Following are the modes of transmitting the FDL messages:
- One shot: Messages will be sent once.
- Two shot: Messages will be sent twice at a time.
- Tx Continuously: Messages will be sent continuously.
NOTE: Mode of transmission is restricted for code words and for text messages.
Performance Report Message
This section deals with the transmission of the following FDL messages
- PRM --> Performance Report Messages are generally sent or inserted at the time of frame generation. PRMs transmitted will present some kind of acknowledgement, either from NI or CI.
PRM + SPRM --> Supplementary Performance Report messages will be sent along with the PRMs, may be applied within the network. Received SPRM may be used to locate the trouble conditions along signal path.
- NPRM --> Network Performance Report messages may be written into the data link to be sent in order to further sectionalize
the trouble along the path. When added to the data link at the time of frame generation will help us to indicate the trouble conditions
whether near-end or for-end of the NI.
- Code words --> Operation, Administration and Maintenance of the network necessitate the use of Code words. Each code words
sent will have its own significance.
- RAI: This message indicates the loss of the incoming signal either in CI or in network.
- RAI-CI: This is the type of AIS signal, intended to determine whether the problem is in CI or in NI.
- Loop back Retention and Acknowledge: Loop back retention message when present in the received signal, is
positive confirmation OR acknowledgement of presence of line loop back.
- Use Comprehensive Code word List: Clicking on this radio button allows the user to choose one of the code words that will appear in the drop down list. Each code word will have hex value associated with it. The user can just edit the hex value the respective codeword will appear.
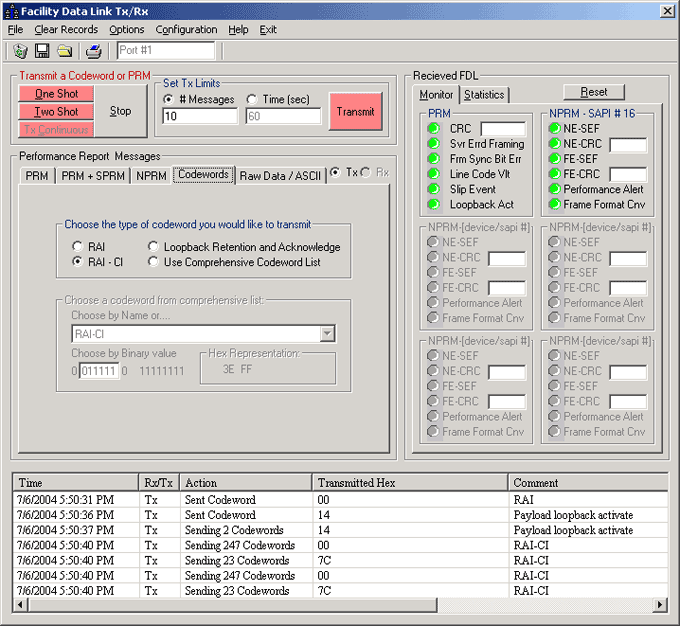
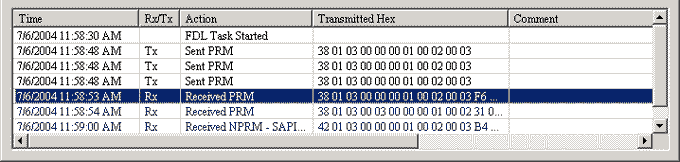
History: Which depicts Time (with date and time) column, Tx/Rx (indicates message sent or received) column, Action (Indicates which type of message has been sent or received) column, Transmitted Hex (Action associated hex will be displayed) column, Comment (Displays which type codeword has been sent or received) column. The details available in the history can be saved as text file (.txt) and can be loaded later for analysis. Checking "log out-put" under option menu, automatically can save sent and received messages.
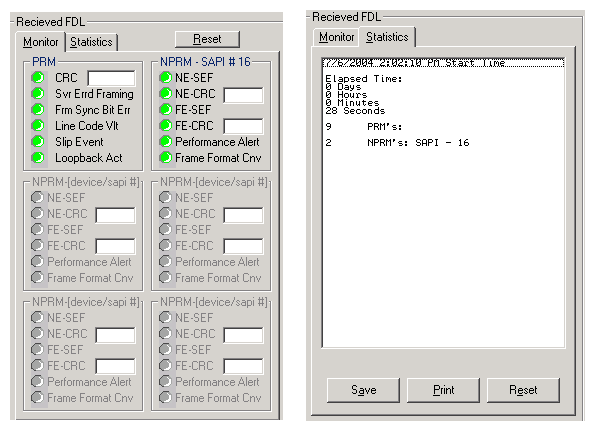
Received FDL: This section consists of Monitoring alarms and Statistics part. Monitoring of all PRMs will indicate the errors received from various PRMs. While the statistics part deals with maintaining or keeping track of the number of types the PRMs with elapsed time. Provision is made to reset and to start a fresh, to get print and to save the statistics.
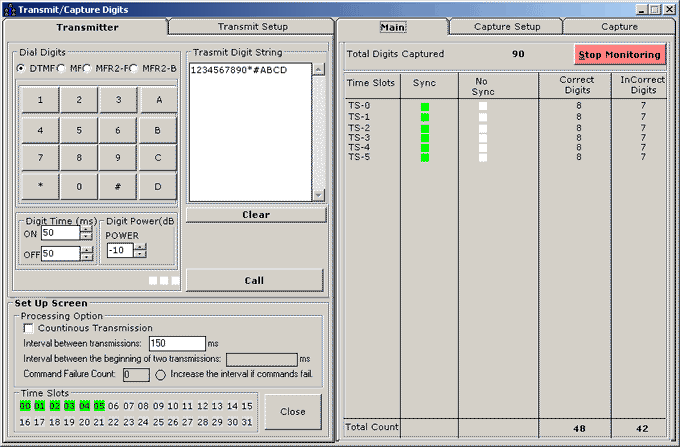
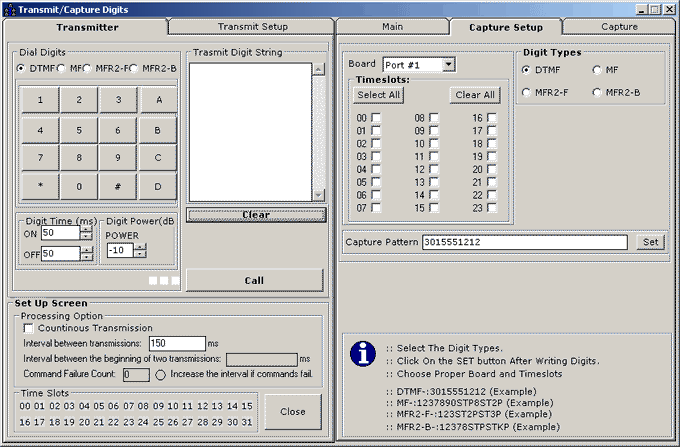
Transmit and Capture Digits:he Capture Dialed Digits application provides the capability to capture and display DTMF and MF (along with MFR2-forward and MFR2-backward) digits as they are received on one or several time slots. This application provides two basic modes of operation: Manual and Scan for Offhook Modes.
Transmit Digits
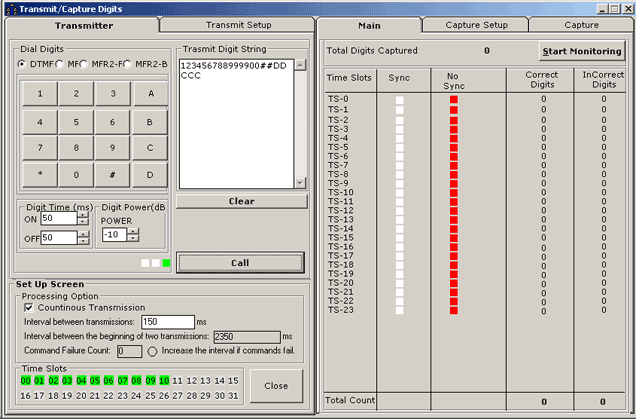
- Dial Digits:
DTMF, MF, MFR2-F, and MFR2-B are the formats in which digits are transmitted using transmitter. The digits can be dialed (1,2,3,4,5,6,7,8,9,*,0,#,A, B,C,D) and MF, MRF2-F, MFR3-B (1,2,3,4,5,6,7,8,9, ST,0,KP,STP,ST2P,ST3P), which will be displayed in the Transmit Digit String. Digit ON / OFF time is set in msec for the transmission. The Digit Power is set in dB.
- Set Up / Processing Options:
With the help of this the digits can be transmitted continuously. Interval between transmissions option is set as off time, and is displayed (in msec) at the end of every transmission. This should not exceed 1 Sec (1000msec). The commands failed and the failure counts are displayed in Command Failure Count.
- Transmit Setup:
The port # and the timeslots for digit transmission is set in this window.
Capture Digits
Enabling the Start Monitoring button and Call button in Transmitter tab the Timeslot selected, Sync gain and loss, Correct Digits, and InCorrect Digits are displayed.
- Capture Setup:
The port # and timeslots are set in Board option for capturing digits. DTMF, MF, MFR2-F or MFR2-B types are selected for capture. Capture pattern can be same as the digits transmission pattern or can be changed using Set button.
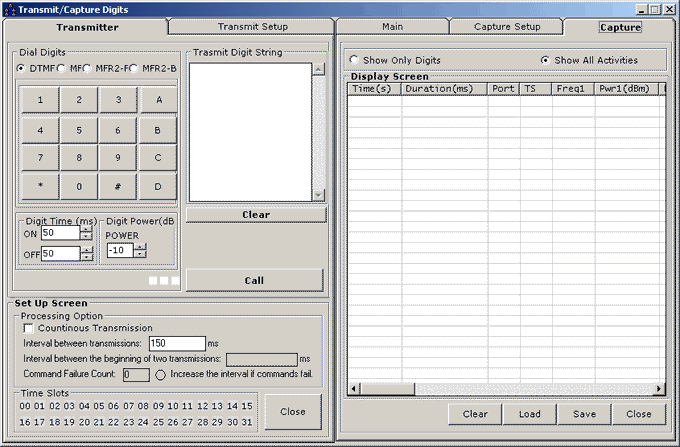
- Capture:
During capture only digits transmission can be displayed or all the other activities like - Time(s), Duration (ms), Port, TS, Frequency of port 1, Power of port 1, Frequency of port 2, Power of port 2, and comments can be displayed.
The transmission and receptions of digits are saved in a specified location in a txt format. The saved data can be reloaded again.
- RAI: This message indicates the loss of the incoming signal either in CI or in network.
Resources:
Please Note: The XX in the Item No. refers to the hardware platform, listed at the bottom of the Buyer's Guide, which the software will be running on. Therefore, XX can either be ETA or EEA (Octal/Quad Boards), PTA or PEA (tProbe Units), XUT or XUE (Dual PCIe Express) depending upon the hardware.
 Back to Client/Server Scripted Control Software Page