GL Enhances Network Surveillance Software
Welcome to another November 2014 issue of GL Communications' newsletter providing information and insight into our enhanced Network Monitoring and Test Products.
Overview
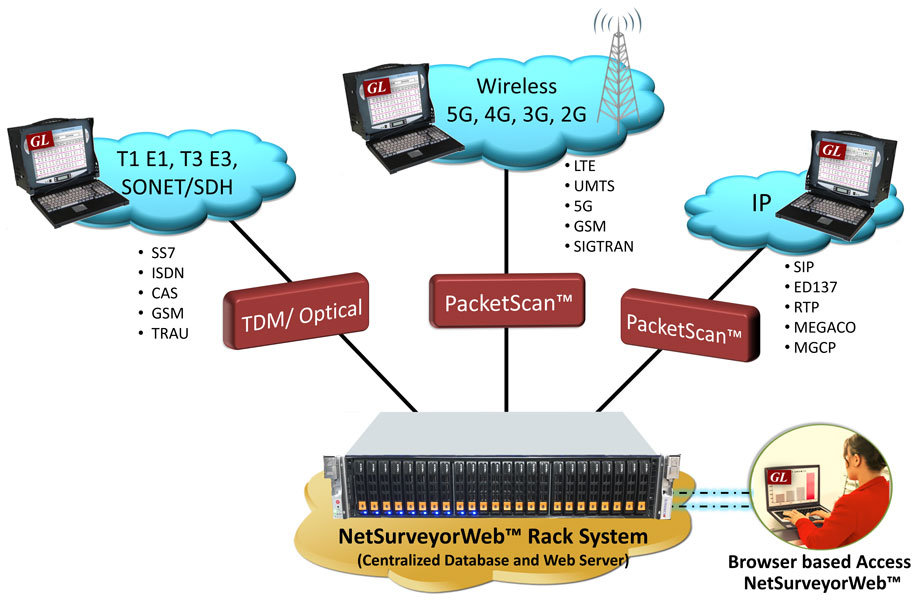
In today's advanced telecom networks, surveillance of network characteristics is becoming more important than ever before. Performance Monitoring, Capacity Management, Troubleshooting, Security, Fraud Detection, Alarm Monitoring, Billing Verification, Remote Protocol Analysis, Failure Prediction and Traffic Engineering are some aspects that necessitate continuous monitoring of network health. A network operator, service provider, or equipment manufacturer must have the means to perform the aforementioned surveillance tasks cost-effectively, remotely, automatically, and non-intrusively. GL's versatile Networking Monitoring Tools are one stop solution for customers' network surveillance needs.
GL has scalable network monitoring and testing probes and centralized collection and reporting systems for today's telecom networks. The probes provide instant visibility into the performance and operation of TDM, VoIP, and Wireless networks.
Maintenance engineers can securely access the network view from literally "anywhere" that Internet access is available. They can also monitor, diagnose, and troubleshoot remotely with easy to use scripts.
GL's currently available network surveillance software are:
- NetSurveyorWeb™ for SS7, ISDN, GSM, TRAU, and other protocols over TDM, and Wireless networks
- NetSurveyorWeb™ for GSM A and UMTS IuCS over IP , and other protocols over IP and Wireless networks
- NetSurveyorWeb™ for T1 E1 Physical Layer monitoring
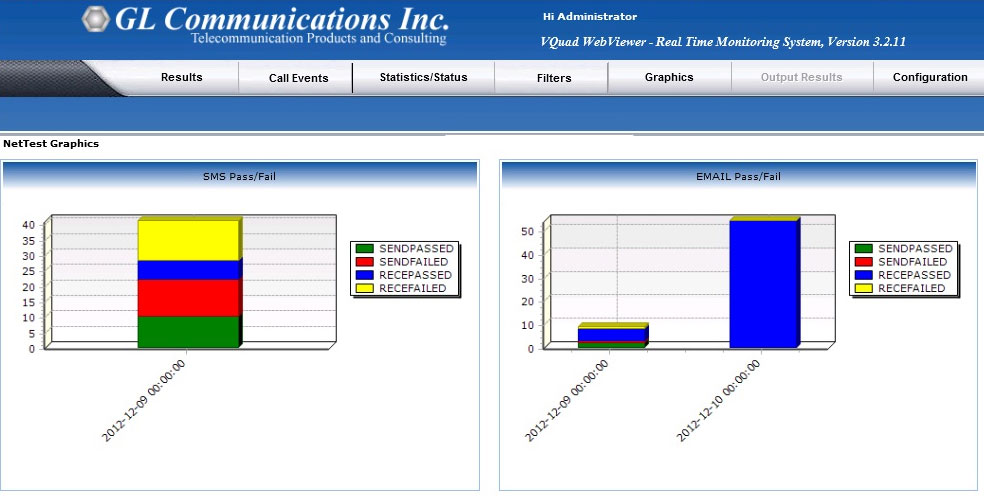
- VQT WebViewer™ for monitoring voice, and data quality over all networks
Common Characteristics
- Uniform Features across all Network Monitoring Systems (NMS)
- Scalable Probes
- Common Database Servers and Listeners
- Web Servers
An important characteristic of GL's Network Monitoring Solution is a common framework provided for TDM, VoIP, and Wireless networks. This results in a reliable, user-friendly systems. Enhancements, Reports, Administration, and Maintenance are uniform.
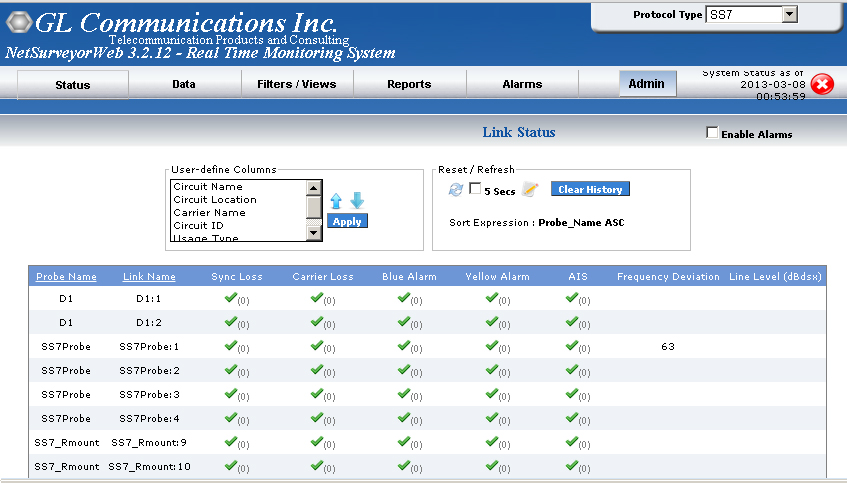
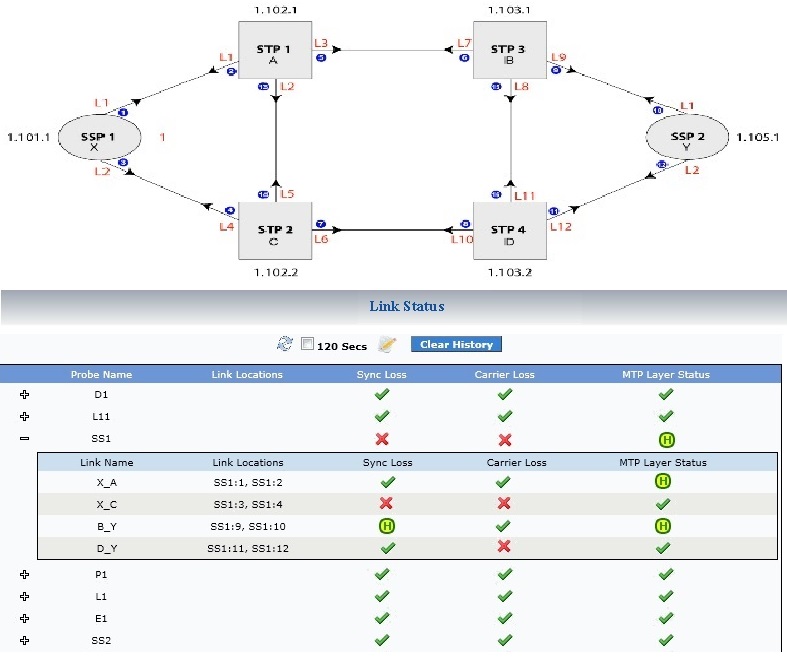
- Network Status or Link Status
The Network Status feature provides real-time status of all deployed probes. For T1 E1 networks, this feature displays physical and Data Link Status details such as Sync Loss, Carrier Loss and MTP Layer Status for all the available probes across the network. User can drag and drop any data column to Report View, save the configurations, and reuse depending on the monitoring requirements.
- Call Detail Records (CDR) View
The CDR view provides visibility into each individual call. All Key Performance Indicators (KPI) information is provided and each call can be investigated. Basic information displayed about each call includes Link Names, Call Id, Probe Name, Calling Number, Called Number etc.
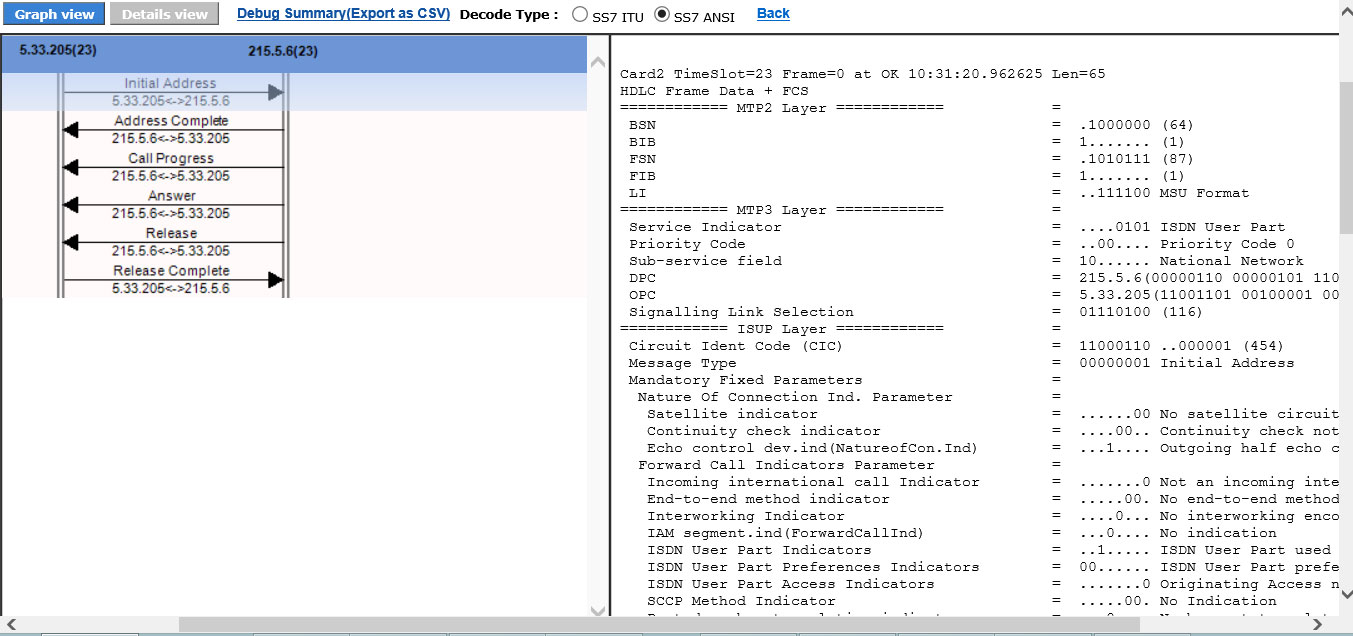
- Call Flow View
The call flow graph allows easy verification of the messages exchanged and the status of each call. Users can also highlight any messages in the left-hand pane ladder diagram and observe the corresponding message decode details in the right-hand pane of the window.
- Navigation of Records
This feature allows easy navigation of records Year-wise, Month-wise, Day-wise, or Hourly basis. User can view the data of Previous Hour, Day, Month, and Year or the data of Next Hour, Day, Month, and Year through the navigation tool.
- Protocol Switch
Protocol Switch feature is introduced to select protocols such as SS7, ISDN, GSM, VoIP, TRAU, or T1 E1 Layer 1 for Physical Layer Monitoring, depending on the type of protocol monitoring performed.
- Customized Graphs: (Bar/Pie/Line/Point chart types)
User can create simple SQL queries to generate any type of graph, or use the standard set of graphs already included in the software such as Call Volumes (Incoming, Outgoing, Call Failure Causes), Call Duration Analysis, Call Quality Analysis (CMOS, LMOS, Delay, SNR, Echo, Data Tests, etc.).
- Advanced Filters to choose any field from the CDR and apply logical conditions between multiple filters to drill down to the "Calls of Interest"
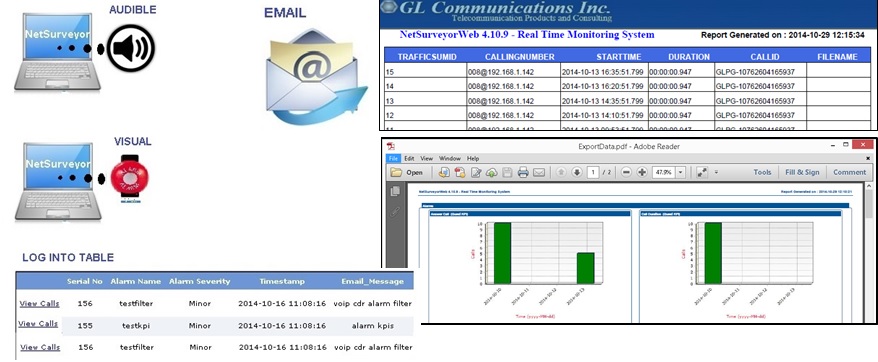
- Email Alerts automatically alert users when "Calls of Interest" are detected; customize alarm conditions and generate other alerts types such as visual alert, audible alert, or even log into tables for future analysis
- Ability to sort, filter and export the calls in CSV format within a user-defined time frame
- Flexible Report Generation feature to export "custom reports views" in PDF or CSV file formats
- User Management feature to create / manage users , define actions for users, and share permissions associated to each action
- Scalable Probes
Scalable probes at multiple and remote locations gather IP, TDM, and Wireless packet information in a non-intrusive fashion and forward CDRs and statistics to a central database. Only precise and filtered data (user selectable) is collected at the centralized database.
Examples of GL probes are:
- "All-IP PacketScan™" probe
- "Call Capture and Analysis over T1 E1" probe
- "Protocol Analyzer" probes such as SS7, ISDN, GSM, TRAU, and other 3G and 4G protocols over IP, TDM, and Wireless networks
- Common Database Server and Listeners
A Central Database stores the data collected by probes. Records are stored into a relational database (Oracle 11g) using ODBC. Listener is modifiable and supportable with MySQL.
- Web Server
A Web Server provides real-time and historical views of the data through various "browser based" clients using a web interface. Web Servers are supported with ASP.NET, IIS, Windows® 7 Professional 64-bit and Windows® Server 2008.
Screenshots
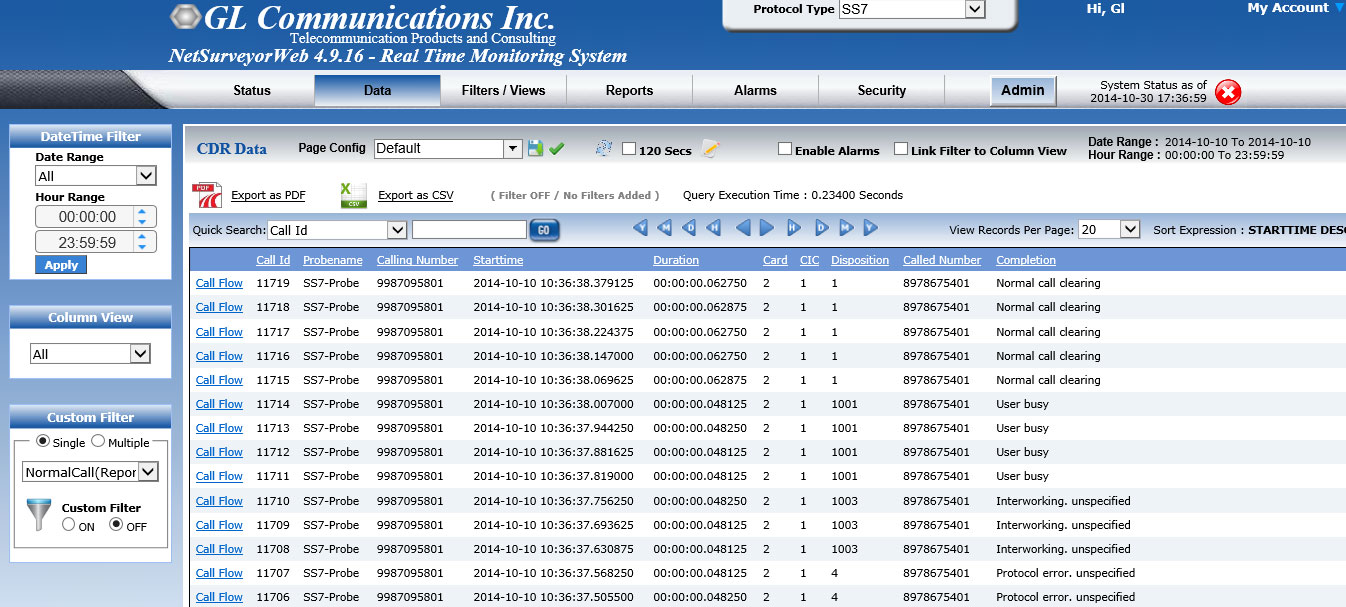
SS7 CDR
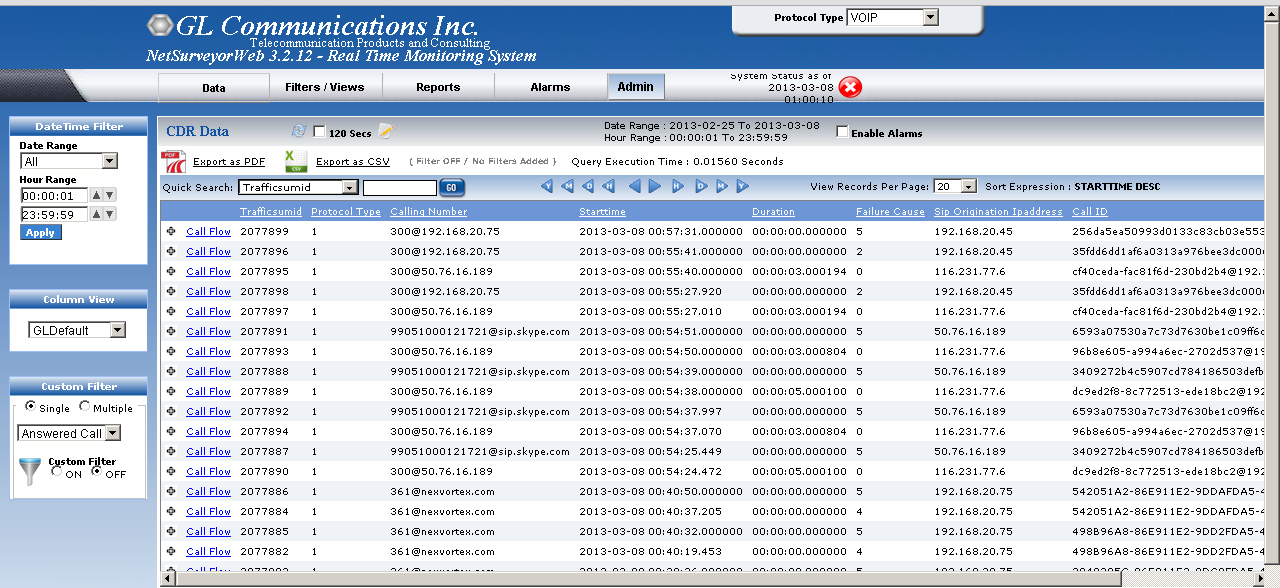
VoIP CDR
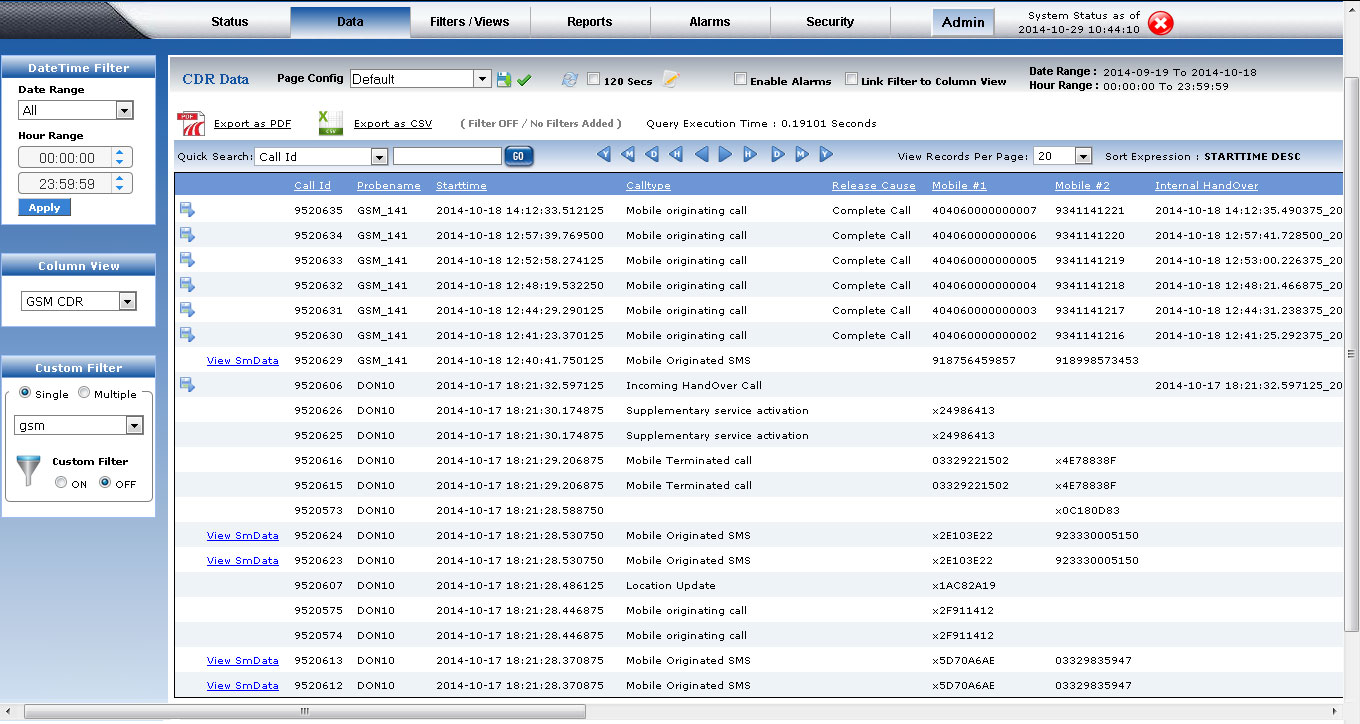
GSM CDR
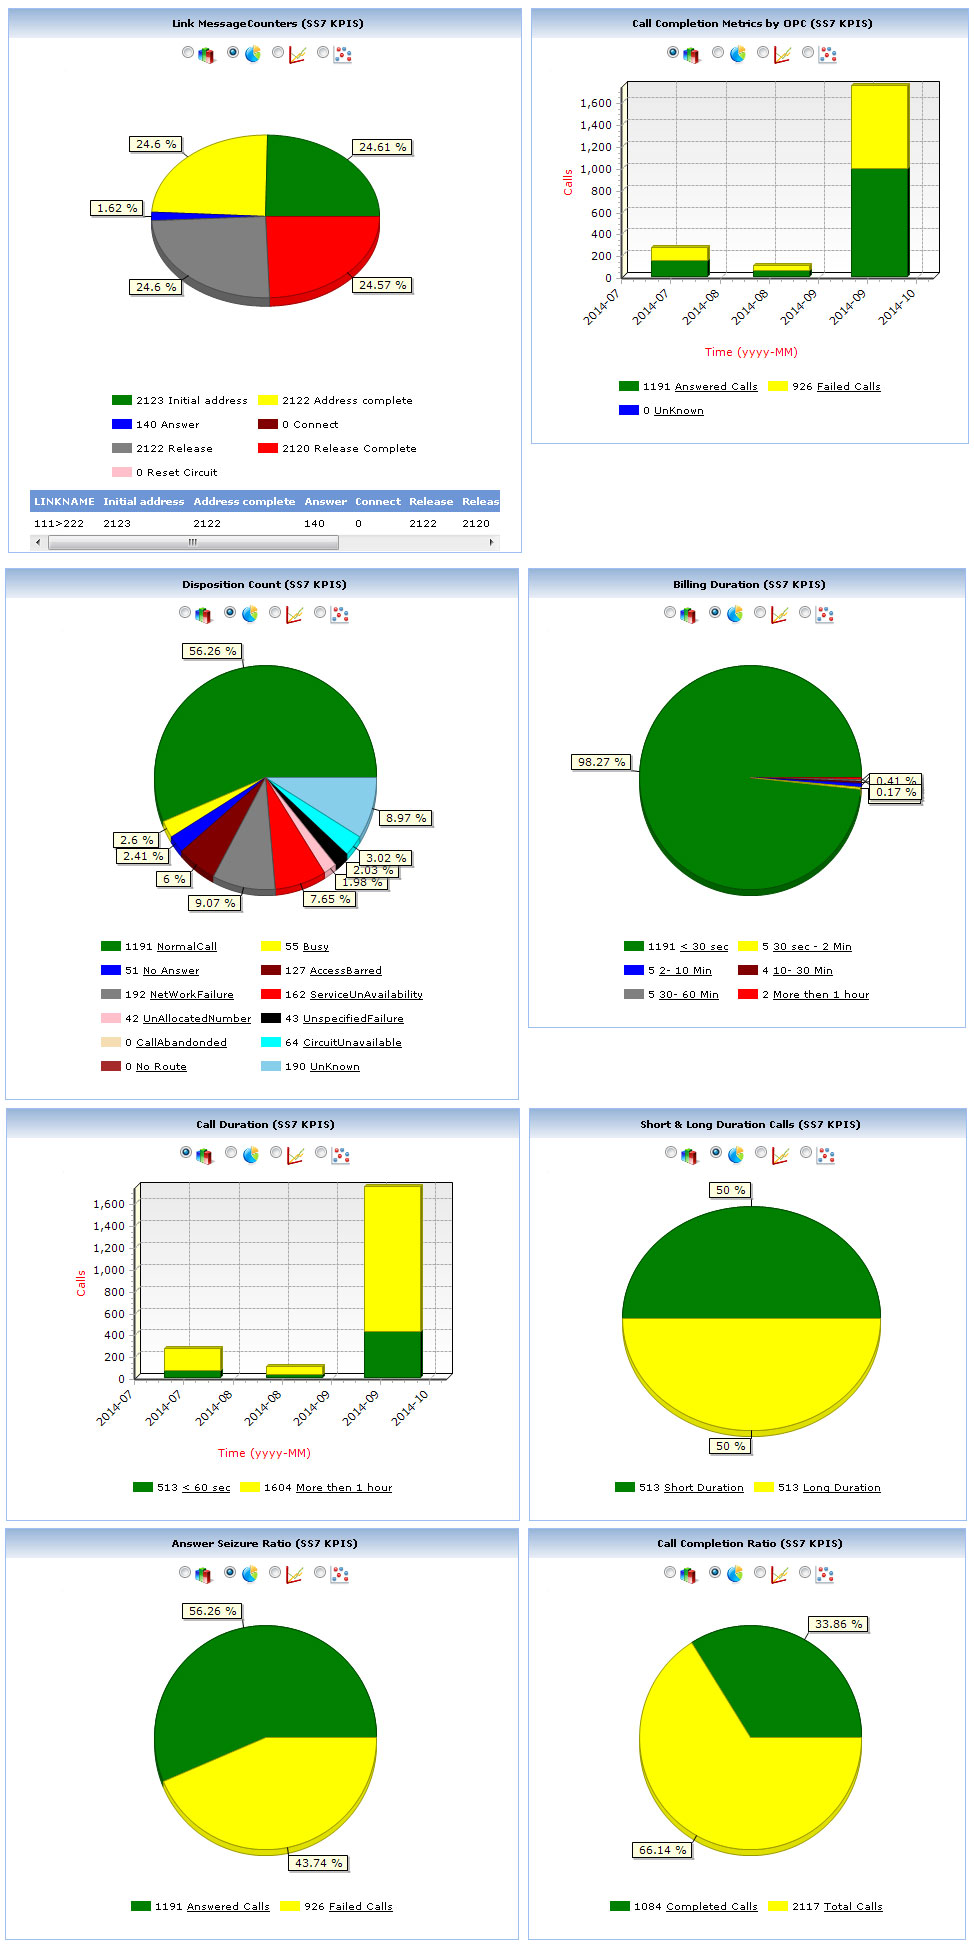
SS7 Graphs
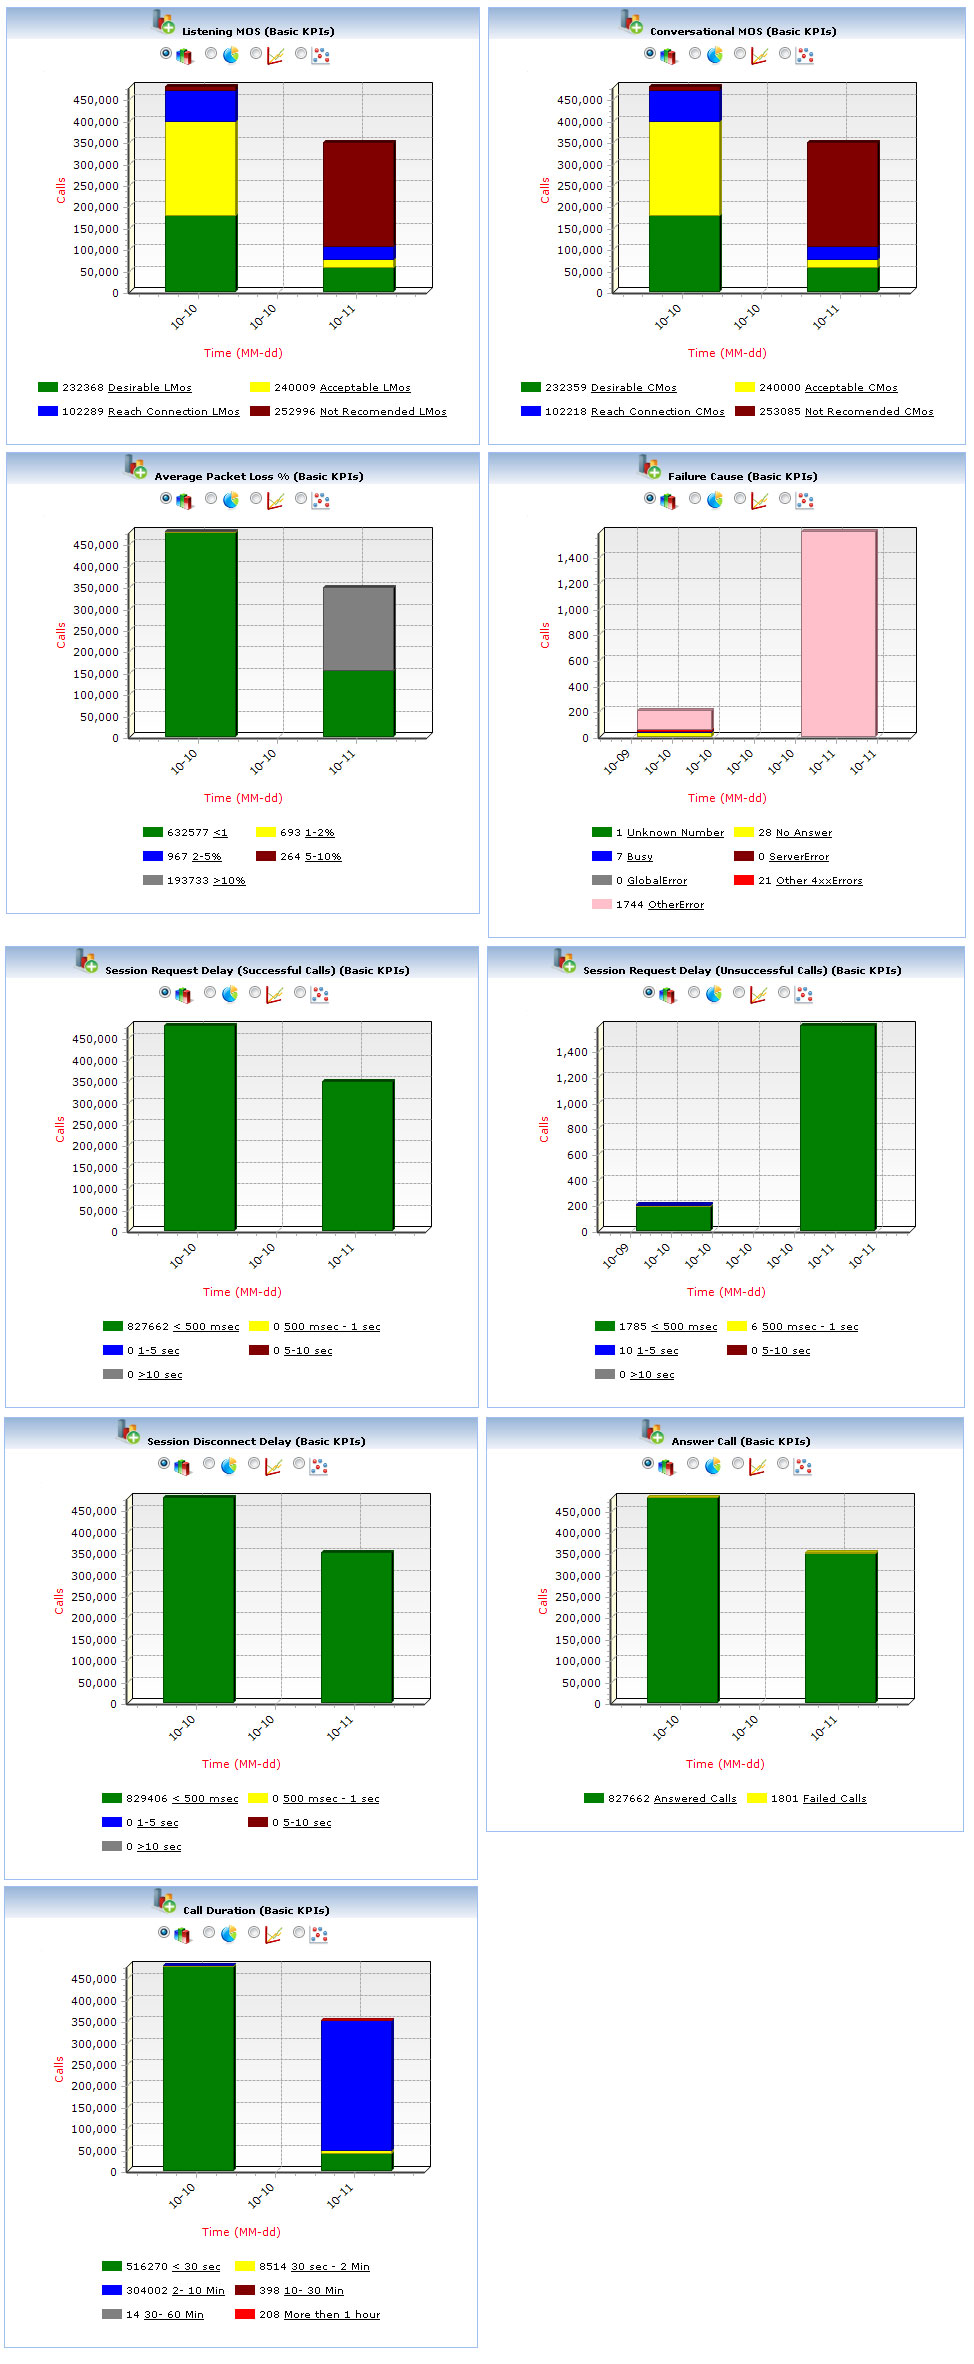
VoIP Graphs
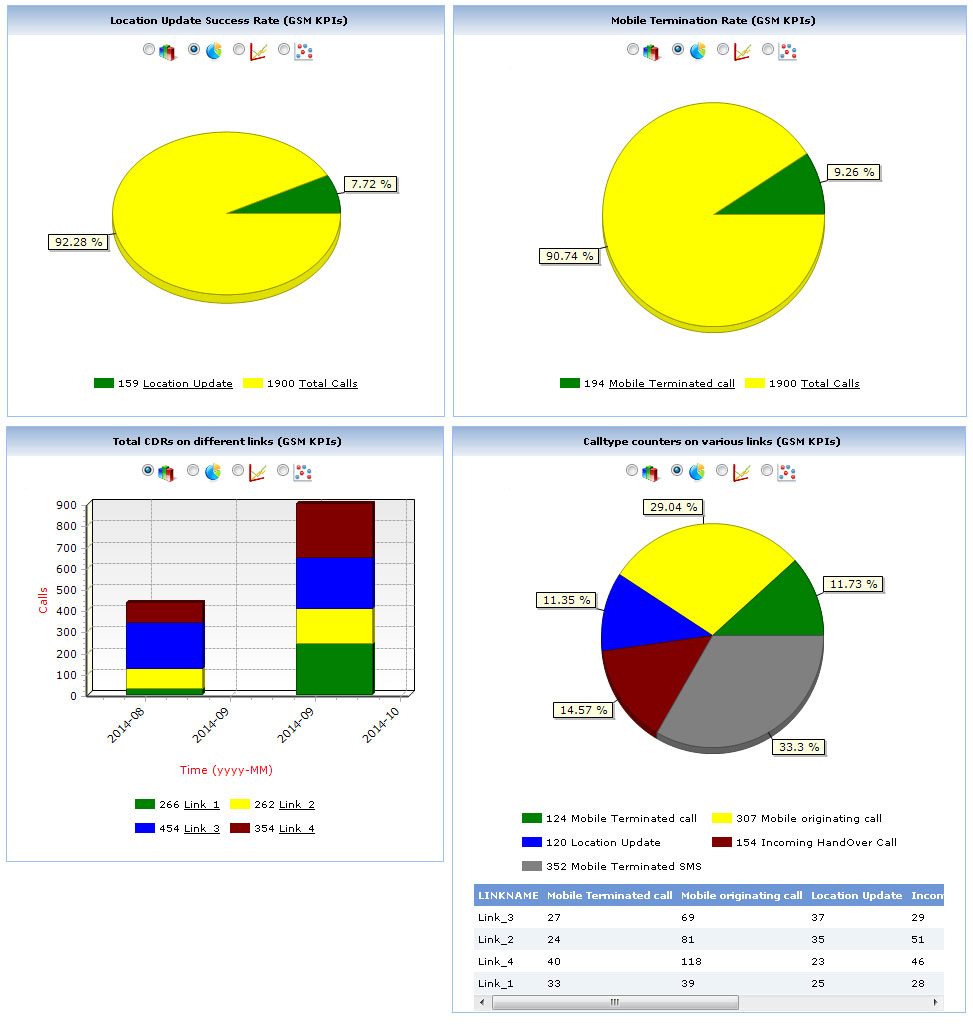
GSM Graphs
T1 Phyiscal Layer Alarms
Data TestGraph
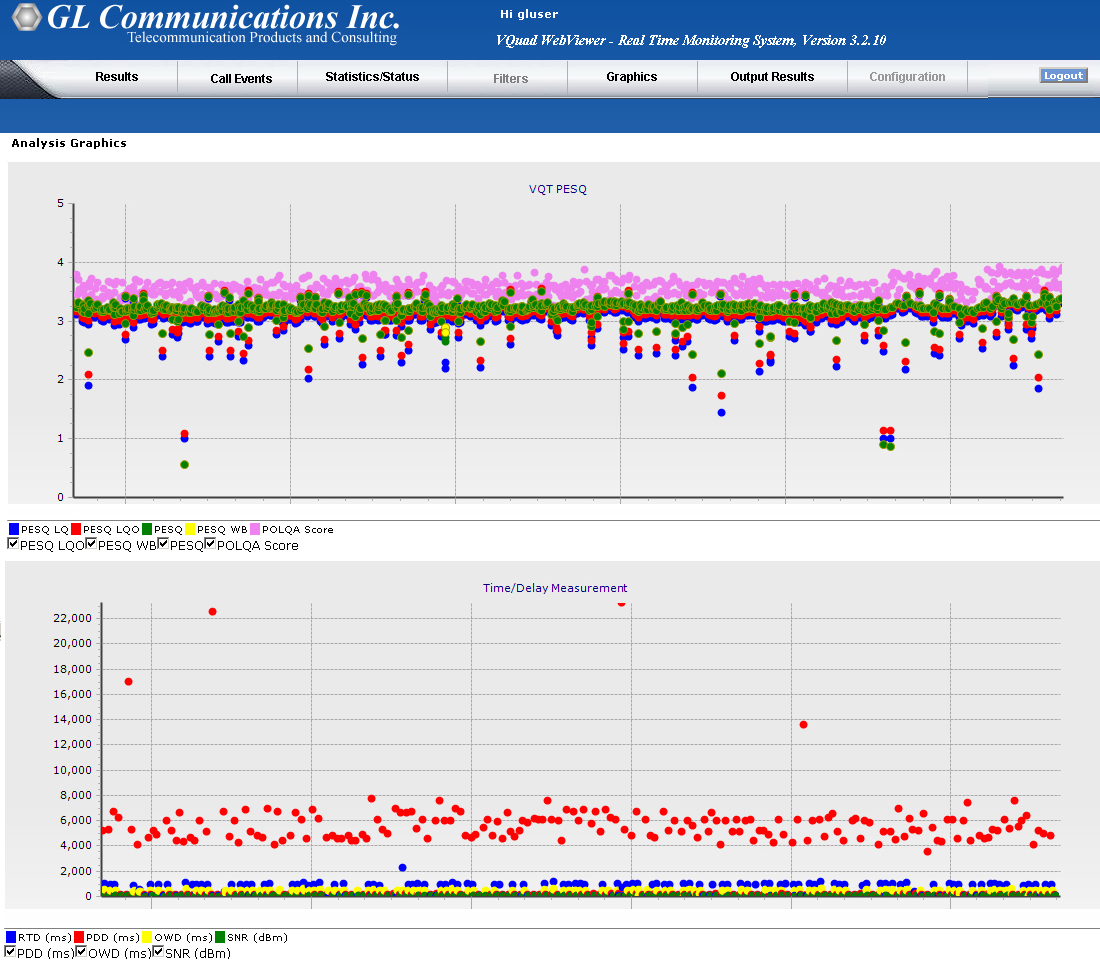
Voice Quality Graphs
Email, Audio & Visual Alerts
Protocol Decode & Call Flow
Network Link Status
 Back to Newsletter Index Page