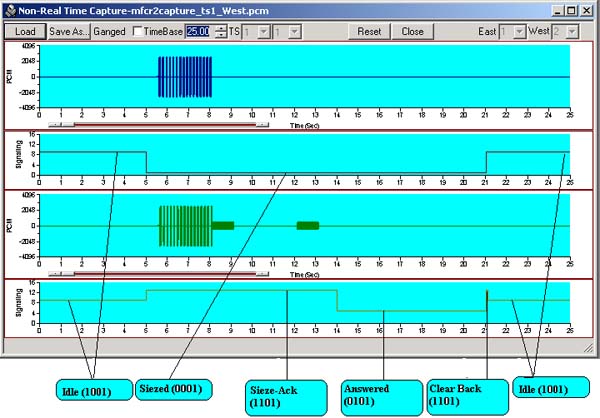
Strip Chart with Real-time Signaling and PCM data Transitions
Real-time Strip-Chart application is included with T1 E1 Basic Software
Request a Demo / Quote Brochure
Overview
The Real-time Stripchart application software (XX024) is used for analysis of CAS signaling. The application works with all GL’s T1 E1 analyzers. The Stripchart enables non-intrusive capturing of PCM data and signaling, and subsequent plotting of the same onto a strip chart format. The application is perfect for CAS protocols, DTMF or MF Signaling, or other voice and signaling timing relationships. Now, Real-time Stripchart (xx024) is available as a part of T1 E1 analyzer basic applications.
Strip-Chart Main Features:
- Compatible with Windows® 7 and above Operating Systems
- Supports Real-time capturing and off-line analysis of PCM Data as well as Signaling
- Enables the user to view data graphically with exact transition of signals with time
- Ability to capture PCM and signaling data on any of user-specified time slot
- Grid based Canvas / Background display enabling ease of locating / reading data points.
- Option to choose specific T1 E1 ports in case of more than two port systems
- Loading of previously captured PCM and Signaling files, for off-line viewing
- Zoom-in and Zoom-Out of data based on the time-base settings. The time base varies between 0.01 till 25. Easy Intermediate zooming features without resetting to zero.
- Monitoring of "Available Bytes" & "Missed Bytes" in Real-time Capture, enabling the user to quickly check the data missed, if any at the time of capture
- Selection of Timer Interval to set capture rate for data
- Ganged option synchronizes (both PCM & Signaling) data on the graphic display
- Automated naming convention for saving PCM and Signaling file based on timeslots for loading the captured files in the appropriate timeslots
- Chooses Signaling file automatically (for E1s) based on the name of the PCM files
- Appends data between successive captures
Real-time Strip Chart Configuration
The Card parameters set at the main GUI are global and applicable to the Strip-Chart application. At any given point of time, data (PCM & Signaling ) can be captured from a maximum of any two T1 E1 ports.
The user can set the timer interval (in msec) which controls the capture rate, and also select the port numbers (for more than a two port system) and a time slot for each port.
Real-time Capture
Upon invoking the Strip-Chart application, the application window is displayed in Real Time mode. "Start" button toggles between "Start" and "Stop". The ongoing capturing process can be seen at the Status Bar in the form of total captured bytes (for both East & West Cards).
Once the Real-time capture is stopped, the Data captured can be viewed and also saved for further analysis and viewing. The Time Base control acts as a Zoom-In and Zoom-Out feature for the Strips.
Screen Shot of Real Time Capture window
Screen Shot of Illustrating the completion of real-time capture
Offline Viewing of Captured Data
The previously captured PCM data along with corresponding Signaling information can be viewed in this mode. Load button when invoked, brings the file-selection dialogue, where the user can choose the files to be loaded for offline analysis. Incase of E1 systems, when the user chooses PCM files, the corresponding Signaling files automatically get picked up and displayed. The Ganged feature can be used to keep all the charts in Synchronization on Time scale.
Screen Shot of Strip chart window showing the details of offline viewing
MFC-R2 Analysis and Emulation
GL's MFCR2 Analysis & Emulation solutions use any of the following hardware:
- T1 E1 Analyzer (Potable USB or HD PCI cards) Or
- MAPS™ Central Office Switching Simulation (PSTN, TDM, IP Networks)
Both the products supports remote capture & analysis using client-server technology,while MAPS™ Central Office is ideal for simulating and testing advanced telecom networks and products, including switches, gateways, and transmission systems.
Resources:
Please Note: The XX in the Item No. refers to the hardware platform, listed at the bottom of the Buyer's Guide, which the software will be running on. Therefore, XX can either be ETA or EEA (Octal/Quad Boards), PTA or PEA (tProbe Units), XUT or XUE (Dual PCIe Express) depending upon the hardware.
| Item No. | Item Description |
| XX024 | Real-Time Strip-Chart (Available as a part of basic applications in T1 E1 analyzer) |
| Related Software | |
|---|---|
| XX020 | Record / Playback File Application |
| XX031 | Enhanced T1 E1 Call Capture/Analysis Software |
| XX050 | Signaling Bit Recorder |
| Related Hardware | |
| PTE001 | tProbe™ Dual T1 E1 Laptop Analyzer with Basic Analyzer Software |
| FTE001 ETE001 |
QuadXpress T1 E1 Main Board (Quad Port– requires additional licenses) OctalXpress T1 E1 Main Board plus Daughter Board (Octal Port– requires additional licenses) |
| XTE001 | Dual T1 E1 Express (PCIe) Boards (requires additional licenses) |
| Brochures |
| T1 E1 Realtime Strip Chart - Brochure |
* Specifications and features subject to change without notice.
 Back to List of T1 E1 Basic and Optional Applications Index Page