Protocol Analyzer for TDM, IP, and Wireless Networks
25th, Jul 2021
Welcome to another issue of GL communication newsletter providing information and insight into our Protocol Analyzers which offers a wide variety of centralized monitoring and testing technologies for TDM, IP, and Wireless networks.
Overview
GL’s protocol analyzers monitor in accordance with industry protocol standards by non-intrusively tapping the network under test. The simple framework of the protocol analysis software helps you easily identify the improper sequence of protocol messages and filter out frames causing the protocol violation.
GL carries the widest array of protocol analyzers for TDM, Wireless, Optical, and Packet networks. Based on a uniform architecture with identical features and functions, they can be used for a wide variety of tasks, including
- Independent standalone units for simple interface analysis
- Act as a remote or offline protocol analyzers
- Multiple protocol analyzers at different geographical location can send information to a central database. The database and web application comprise the GL Surveillance System, a unique analytical tool for monitoring telecom networks
- As a network element for advanced traffic collection and processing
- Network troubleshooter which drill through huge captured protocol traces using extensive capture and view filters and search capabilities, centralized tracking, and monitoring
- Periodic trace saving allows automatic trace back up and capture trace size limited only by available disk space. Periodic saving saves data into files using size, number of frames, or time period criteria
- Extensive and versatile statistics can be dynamically created based on the summary fields using dynamic criteria specified by users
- Call detail records can be created and signaling records can be displayed on per call bases for subsequent analysis
- Physical layer alarms can be included in trace files that can explain layer 2 and layer 3 signaling problems
- T1/E1/T3/E3 physical layer protocol analyzers enable SNMP DS-1 DS-3 standard MIB traps to be sent to SNMP management applications
Existing to this GL's PacketScan™- All IP Protocol Analyzer supports monitoring all 2G, 3G, 4G, IMS, and 5G wireless communication protocols such as GSM, GPRS, UMTS, SIGTRAN, LTE, and Diameter, in addition to IP protocols such as SIP, MGCP, MEGACO, Skinny, and H.323.
PacketScan™ cellular protocol analyzers support analyzing signaling across multiple technologies (Mobile, IMS, LTE, SIGTRAN, VoIP, etc.). Monitor calls progressing through advanced 3G or 4G networks from a central location, along with the powerful and customizable reporting tools.
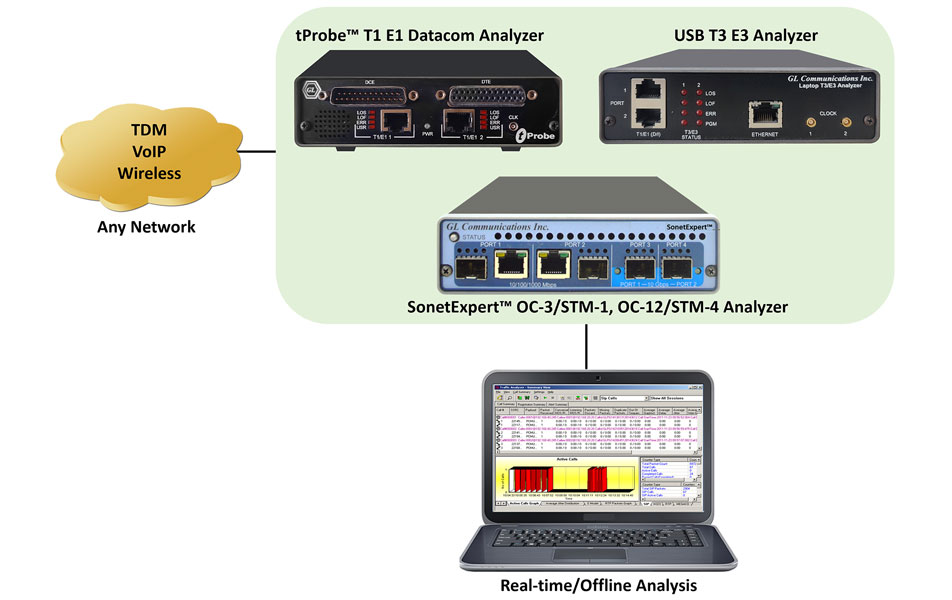
Packet Data Analysis (PDA) is an outstanding tool for live monitoring of signaling and traffic over IP. Packet Data Analysis (PDA) is distributed with GL’s Packet Analyzers, allowing users to monitor live IP networks including capture, analysis, and reporting of every call-in detail. Supported protocols include SIP, MEGACO, MGCP, H.323, SCCP, RANAP (UMTS IuCS), and GSM A. It can capture IP packets and frames over different transmission lines, including IP, T1, E1, T3, E3, and OC-3/STM-1, OC-12/STM-4. PDA then processes the captured packets, identifies, and segregates calls based on signaling and traffic parameters.
The supported protocols in TDM for T1/E1, T3/E3, and STM-1/STM-4 --> HDLC, Physical Layer Analysis, ISDN, SS7, GSM, GPRS Gb, UMTS, GR-303, V.5x, CAS ATM, Frame Relay, PPP, TRAU, CDMA 2000, SA Bit Analysis, SSM Analysis, DDS Analysis, and FDL Analysis
Recent Enhancement
- Summary information display can be configured for optimal presentation of information according to customer criteria. Aggregate columns provide flexibility for efficient use of the monitor real estate.
- Users can specify search/filter from the currently selected summary fields that are displayed. Data of summary column decode can be used as a prototype for quick and easy search and filter criteria specification that can be further modified
- Users can open an offline file and specify the view filter of interest. The fast multithreaded filter can filter out millions of records per second
- The filters can be applied for T1/E1/T3/E3/OC-3/OC-12 and T1/E1 carried within T3/E3/OC-3/OC-12
- Flexible selection of search/filter criteria for different kind of errors
Important Features
- Advanced filtering and search based on any user-selected protocol fields
- Any protocol field can be added to the summary view, filtering, and search features providing users more flexibility to monitor required protocol fields
- Trigger intelligent actions based on signaling, and traffic conditions
- Support for automatic multi-protocol decoding
- Displays Summary, Detail, Hex dump, Statistics, and Call Detail Views
- View filter to displays only user-selected frames from the Summary View
- Provides options to display or hide details for the requested protocol layers
- Hex Dump View displays the frame information in HEX and ASCII format, the contents of this view can also be copied to the clipboard
- Statistics View displays statistics based on frame count, byte count, frames/sec, bytes/sec, etc for the entire capture data
- Call Detail View displays called/ calling number, released calls, call status, & more
- Provides a consolidated interface for all the important settings required in the analyzer. All the configuration settings done in any of these options can be saved to a file, loaded from a configuration file
- Allows the captured frames to be saved periodically to a trace file using different criteria such as file size, frame count, or time limit. This doubles as automatic trace backup in case of catastrophic failures preventing data loss
- Provides scalable, centralized, real-time, end-to-end network visibility and troubleshooting capability
 Back to Newsletter Index Page