GL Announces High-Density IP Traffic Analyzer
Welcome to another February 2015 issue of GL's Newsletter providing information and insight into our latest product High-Density IP Traffic Analyzer referred to as PacketScan™ HD (High Density). PacketScan™ is GL's standard framework for monitoring IP traffic. The HD version is a special purpose 1U hardware platform capable of detailed monitoring of high volume IP traffic (thousands of simultaneous calls).
Overview
Capturing and analyzing high volume IP calls is increasingly important to Wireless Carriers, Internet Service Providers, and Equipment vendors to ensure that quality of experience does not degrade with call intensity, volume, or signaling protocol. During pre- and post-deployment, load and stress testing are necessary to verify the stability of IP networks and network elements. Quality of Service has always been a concern for carriers and service providers. They know that proactive monitoring of voice quality leads to happy customers. This requires an advanced network monitoring appliance which can capture and analyze high volume calls like GL's PacketScan™ HD.
GL's PacketScan™ HD is a high density multi-protocol 1U rack mounted Network Monitoring Appliance w/ 4 x 1 GigE network interface cards that can capture and process high volumes of communication protocols/traffic over IP and Wireless networks. Almost all VoIP and Wireless protocols over IP transport layer can be captured, decoded, filtered, and analyzed. Troubleshooting network problems becomes much easier.
Functional Capabilities
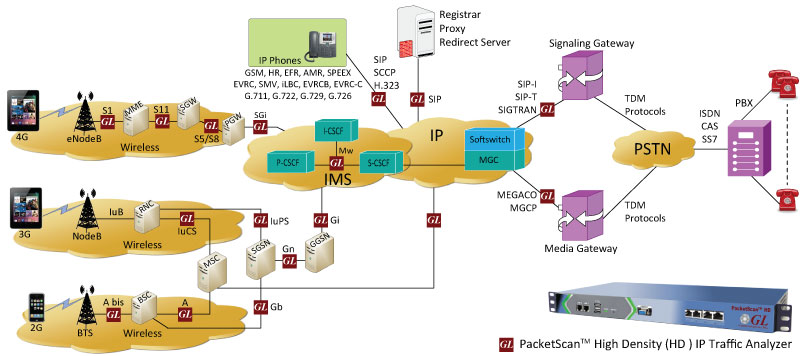
The PacketScan™ HD supports simultaneous capture and processing of up to 5000 calls with duplex traffic at 1 Gbps rate (per appliance) and using a stack of multiple servers, a larger test system with more calls is achievable for enterprise to carrier grade testing. It supports a variety of protocols over IP and Wireless networks such as SIP, MGCP, MEGACO, H.323, Skinny, LTE, Diameter, UMTS, GSM, and GPRS carried over SCTP transport layer (Link).
The PacketScan™ HD can act as a probe to monitor the network and send Call Detail Records (CDR) to a centralized database server. GL's NetSurveyorWeb™ can retrieve data from the database server and act as Central Monitoring System.
The PacketScan™ HD appliance has the ability to capture and analyze calls in real-time and it can be used for traffic analysis of Digits, Tones, Voice, Video, and Fax.
The Packet Data Analysis (PDA) module within PacketScan™ HD provides in-depth real-time and post-process data investigation. Its Quality of Service parameters include E-model (G.107) based MOS/R-Factor scores, Packet Loss, Delay, and Jitter for voice calls. Media Delivery Index is also available for Video. It has complex filtering and search capabilities to record all or filtered traffic into a trace file and almost all industry standard codecs are supported.
The PacketScan™ HD provides Audio Capture and Playback, and Fax Call Capture and Decode (extracting fax images in TIFF format). TheTriggers and Actions feature of the application allows filtering calls based on call parameters and perform different actions (save call, record audio etc) on the saved calls.
Other Enhanced Features Include:
- SIP Performance Metrics
Additional SIP performance metrics have been provided in statistics counters for SIP calls. They are: Session Establishment Ratio, Session Establishment Effective Ratio, Session Defects, Ineffective Session Attempts, Session Completion Ratio, Session Request Delay, and Session Disconnect Delay. - Call Summary Tab
In Packet Data Analyzer portion of PacketScan™, a new tab has been added that displays Signaling and Audio Parameters for the selected call (SIP, H323, MEGACO etc). - Save Call
Save Call feature has been enhanced to save the captured trace along with a PCAP compatible file. - Alert Summary
This feature generates alerts when a particular vital parameter goes beyond a specified value. The user can specify the criteria based on which the alerts are to be generated. The alerts can be set by selecting an option in Alert Summary and in Triggers and Action Settings tab as well. Alert Summary tab provides summary of the each alerts that have occurred during the analysis. Each summary information has the following columns: Call#, Protocol, Message, Type, Threshold, Value, Caller, Callee, CallId.
 Back to Newsletter Index Page