TRAU Traffic Analysis
Overview
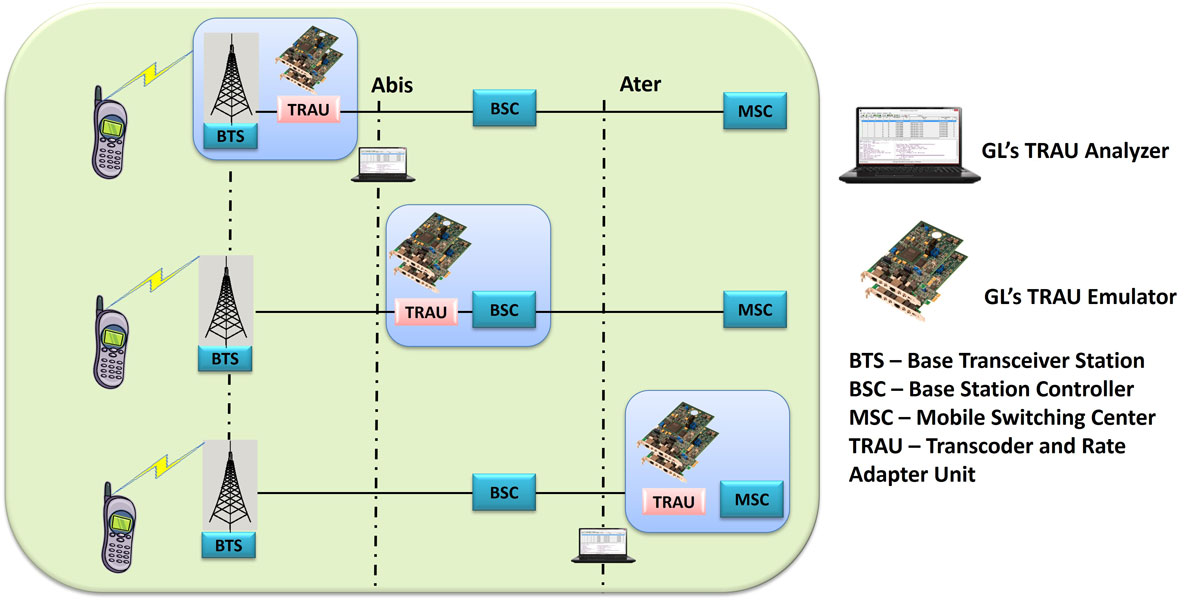
GL's TRAU Analyzer is used to non-intrusively monitor TRAU frames at the A-bis interface (BTS to BSC links), and A-ter interface (BSC to MSC links). Application can automatically detect and capture TRAU frames of half rate (HR-8 kbps) or full rate (FR-16 kbps). Various codecs such as FR, EFR, AMR, AMR-WB, HR and Data are used for compression/decompression of speech. TRAU frames are decoded as per the specifications GSM 08.60 V 8.2.0 Release and GSM 08.61 V 8.1.0 Release.
Analysis of TRAU calls, including detail statistics, wave graph, oscilloscope, spectral display for various codecs can be done using TRAU Packet Data Analysis (PDA) feature. It also allows users to play voice files to speaker, write speech data to a file, filter calls, detect digits and view graphs such as Active Calls, and Traffic Monitoring to identify Full Rate and Half Rate traffic with traffic type and direction in a pictorial format.
A-bis Signaling can be monitored using GSM Analyzer (optional). Traffic Analyzer Detail View allows the user to have a detail look at one (or two) TRAU sessions that are part of a single call. The view is divided into two parts, which assists in any comparisons to be made between the two sessions.
Main Features
- Displays Summary, Detail, Hex-dump, Statistics, and Call Trace Views, the contents of this view can also be copied to clipboard.
- Summary View displays TRAU Frame type, Frame Direction, Speech Frame classification, Time Alignment, CRC, RIF, AMR mode, AMR-WB mode and so on in a tabular format.
- Detail View displays decodes of a user-selected frame from the Summary View.
- Hex dump view displays raw frame data as hexadecimal and ASCII octet dump, the contents of this view can also be copied to clipboard.
- Statistics View displays statistics based on frame count, byte count, frames/sec, bytes/sec etc for the entire capture data.
- Decode TRAU frames with codec such as FR (Full Rate GSM 6.10), HR (Half Rate), EFR (Enhanced Full Rate), AMR(Adaptive Multi Rate), AMR-WB, O&M, Data.
- Supports transmission rate of 16 kbps (GSM 08.60) & 8kbps (GSM 08.61).
- Decodes & displays frame synchronization bits, data bits & control bits.
- Supports filtering and search based on various TRAU frame direction, type, time alignment, CRC, and more.
- Ability to configure .INI file for advanced decoding options such as capturing of raw bits, set Discontinuous Transmission (DTX_MODE) for the EFR frame, and set/reset Discontinuous Transmission (DTX) bit for the uplink EFR frame.
- Exports Summary View information to a comma delimited file for subsequent import into a database or spreadsheet.
- Capability to export detail decodes information to an ASCII file.
- Any protocol field can be added to the summary view, filtering, and search features providing users more flexibility to monitor required protocol fields.
- Remote monitoring capability using GL's Network Surveillance System.
Additional features supported by real-time analyzer are:
- Trau streams may be captured on the selected time slots (contiguous or non-contiguous), sub-channels or full bandwidth 32 or 24 channels.
- Capture and decode TRAU frames such as FR (Full Rate GSM 6.10), HR (Half Rate), EFR (Enhanced Full Rate), AMR(Adaptive Multi Rate)., AMR-WB, O&M and Data.
- Extracts speech data from TRAU frames, play the speech data on PC soundcard, or, record voice to a file, after decompressing TRAU speech data to 16-bit linear PCM.
- Variations accommodated in the software are inverted or non-inverted data.
- Multiple streams of TRAU traffic on various T1 E1 channels can be simultaneously decoded with different GUI instances.
Additional features supported by Offline TRAU Analyzer:
- Trace files for analysis can be loaded through simple command-line arguments.
- Multiple trace files can be loaded simultaneously with different GUI instances for offline analysis.
Protocols Supported
The list of protocols that are supported by GL's TRAU analyzer are as given below:
| Supported Protocols | Specification Used |
|---|---|
| TRAU | GSM 08.60 V 8.2.0 Release and GSM 08.61 V 8.1.0 |
| 3GPP TS 48.060 V5.2.0 for amr-wb |
For more details, visit protocol glossary webpage.
Summary, Detail and Hex dump Views
The real-time TRAU analyzer application is invoked from the main menu of GL's T1 E1 Analyzer. The offline TRAU analyzer is invoked from the installation directory of the offline TRAU Analyzer. The analyzer displays Summary, Detail and Hex dump View in different panes. The Summary View displays Direction, Frame Number, Time, Length, Error, CRC, Frame Sync, Time Alignment, RIF, AMR mode, and AMR-WB mode and more. User can select a frame in Summary View to analyze and decode each frame in the Detail View. The selected frame is analyzed and decoded according to TRAU frame specifications. The Hex dump View displays the frame information in HEX and ASCII format.
Real-time and Offline Analysis
Users can capture and analyze TRAU frames using either real-time or offline analysis. The recorded trace file can be used for offline analysis or exported to a comma-delimited file, or ASCII file. The raw data capturing requires user to specify timeslots, bit inversion, user/network side, and hyper channels. The Recorded trace file can be played back on T1 E1 using the TRAU Traffic Playback application.
TRAU analyzer can decode TRAU speech frames, which uses the codecs given below
| Codec | Rate | Codec Spec | Frame Size | Format Spec |
| FR | 16 kbps | GSM 6.10 | 40 Bytes | GSM 08.60 |
| EFR | 16 kbps | GSM 6.60 | 40 Bytes | GSM 08.60 |
| AMR | 16 kbps | GSM 6.90 | 40 Bytes | GSM 08.60 |
| AMR-WB | 16 kbps | 3gpp 26.190 | 40 Bytes | 3gpp 48.060 |
| Idle speech | 16 kbps | - - | 40 Bytes | GSM 08.60 |
| HR | 16 kbps | GSM 6.20 | 40 Bytes | GSM 08.61 |
| HR | 8 kbps | GSM 6.20 | 20 Bytes | GSM 08.61 |
| AMR | 8 kbps | GSM 6.90 | 20 Bytes | GSM 08.61 |
TRAU analyzer can also capture & decode TRAU frames of other types such as O&M, Data at 16 kbps (GSM 08.60) & 8kbps (GSM 08.61).
Filtering and Search
Filtering and search capabilities adds as another powerful feature to the TRAU Analyzer. These features isolate required frames from captured frames in offline as well as real-time. The frames can be filtered during capture or after completion of capture based on Frame Direction, Type, Speech Frame Classification, Time Alignment, AMR mode, AMR WB mode and so on. Similarly, search capability helps user to search for a particular frame based on specific search criteria.
Statistics View
Statistics is an important feature available in TRAU analyzer and can be obtained for all frames both in real-time as well as offline mode. Numerous statistics can be obtained to study the performance and trend in the GSM network and it is based on protocol fields and different parameters.
Enhanced Trace Saving Options
Users can control the captured trace files by saving the trace using different conventions such as trace files with user-defined prefixes, trace file with date-time prefixes, and slider control to indicate the total number of files, file size, frame count, or time limit. This feature also allows the captured frames to be saved into a trace file based on the filtering criteria set using display filter feature.
Save/Load All Configuration Settings
Protocol Configuration window provides a consolidated interface for all GUI and protocol settings required in the analyzer. This includes various options such as protocol selection, startup options, filter/search criteria and so on. Any protocol field can be added to the summary view, filtering, and search features from this GUI providing the users more flexibility to monitor required protocol fields. All the configuration settings done in any of these options can be saved to a file, loaded from a configuration file, or user may just revert to the default values using the default option.
TRAU Packet Data Analysis
TRAU Packet Data Analysis (PDA) is a part of the TRAU Protocol Analyzer and when invoked it displays call information in tabular and graphical formats (PDA - Summary View) as well as detailed frame by frame information (PDA - Detail View).
PDA Summary View
PDA (or Traffic Analyzer) Summary View displays summary of data reception in each direction including call identity, device number, channel number, start/end subchannel, total packets, codec type, CRC errors and bad frames. Each call displays Call Header with Call Number, Call Start Time, and Call Duration of the call, below to which summary of two sessions (left and right) will be displayed. It includes separate statistical counts on total packets, calls, and captured frames, etc.
In addition, it provides Active Call graphs to view active calls over the duration of the capture and TRAU Traffic Monitoring to identify the frames and classify traffic. An Active Call graph is a simple line graph, depicting the Number Of Calls Vs Time. The TRAU Traffic Monitoring uses specific color codes to identify the frames, along with the direction of its transmission. Each pictorial block indicates individual TRAU sessions. For simulation purposes these sessions can be created using TRAU ToolBox™ or TRAU Traffic Playback.
PDA Detail View
PDA (or Traffic Analyzer) Detail View allows the user to have a detail view at the two (or one) TRAU sessions that are part of a single call. The view is divided into two parts a left and a right pane to accommodate the two sessions. This distinction assists in any comparisons that are to be made between the two sessions. Vital aspects from the TRAU frame needed for close analysis are included in the table. The data is updated in real-time, i.e., as and when new packets pertaining to the call are received they are processed and added to the table(s).
Save Call
The Save Call feature enables the user to save a particular call as a separate HDL file. This is especially useful to get data from real-time traffic locations for detail analysis of a flawed call. By using this option, user can save the call that needs to be analyzed as a HDL file and transport it using temporary media to the lab for detailed analysis.
Play Audio and Write to File
The Play Audio extracts speech bits of each frame from the selected call and plays it to the PC speaker. in Mix, Stereo, or Separate mode Write to File writes the speech data to a file and use the files with voice quality analysis software to investigate more about the quality of voice in the network.
Triggers and Action Settings
Triggers and Action Settings allow the user to filter calls based on the triggers and actions criteria set for the completed calls. The filtered file can be saved in .hdl and all the voice files can be saved in .wav format (in Stereo or Mix mode) by checking "Save Call to HDL" and / or "Audio Recording" respectively. The file can be saved in .wav format or choose formatting options such as "Stereo", or "Mix".
Statistics and Inband Events (Only in Detail View)
The user can get the complete details of a single selected call. Details like Total TRAU packets, Codec Type, CRC Error Frame Count, and Bad Frames count are displayed. Inband Events display inband DTMF and MF (including MFR2-Forward and MFR2-Backward) digits as they are received with details such as Timestamp, Type, Event, On-Time, Power, Freq1 / Power1, Freq2 / Power2.
Wave Graph and Spectral Display (Only in Detail View)
The amplitude of the incoming signal in a selected call is displayed in real-time graphic form as a function of time. The data may be displayed in either linear or raw (compressed) format. Time Base in seconds can be set, so that that X axis scale is set according to the selected time base and the user can have a comprehensive view on the wave graph.
Spectral Display shows the power of incoming signal while the capturing is going on as a function of frequency. The power and frequency of the signal can be viewed with different sampling rates and functions. Readings of power and frequency of data that is flowing in both the directions can be viewed simultaneously in the spectral display. Also the user has a facility to observe the spectral graph of data flowing in only one direction.
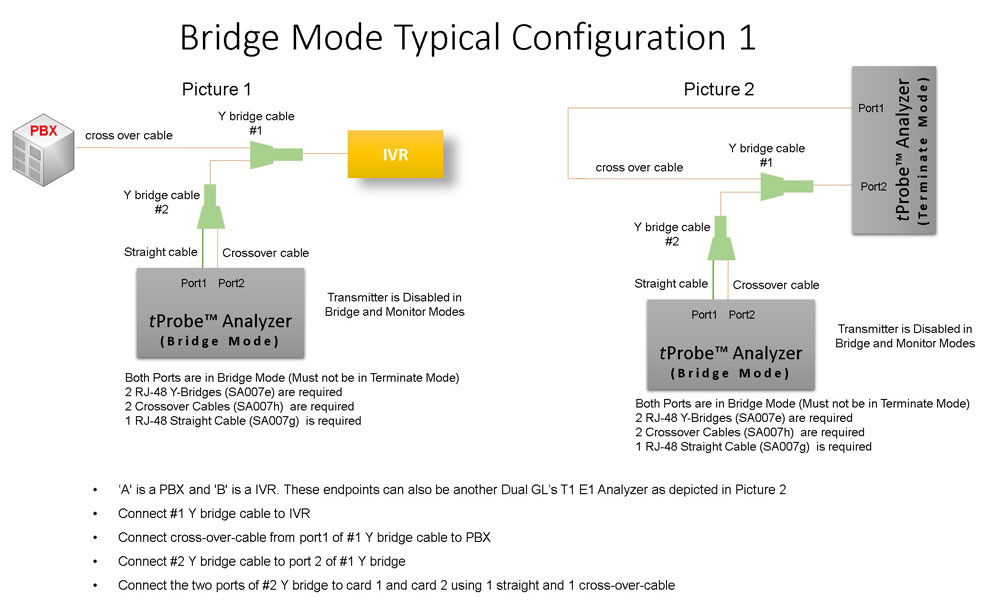
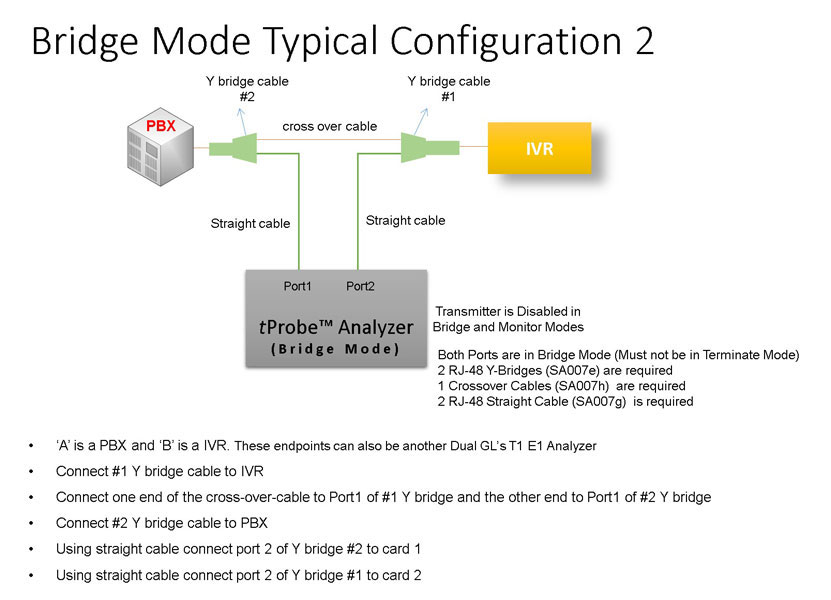
Bridge and Monitor Connections
- Monitor from a DSX-Patch Panel
- Bridge Mode Connections for Monitoring T1 E1 Signals for RJ-45
- Bridge Mode Connections Alternative Method
- RJ-45 Connections
Resources
Note: PCs which include GL hardware/software require Intel or AMD processors for compliance.
Please Note: The XX in the Item No. refers to the hardware platform, listed at the bottom of the Buyer's Guide, which the software will be running on. Therefore, XX can either be ETA or EEA (Octal/Quad Boards), PTA or PEA (tProbe Units), XUT or XUE (Dual PCIe Express) depending upon the hardware.
| Item No. | Item Description |
| XX153 |
T1 E1 Real-time TRAU Protocol Analyzer TRAU Traffic Playback TRAU Toolbox™ |
| OLV153 | Offline TRAU Analyzer |
| Other Related TRAU Applications | |
|---|---|
| XX646 | Multi-Channel TRAU Tx/Rx Emulation and Analysis |
| Related Software | |
| XX090 | HDLC Capture and Playback Software (T1 or E1) |
| XX150 | GSM Protocol Analyzer |
| XX155 | T1 or E1 Real-Time GPRS Protocol Analyzer |
| Related Hardware | |
| PTE001 | tProbe™ T1 E1 Base Unit |
| FTE001 | QuadXpress T1 E1 Main Board (Quad Port™ requires additional licenses) |
| ETE001 | OctalXpress T1 E1 Daughter Board (Octal Port™ requires additional licenses) |
| XTE001 | Dual T1 E1 Express (PCIe) Boards (requires additional licenses) |
| Brochures |
| T1 E1 trau protocol analysis emulation brochure |
| Sample Messages |
| Presentation |
| Product Presentation |
* Specifications and features subject to change without notice.
 Back to TRAU product Page