Newsletter: GL Announces Enhanced PacketScanWeb™ - Ver 2.9.1
(Real-Time Network Monitoring System for IP and VoIP Networks)
Welcome to another August, 2012 issue of GL Communications' newsletter providing information and insight into our enhanced PacketScanWeb™ software - A Centralized IP and VoIP network monitoring system.
Overview
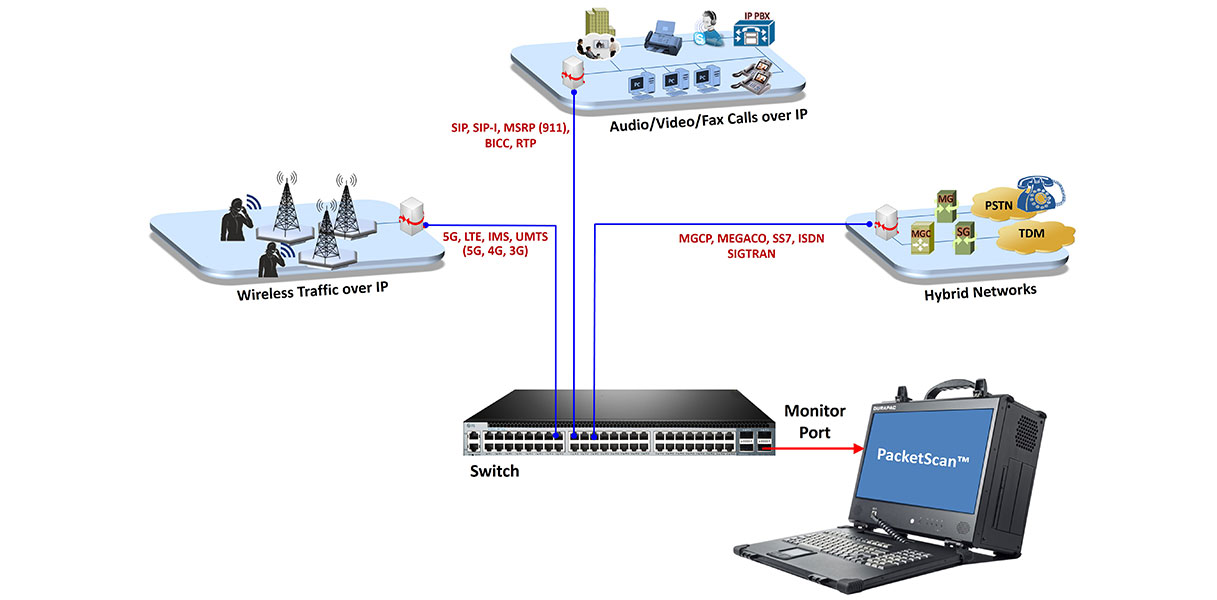
PacketScanWeb™ is a centralized IP and VoIP network monitoring system. PacketScanWeb™ server is deployed in a central location along with an Oracle® database. A number of GL's PacketScan™ probes and/or GL's PacketProbes™ are deployed in remote locations across the network to passively monitor VoIP traffic. Whenever a monitored call completes, the scan/probe calculates a variety of quality metrics (MOS, loss, delay, jitter, etc) and sends the metrics to the central Oracle database for storage. This data can then be accessed in real time from anywhere in the world through any standard web browser. In addition to viewing real time data, PacketScanWeb™ can also custom filter historical data and generate various reports and graphs that summarize overall network health.
Key Benefits of PacketScanWeb™
- Ability to identify and analyze network trends using Key Performance Indicators (KPI's)
- Automatically alert users when "Calls of Interest" occur
- Customized filtering for Fraud Detection, Quality of Service Monitoring, and Protocol Error Indications
- Flexible report generation
- Comprehensive analysis from overall network health to detailed protocol monitoring
PacketScan™ and PacketProbe™
PacketScan™ is a powerful software tool that captures and monitors live IP(version 4 and 6), VOIP and IP based Video traffic. It segregates, captures, monitors and collects statistics on VOIP calls:SIP, H323, MEGACO, MGCP, T.38 and video calls. In addition to calculating call quality metrics like MOS, R - Factor and so on, PacketScan™ also captures signaling information and sends that to the PacketScanWeb™ database. PacketProbes™ is a lightweight Linux based tool that only operates on SIP or raw RTP.
Important New Features for PacketScanWeb™
- Customize Filters: User can filter calls based on parameters such as MOS and R-Factor to learn the voice quality, and also can filter different VOIP calls based on Protocol Type:1 for SIP, 7 for H323 and 3 for RTP and other parameters like Called/Calling Number, Probe, Payload, Duration etc.
- Apply single or multiple filters for data analysis; use logical operators between filters
- Set alarm conditions and generate alerts of different types like email alert, visual alert, audible alert, or even log into tables for future analysis
- Ability to send email alerts on scheduled time based on user - defined alarm conditions
- Ability to customize column views with sorting capabilities for call detail records
- Navigate through records, and filter the collected traffic summary
- Easy navigation of records to display Previous or Next Hour, Day, Month, Year through navigation tool
- Reports are displayed both in tabular and graphical formats; customize reports and graphs based on SQL queries
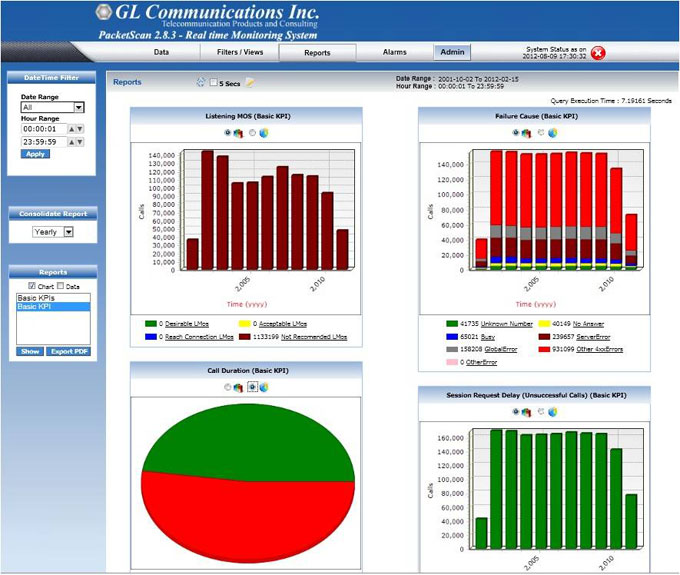
- Graphs provided for Answered calls Vs Failed calls, Call duration, MOS score (conversational and listening), Average Packet Loss, Call Failure Cause (i,e Unknown number, Busy, Unanswered, Client Errors, Server Errors, Global Errors), Session Request Delay (SRD) for successful and unsuccessful calls with an option to switch between Bar or Pie chart
- Ability to filter and view the records in CDR from graphical reports by just clicking on links provided
- Ability to export generated graphical and tabular reports to PDF file
- Export the call detail records - Ability to export CDR displayed based on time filter or record index as PDF
- Ability to generate consolidated report based on date/time filter viz., hourly, daily, monthly, yearly
PacketScanWeb™ Graphical User Interface (GUI)
KPI Reports
Standard reports can show network trends related to quality of service, call volumes, call durations and more. Users can configure customized reports to show virtually anything related to network trends and network quality of service.
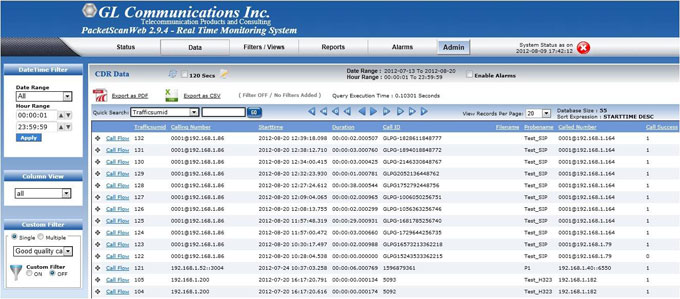
Call Detail Record (CDR) Display
The CDR Display provides visibility into each individual call. All KPI information is shown and each call can be investigated. Flexible filtering can help organize and identify "Calls of Interest".
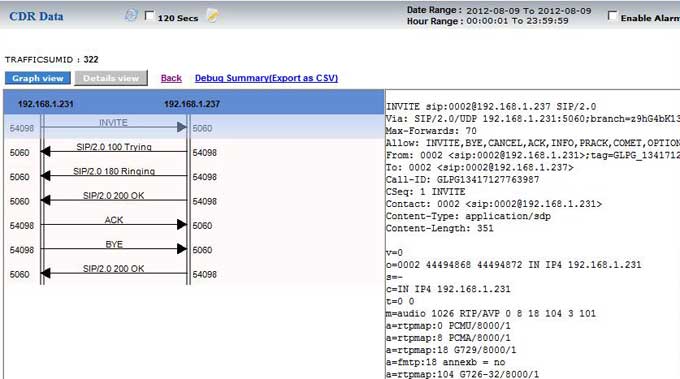
Call Flow View
For additional protocol related information, a Call Flow View is provided. A protocol ladder diagram and "plain English" message decode can assist users looking for the deepest of protocol related problems.
For comprehensive information on the product, please visit PacketScanWeb™ Webpage.
 Back to Newsletter Index Page