Digital T1/E1 Line Monitoring, Test, & Diagnostic System
NetSurveyorWeb™ for T1E1 Physical Layer
Brochure Request a Demo / Quote
Overview
GL's T1/E1 Network Monitoring System provides network wide management of T1 and E1 lines including line health, intrusive diagnostics, non-intrusive monitoring, and much more.
It's a web-based client connected to SS7 / ISDN / DCOSS / TDM probes through a web server that facilitates result display using a web interface.
Maintenance engineers can securely access the network view from literally "anywhere" that Internet access is available. They can also monitor, diagnose, and troubleshoot remotely with simple to use scripts.
- PC based T1 and E1 probes that collect physical and line level status and performance information. The Intrusive and Non-intrusive "probes" for TDM networks are deployed at strategic locations in a network. They can transmit and collect voice, data, protocol, statistics, and performance information. These probes can relay information to a central / distributed Network Management System (NMS).
- A "T1 E1 J1 Switch" for non-intrusive monitoring or intrusive diagnostics; The switch is "fail safe" during power disruptions and USB controlled by the PC that houses the probes.
- The NetSurveyorWeb™ for T1E1 Physical Layer provides an instant overall graphical view of the health of the TDM network with drill down to individual lines; secure access through WEB; remote monitoring and diagnostics to troubleshoot any T1 E1 line; and a central database and applications for controlling, collecting, and analyzing the information provided by the various probes.
For more details on other intrusive and non-intrusive TDM monitoring solutions, please visit - Network Monitoring Systems
Key Benefits - NetSurveyorWeb™ for T1E1 Physical Layer
- Monitoring T1/E1 line status remotely over web
Main Features
- Monitoring T1/E1 real-time and historic data remotely via browser based clients
- Reports are displayed both in tabular and graphical formats; customize reports and graphs based on SQL queries.
- Set alarm conditions and generate alerts of different types like email alert, visual alert, audible alert, or even log into tables for future analysis
- Filter call records based on various filter parameters such as Probe name, Call ID, Port#, Alarm Type, Alarm Condition, Alarm Count, Date and Time; allows the use of logical operators between parameters
Using NetSurveyorWeb™ for T1E1 Physical Layer
-
Using any browser-capable-device, you can access the results from anywhere in the world. When you point your browser to the Application Server URL, the following page will be displayed.
Status
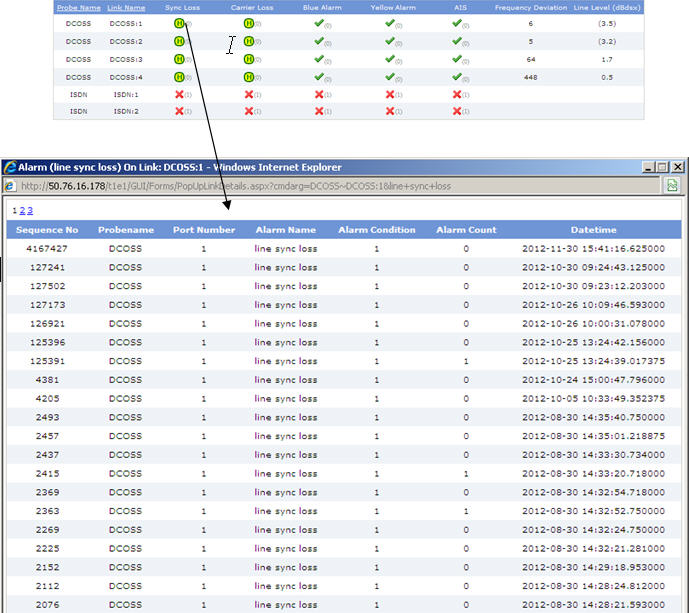
The LINK STATUS menu feature displays physical and data link status with Sync Loss, Carrier Loss and MTP layer status for all the available probes across the network.- The Historical icons
 indicate previous link errors of the probes which are rectified currently.
 - Sync Loss, Carrier Loss, Blue Alarm, Yellow Alarm, and AIS displays as a green check mark
 , on (1) is displayed as red-cross
  .
. - Click on the check mark or the cross mark to view the alarm log. The log provides details about the alarm type, alarm condition, port, timeslot, and the timestamp at which the alarm occurred.
- Each record can be expanded to obtain individual link information.
Link Name Configuration
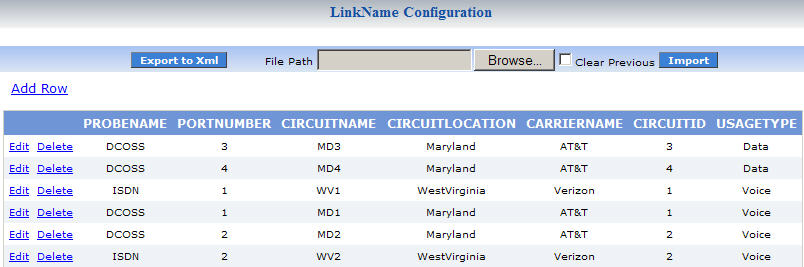
Monitors a set of pre-configured links as defined in a Link Configuration table. A link configuration table can be saved as an XML file and imported into NetSurveyorWeb™ for T1E1 Physical Layer – Real Time Monitoring System for any changes.
Navigation of Records
Allow easy navigation of records year-wise, monthly-wise, day-wise, or hourly basis. User can view the data of Previous Hour, Day, Month, and Year or the data of Next Hour, Day, Month, and Year through the navigation tool.
Quick Search
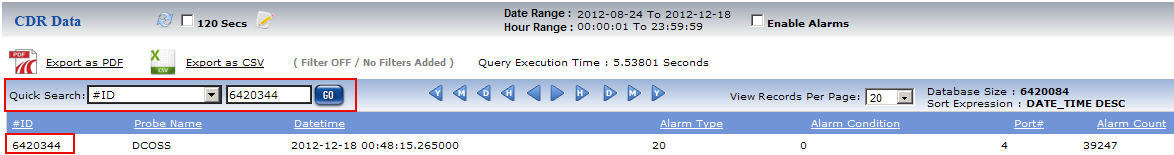
A particular call of interest can be searched using the Quick Search option.
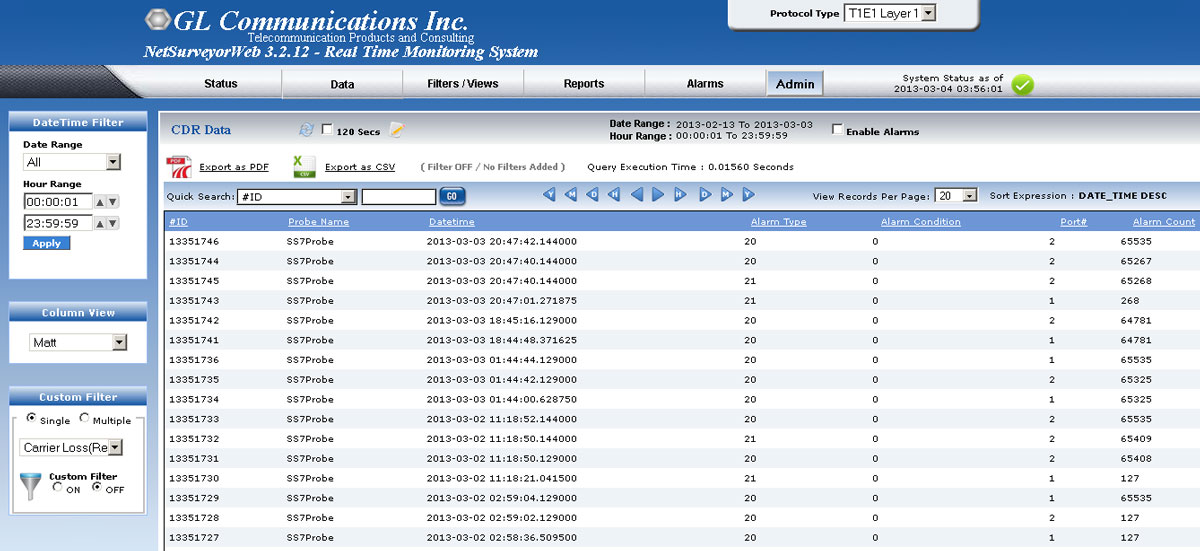
Data/Time Filter Data
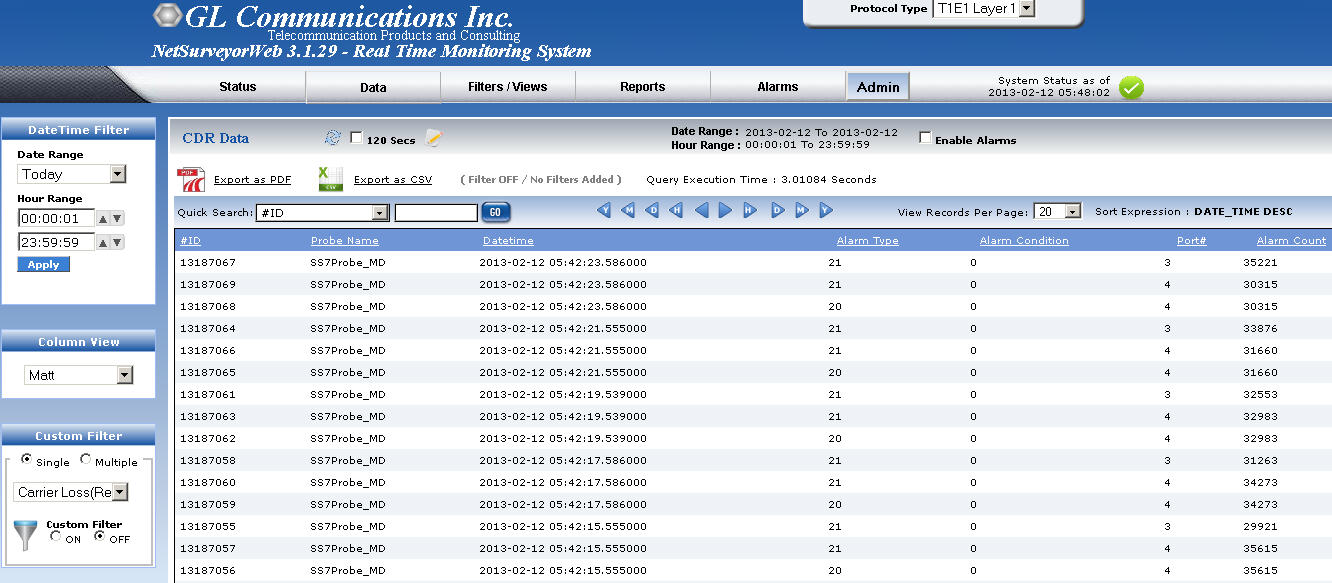
Call records can be filtered using Date/Time Filter criteria or any Custom Filter criteria.
User-defined Date/Time filter displays the call records based on Today, Yesterday, last 7 days, last 30 days and also custom date range. The Display All option displays all the available call records.
Custom Filter
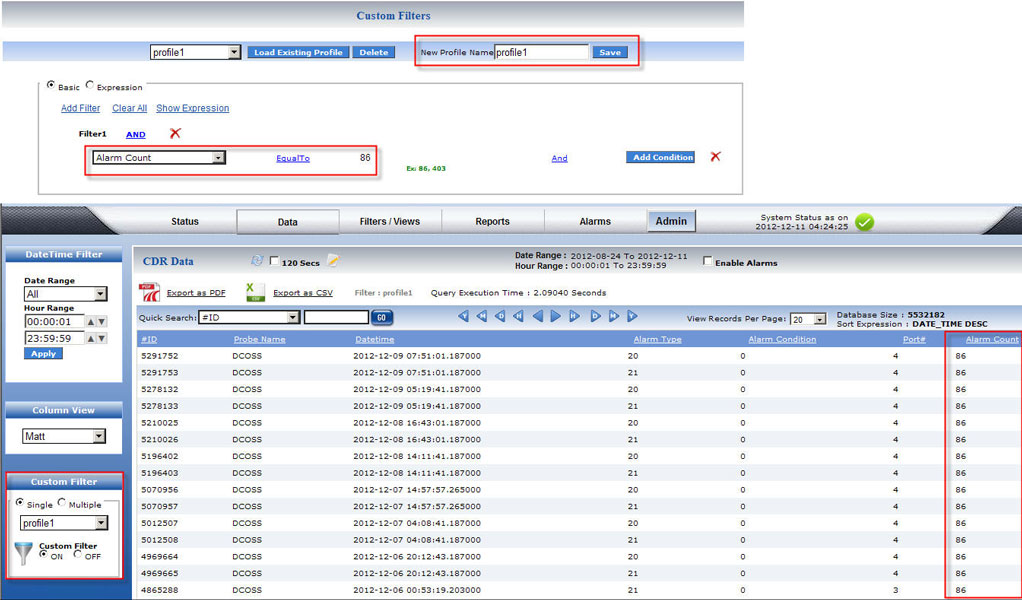
The User-Defined Filter tab provides options to
- Filter call records based on various filter parameters such as Probe name, Call ID, Port#, Alarm Type, Alarm Condition, Alarm Count, Date and Time.
- save, load / delete filter profiles
- edit & update already existing custom filter profiles
- apply one or more custom filters
- Apply logical operations between parameters of a filter or between multiple filters
Export Capabilities
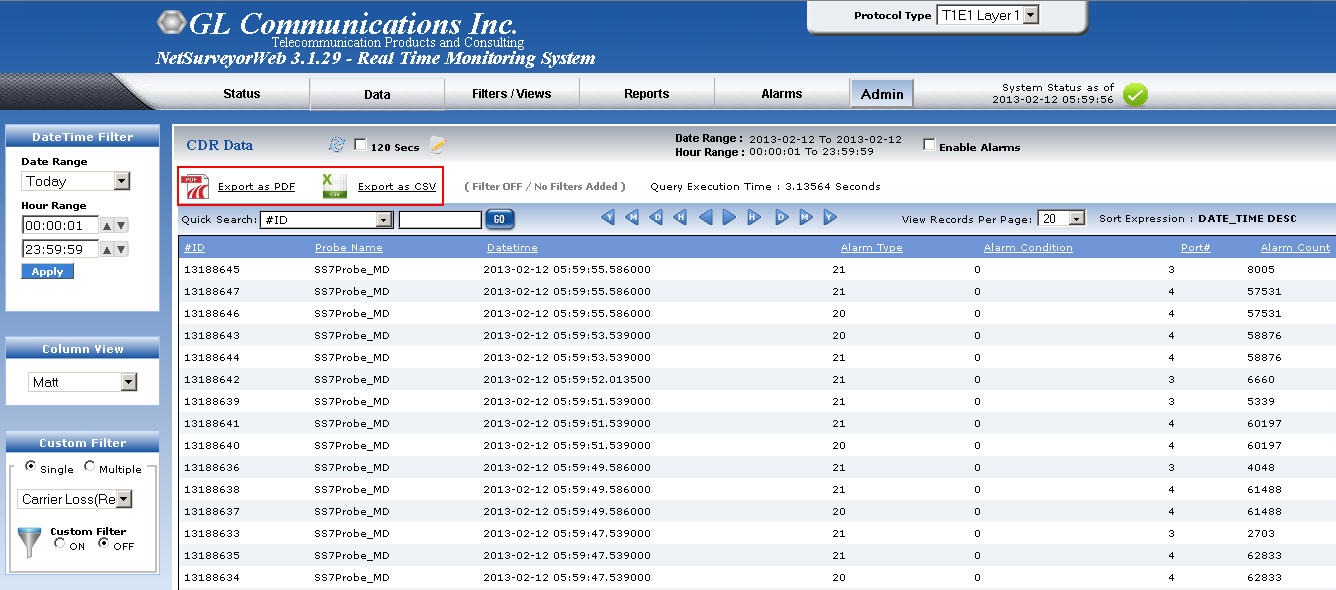
It can export data as PDF or CSV formats as required.
Alarm Generation
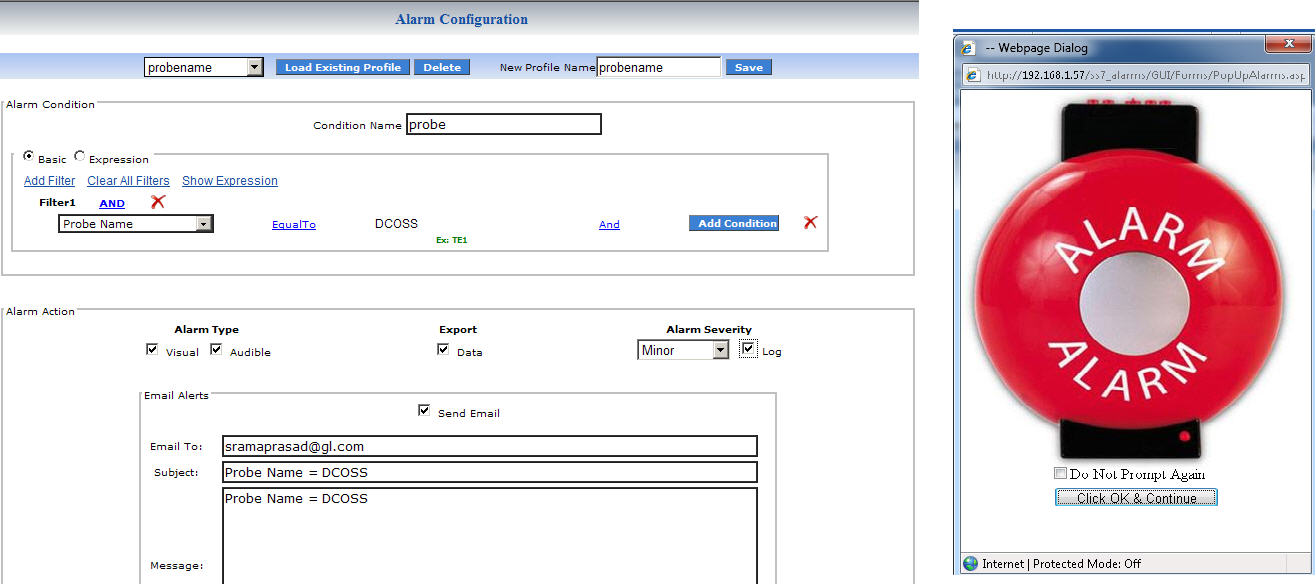
User can set the alarm by adding logical conditions; it has two sections, Alarm Condition and Alarm Actions. Alarm Condition provides the options to set the filter conditions for the alarm. Alarm action provides options to select Alarm Type, Exporting Data, Setting Alarm Severity to prompt the visible alarm or to beep the audible alarm, provides log file, and Email Alerts facility.
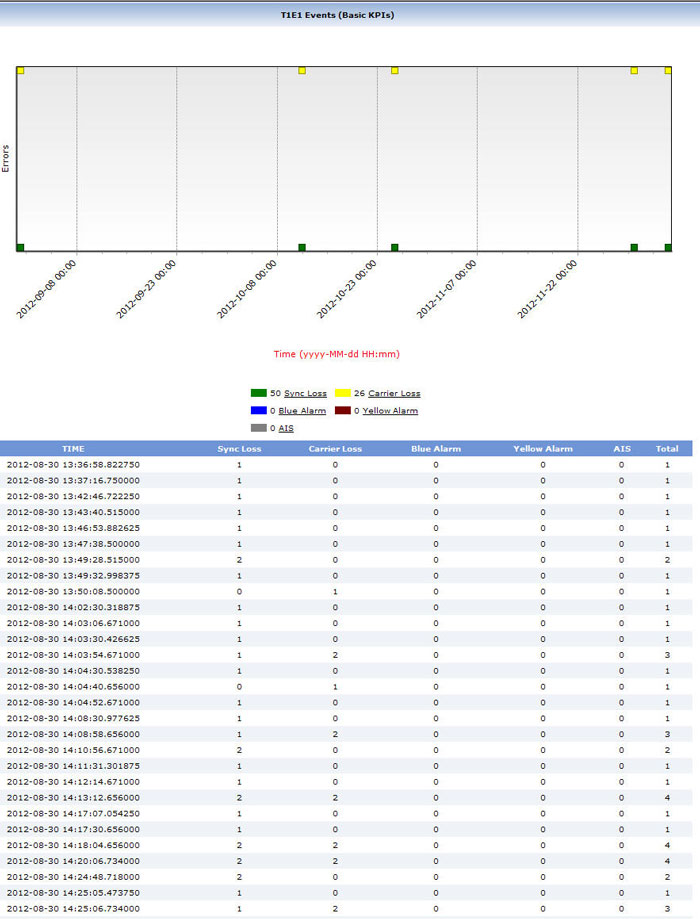
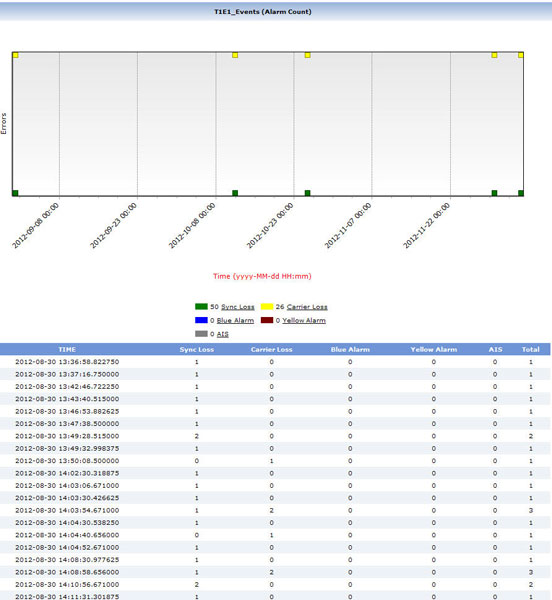
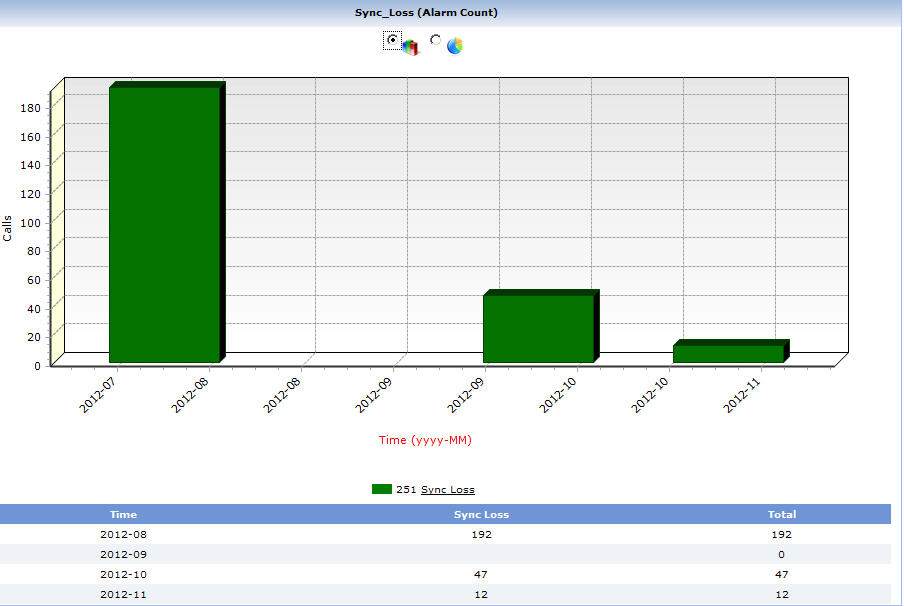
Graphs & Reports
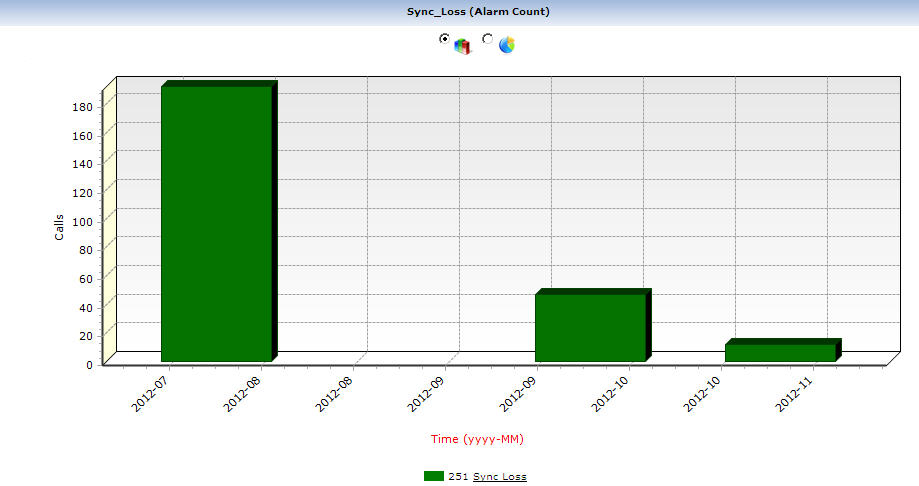
Reports view provides an overall summary of the captured packet traffic over the entire network with the help of useful graphs such as T1E1 Events and Alarm Count. Reports are also available in a tabular format for the plotted graph. The reports can be displayed for filtered data by using the Date/Time Filter options as discussed in the Filtered Data feature.
Report Configuration
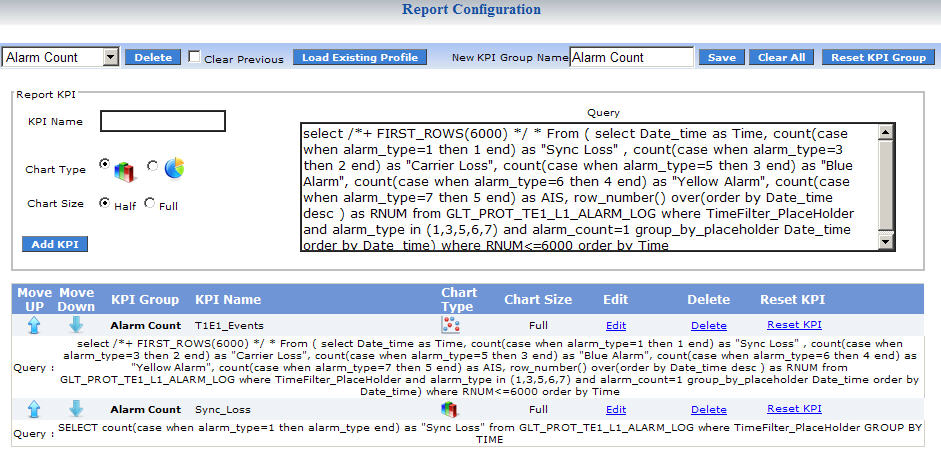
-
T1E1 Physical Layer allows users to add new KPIs and customize the reports using Report Configuration feature. User can generate customized reports and graphs based on SQL Queries.
Case Study -GL's NMS Deployment at the United States Postal Service (USPS)
USPS outlined a request to replace existing test equipment and stressed that consideration must be taken to make the transition to the new equipment as smooth as possible. A "plug and play" system, very comparable to the existing system was carefully designed.
GL's system for the USPS was designed to provide T1 and LAN testing and monitoring as illustrated in the figure above. The system comprised of intrusive and non-intrusive line monitoring solutions. Salient features include -
- TDM Monitoring Solution monitors 600 T1 lines and over 100 LANs monitored
- SS7 & ISDN Monitoring Solution monitors 52 T1 E1 ISDN & SS7 with Voiceband Traffic
- SS7 Monitoring Solution monitors 56 T1 SS7 - still growing
- Customizable views per site, per link, per problem
- Real-time and historical alarm displays
- Intrusive T1 BER testing using T1E1 Switch
- Quick T1 E1 J1 Switch hardware development
- Customized software at probe and Webserver locations
Related Screenshots
Resources
Please Note: The XX in the Item No. refers to the hardware platform, listed at the bottom of the Buyer's Guide, which the software will be running on. Therefore, XX can either be ETA or EEA (Octal/Quad Boards), PTA or PEA (tProbe Units), XUT or XUE (Dual PCIe Express) depending upon the hardware.
| Item No. | Item Description |
| PKV170 | T1E1 Network Surveillance Software with Centralized Database Engine and Client |
| VBA032 | Near Real-time Voice-band Analyzer |
| XX120 | T1 or E1 Real-Time SS7 Protocol Analyzer |
| XX100 | T1 or E1 Real-Time ISDN Protocol Analyzer |
| VQT010 | VQuad™ (Automated File Transceiver Base Software) |
| Related Hardware | |
|---|---|
FTE001 |
QuadXpress T1E1 Main Board (Quad Port– requires additional licenses) |
| ETE001 | OctalXpress T1E1 Main Board plus Daughter Board (Octal Port– requires additional licenses) |
| PTE001 | tProbe™ T1 E1 VF Serial Data FXO FXS Analyzer Units |
| XTE001 |
Dual T1 E1 Express (PCIe) Boards (requires additional licenses) |
* Specifications are subject to change without notice.
 Back to Network Test, Monitoring, & Surveillance Solutions Index Page