Frame Relay Protocol Analyzer
Overview
Frame Relay is commonly used data link protocol based on packet switching technology. It is mainly incorporated by the corporate data networks due to its cost-effective data transmission, and flexible bandwidth. Frame relay is mostly used to connect local area networks with major backbones; also used in public wide area networks and in private network environments with leased lines over T1 E1 lines.
Frame Relay access is usually at data rates range of 56 to 2Mbps. Low bit-rate voice compression algorithms such as ITU G.723.1 and G.729A permit the greatest number of simultaneous multiple calls while maintaining high quality voice. The data packets in Frame Relay are relayed as HDLC frames at the data link layer of the Open Systems Interconnection (OSI) model.
GL's Frame Relay Protocol Analyzer can be used to analyze and decode frames conforming to Q.921, Q.922, LAPF, Frame Relay Forum standard -FRF.9 and FRF.12, Multiple Protocol Encapsulation, LCP RFC1661, Q.933 SVC and LMI SNAP, PPP, IP, SMTP, POP3 and so on.
GL Communications supports the following types of Frame Relay analyzers:
- Real-time Frame Relay Analyzer (Pre-requisites: GL's field proven E1 or T1 internal cards or USB Laptop E1 or T1 external units, required licenses and Windows Operating System)
- Remote/Offline Frame Relay Analyzer (Pre-requisites: Hardware Dongle, and Windows Operating System)
In addition the following application is supported that further helps in emulating Frame Relay protocol:
Frame Relay Analyzer Main Features
- Supports decoding of encapsulated protocols, and long frames up to 16 Kbytes.
- Analyze Permanent Virtual Connection (PVC) and Switched Virtual Connection (SVC) frames.
- Supports filtering and search based on LAPF parameters and Q.933 layer parameters such as DLCIs, Message Type, FECN, BECN, DE, NLPID's TCP, IP, SMTP, POP3, and so on.
- Displays Summary, Detail, Hex-dump, Statistics, and Call Trace Views, the contents of this view can also be copied to clipboard.
- Summary View displays LAPF information like DLCI, FECN, BECN, Q.933 Message Type, IP address, TCP/UDP port address, and etc in a tabular format.
- Detail View decodes of user selected frame from the Summary View.
- Statistics View displays statistics based on frame count, byte count, frames/sec, bytes/sec etc for the entire capture data.
- Hex dump view displays raw frame data as hexadecimal and ASCII octet dump, the contents of this view can also be copied to clipboard.
- Call Detail View displays called/ calling number, released calls, call status, & more.
- Call Detail Recording feature includes data link groups that help in defining the direction of the calls in a given network and form logical groups comprised of unidirectional (either 'Forward' or 'Backward') data links.
- Capability to export Summary View details to a comma separated values (CSV) format for subsequent import into a database or spreadsheet.
- Capability to export detail decodes information to an ASCII file.
- Any protocol field can be added to the summary view, filtering, and search features providing users more flexibility to monitor required protocol fields.
- Remote monitoring capability using GL's Network Surveillance System.
- Option to create multiple aggregate column groups and prioritize the groups as per the requirement to display the summary results efficiently
- Allows the user to create search/filter criteria automatically from the current screen selection
Additional features supported by Real-time/Remote Frame Relay Analyzer are
- Supports capturing of encapsulated protocols, and long frames up to 16 Kbytes.
- Streams can be captured on the selected time slots (contiguous or non-contiguous), sub-channels or full bandwidth. Frames may also be contained in either one, n x 64 kbps, or n x 56 kbps data channels.
- The following variations are accommodated in the software: inverted or non-inverted data, byte reversal or non-reversal.
- Supports decoding of FRF.12 fragment with both UNI-NNI fragmentation and End-to-End fragmentation.
- Supports decoding of frames with FCS of 16 bits and 32 bits, or none
- Recorded trace files can be played back using HDLC Playback application
- Multiple streams of traffic on various T1 E1 channels can be simultaneously decoded with different GUI instances
- Multiple remote clients may access a single T1 E1 server, Also, the T1 E1 server is fully functional while being accessed as a server. Thus, a user may perform T1 E1 operations locally on the server while a remote client is accessing the same server in real time. (For Remote Analyzers only).
Additional features supported by Offline Frame Relay Analyzer:
- Trace files for analysis can be loaded through simple command-line arguments.
- Multiple trace files can be loaded simultaneously with different GUI instances for offline analysis.
Supported Protocols
The supported protocol standards in Frame Relay protocol analyzer is LAPF.
| Supported Protocols | Specification Used |
|---|---|
| LAPF | ITU-T Q.922 |
| IP | RFC 791 |
| TCP | RFC 793 |
| UDP | RFC 768 |
| SMTP | RFC 2821 |
| POP3 | RFC 1939 |
| STUN | RFC 3489 |
| FTP | RFC 959 |
| SNMP | RFC 1157,1155,1902,3416,2863,2578,3418,2011,2012 etc |
| DNS | RFC 1035 |
| DHCP | RFC 1533, 2131 |
| HTTP | RFC 2616 |
| RIP | RFC 2453 |
| NBNS (NetBIOS Name Service) | RFC 1002 |
| IPMReg (IPv4 Registration Message) | RFC 3220 |
| Q933FRel | Q.933 |
| SNAP | RFC 1042 |
| PPP over Frame Relay | RFC 1661 |
| FRF.12, FRF12.1, FRF.15 | FRF.12, FRF12.1, FRF.15 |
| LCP | RFC 1661 |
| Multi-Protocol Encapsulation | ETSI EN -301-192 |
| SVC Signaling | - |
| LMI Signaling | - |
For more information, visit protocol glossary webpage
Summary, Detail and Hex dump View
The Frame Relay analyzer application is invoked from the main menu of GL's T1 E1 Analyzer for real-time analyzer. The remote/offline Frame Relay analyzer is invoked from the installation directory of the Remote Frame Relay Analyzer. The analyzer displays Summary, Detail, and Hex dump Views in different panes. The Summary pane displays Frame Number, Time, Length, Error, DLCI, DE, BECN, FECN, CTL, NLPID and more. To analyze in detail, user can select a frame in Summary View to analyze and decode in the Detail View. The Hex dump View displays the frame information in HEX and ASCII format.
Real-time/Remote and Offline Analysis
Users can capture and analyze Frame Relay frames using either real-time or remote analyzers. All or filtered traffic can be recorded into a trace file. The Frame Relay analyzer supports reassembly and decoding of multiple MFR bundles simultaneously. Each MFR bundle will reassemble packets from Frame Relay links.
Real-time capturing requires user to specify timeslots, bit inversion, octet bit reversion, hyper channel selection, data transmission rate, CRC, and MFR options (maximum differential delay). The recorded trace file can be used for offline analysis or exported to a comma-delimited file, or ASCII file. Recorded trace file can be played back on T1 E1 using the HDLC Playback application.
Filtering and Search
User can record all or filtered traffic into a trace file and can create search/filter criteria automatically from the current screen selection. The filter and search options add a powerful dimension to the CAS analyzer that isolates required frames from the captured frames in real-time/remote/offline. Users can specify custom values for frame length to filter frames during real-time capture. The frames can also be filtered after completion of capture according to Frame Number, Time, Length, Error, DLCI, DE, BECN, FECN, CTL, NLPID and more. Similarly, Search capability helps user to search for a particular frame based on specific search criteria
Aggregate Column Group
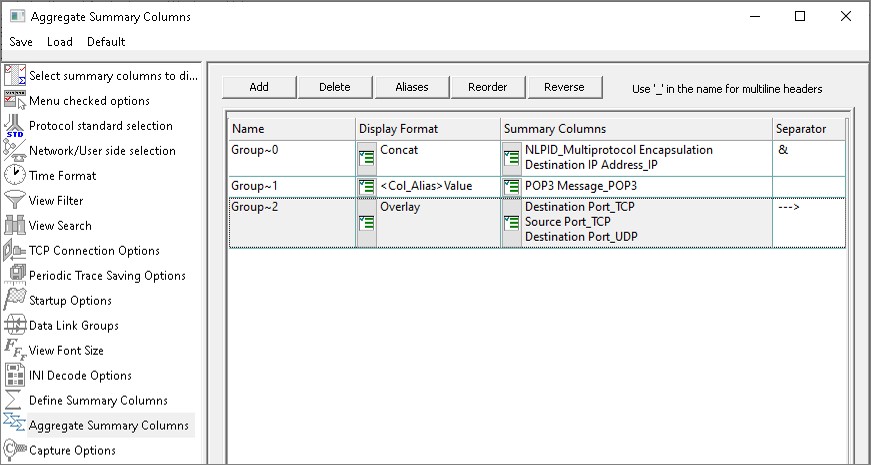
Aggregate Summary Column Group
The enhanced feature of the protocol analyzer is aggregate column groups. The user can also create multiple aggregate column groups and prioritize the groups as per the requirement to display the summary results in an efficient way.
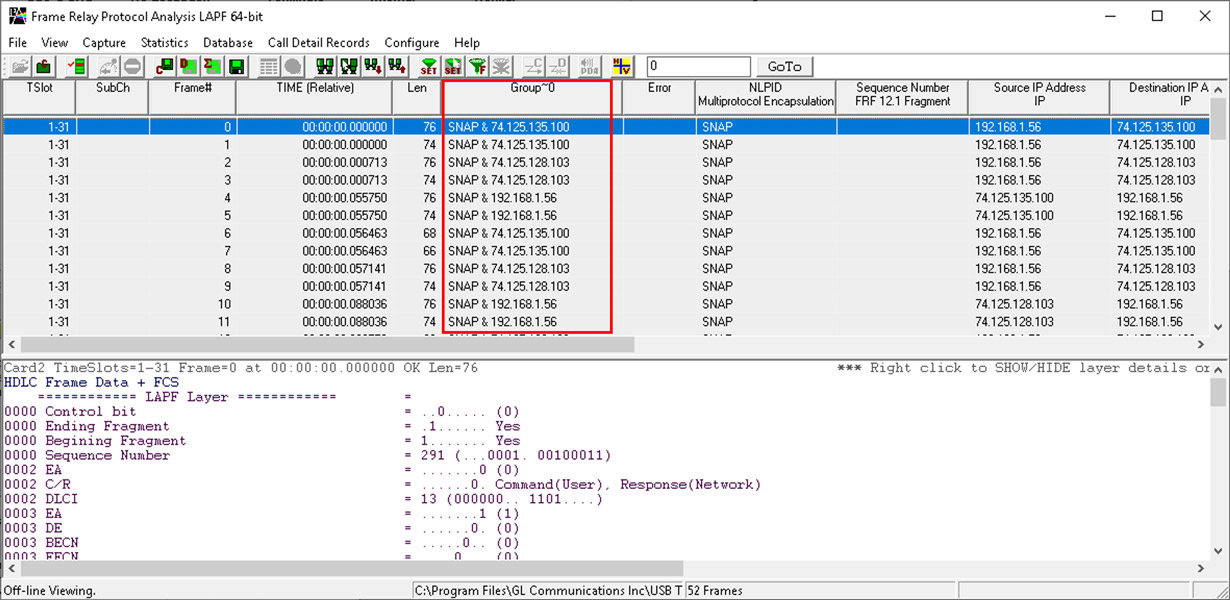
Display of Aggregate Column Group in Summary View
The updated results are as shown below. Here the root aggregate group~0 summary columns are displayed first and then Group~1 and Group~2 as per the assigned priority.
Call Detail Record and Statistics View
Important call specific parameters like Call ID, Call Status, Call duration, Called/Calling Number, CRV, Release Cause are displayed in Call Detail Record View. Call traces can also be logically grouped with each group comprised of unidirectional (either 'Forward' or 'Backward') data links. Additionally, users are provided with the option to search a particular call detail record from the captured traces.
Statistics is an important feature available in Frame Relay analyzer and can be obtained for all frames both in real-time as well as offline mode. Numerous statistics can be obtained to study the performance and trend in the Frame Relay network based on protocol fields and different parameters.
Enhanced Trace Saving Options
Users can control the captured trace files by saving the trace using different conventions such as trace files with user-defined prefixes, trace file with date-time prefixes, and slider control to indicate the total number of files, file size, frame count, or time limit. This feature also allows the captured frames to be saved into a trace file based on the filtering criteria set using display filter feature.
Save/Load All Configuration Settings
Protocol Configuration window provides a consolidated interface for all the important settings required in the analyzer. This includes various options such as protocol selection, startup options, stream/interface selection, filter/search criteria and so on. Any protocol field can be added to the summary view, filtering, and search features from this GUI providing the users more flexibility to monitor required protocol fields. All the configuration settings done in any of these options can be saved to a file, loaded from a configuration file, or user may just revert to the default values using the default option.
Frame Relay Emulation using Client-Server
Automated testing of FR and MFR can be accomplished using client-server based Multi-link Frame Relay Emulation module. The MFR Emulation module is an optional application that displays the command syntax, sends and receives FR and MFR frames with or without impairments. For more details, visit Multi-link Frame Relay Emulator webpage.
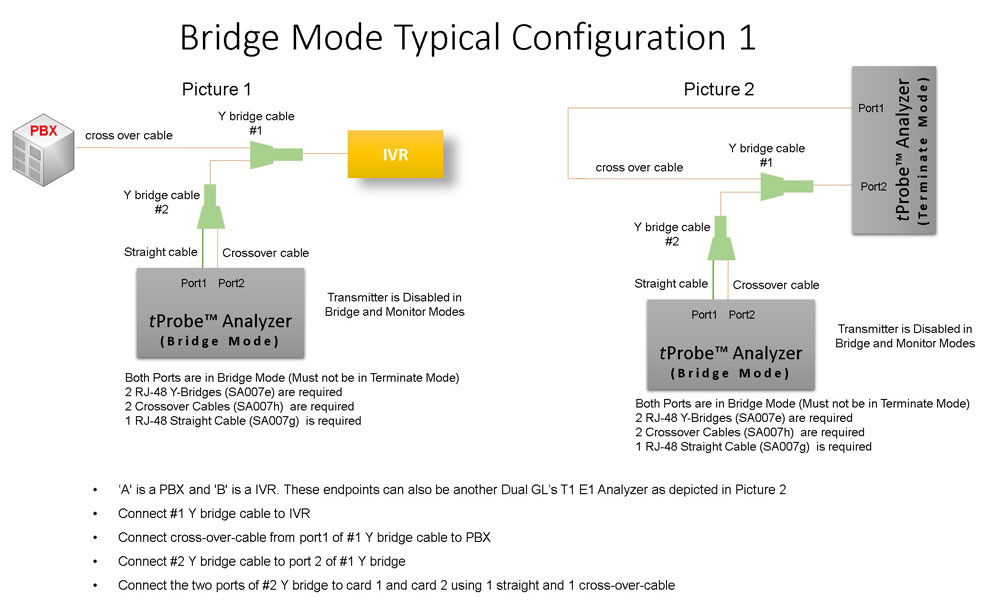
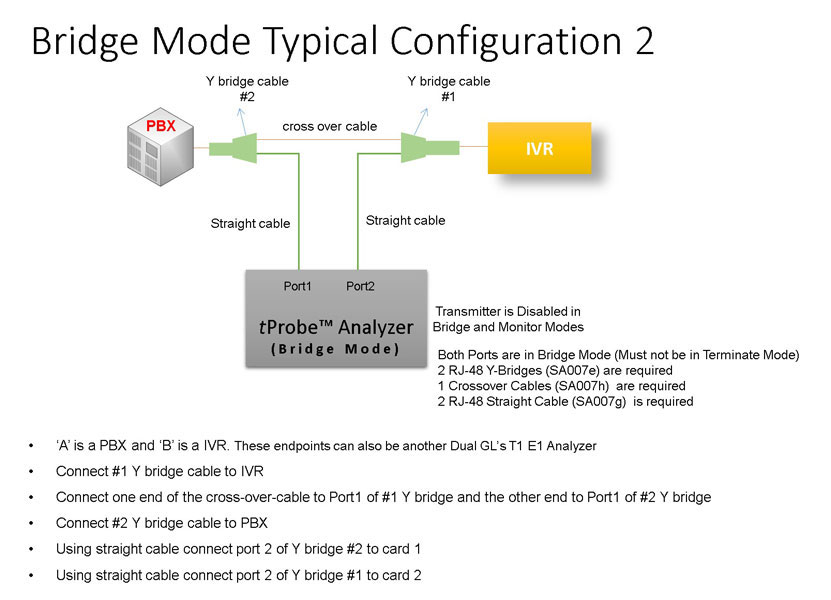
Bridge and Monitor Connections
- Monitor from a DSX-Patch Panel
- Bridge Mode Connections for Monitoring T1 E1 Signals for RJ-45
- Bridge Mode Connections Alternative Method
- RJ-45 Connections
Resources
Note: PCs which include GL hardware/software require Intel or AMD processors for compliance.
Please Note: The XX in the Item No. refers to the hardware platform, listed at the bottom of the Buyer's Guide, which the software will be running on. Therefore, XX can either be ETA or EEA (Octal/Quad Boards), PTA or PEA (tProbe Units), XUT or XUE (Dual PCIe Express) depending upon the hardware.
Specifications are subject to change without notice.
 Back to Protocol Analysis Index Page