WebViewer™
(Web Based Client for Voice and Data Quality Testing)
Latest Software
- WebViewer™ (ORACLE & MySQL) Ver 7.0
- VQuad™ Software Ver 11.4.4
- Voice Analysis Tool (VAT™) Ver 1.2
- VQT Software Ver 8.3
- AutoVQT™ Software Ver 2.3
Request a Demo / Quote
Brochures
Overview
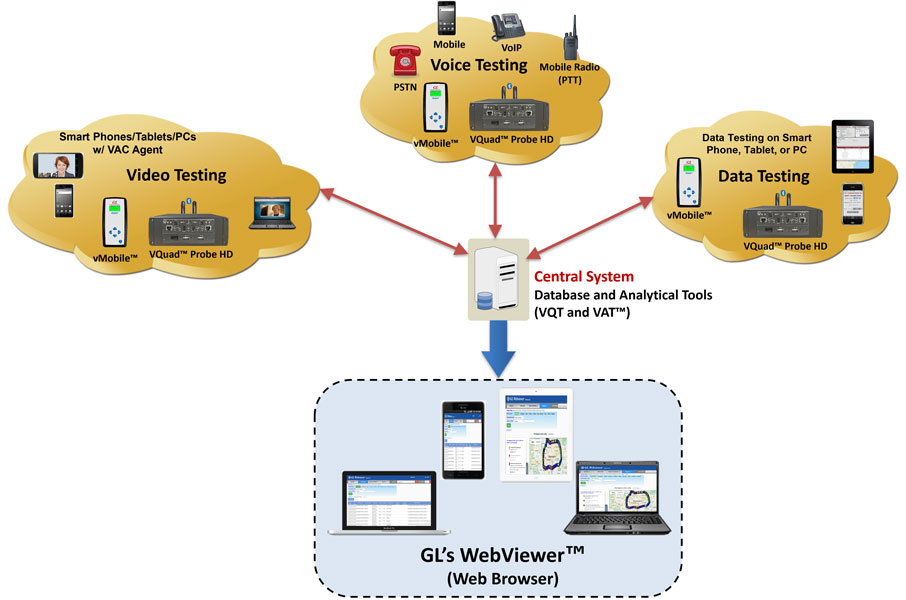
GL's WebViewer™ provides the method to display and access, in real time, the entire vMobile™/VQuad™/VQT network including all individual vMobile™/VQuad™ probes as well as the central location. Current status of the entire test is displayed along with customized user statistics and results of the active tests. The WebViewer™ uses a simple web browser with facilities to query the results either manually or automatically as well as output the results/statistics. These results include vMobile™ and VQuad™ Call Events, Status. User Defined Events, Bluetooth® Events, Data Test (NetTest from PC and NetTest from Mobile Device), VQT, VBA, Delay and Echo Measurement results and Fax TxRx Events which can be saved to either PDF or Excel format. WebViewer™ includes support for user-defined statistics with both tabular and graphical outputs.
The WebViewer™ browser can also provide real-time status of the entire vMobile™/VQuad™/VQT network as well as remote accessibility of any node associated with the network. Transfer configuration files between the VQuad™ nodes and your local system for enhancements. Automatically send the updated configuration back to the VQuad™ system (or all VQuad™ systems). Rerun the test using the enhanced VQuad™ configuration, all from the WebViewer™ browser running on either Windows® based or Mac based systems.
Furthermore, WebViewer™ offers enhanced customization options for report generation, including result statistics, tabular data, bar graphs, and line graphs. The Report Scheduler feature allows users to schedule reports at specified intervals with user-specified filters, streamlining the reporting process and providing valuable insights into network performance.
GL’s VQuad™ provides automatic call control over several networks and supports transmit/capture of voice files in real-time from the various nodes. The degraded (recorded) voice files are automatically transferred to the Central Location where GL's VQT analyzes and generates the results using POLQA (ITU-T P.863), PESQ (ITU-T P.862) test methods. Additional analytical metrics are also provided as a result of the VQT algorithm including jitter, clipping, and level measurements.
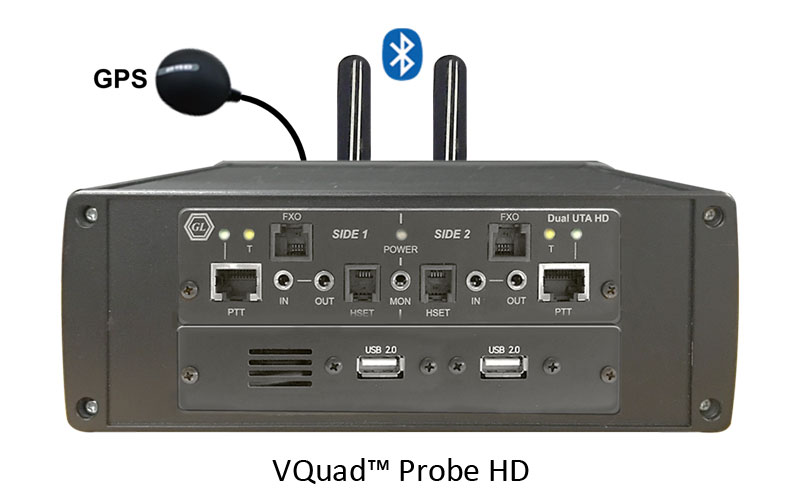
GL's new VQuad™ Probe HD is an all-in-one self-contained VQuad™ with Dual UTA HD test instrument. This comprehensive hardware device incorporates all the features of the current VQuad™ with Dual UTA HD unit such as portability and remote accessibility along with the necessary PC hardware with Win7 OS. The VQuad™ probe HD can be controlled via Ethernet Remote Desktop (with support for mouse/keyboard) and is of same length as the current Dual UTA HD hardware, but about twice as high and 50% wider.
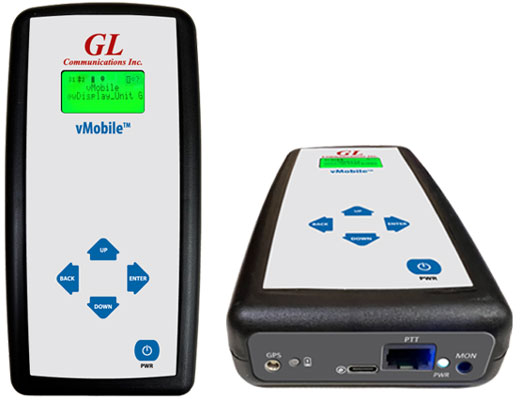
The vMobile™ - Portable VQT Test Solution is a handheld device which can support full audio testing for mobile phones and mobile radios, as well as providing data testing for mobile phones. The vMobile™ can be hand-carried for walk and drive testing (includes GPS) as well as left in labs and can work directly with GL’s VQuad™ solution for very flexible end-to-end testing. All functionality and configuration of the vMobile™ is accessed using the remote web-based Console or Console App which is installed on any Android or iOS device.
GL's Voice Analysis Tool (VAT™) application is used to analyze the audio content within any PCM audio files and generates a variety of audio metrics. VAT™ has a user-friendly interface to perform manual and automated analysis of multiple tests using a single PCM audio file received from the VQuad™, vMobile™, or any other applications.
GL's Voice Quality Testing (VQT) software utilizes various ITU standard algorithms, including Perceptual Objective Listening Quality Assessment (POLQA) version 2.4 and optional upgrade version 3 (ITU-T P.863), Perceptual Evaluation of Speech Quality (PESQ ITU-T P.862), PESQ LQ/LQO (P.862.1), and PESQ WB (P.862.2) to support next-generation voice quality testing standards for fixed, mobile, and IP-based networks. The software evaluates voice quality across multiple parameters by analyzing received (degraded) files and comparing them with sent (reference) files using both manual and automated methods.
GL also offers an advanced, automated solution AutoVQT™ that evaluates thousands of voice files in mere minutes, utilizing the industry benchmark algorithm POLQA (ITU-T P.863 version 2.4) to evaluate voice quality across various applications, including VoIP, Mobile, and PSTN networks.
Both VQT and AutoVQT™ applications work in conjunction with GL's VQuad™, vMobile™, Voice Analysis Tool (VAT™) Message Automation and Protocol Simulation (MAPS™), or T1/E1 Analysis platforms, increasing efficiency and reducing analysis time. Users can access all associated results through the GL WebViewer™ central database via any web browser providing a comprehensive solution for measuring, analyzing, and optimizing voice quality across a range of networks and applications.

Live Demo
WebViewer™
This is a live demo of GL's WebViewer™ system. Using this demo, you can watch (in real-time) the quality of voice files being probed and captured from various network nodes.
Features
Nodes Management |
|
Platform |
|
Database |
|
Results |
|
Statistics and Network Status |
|
Reports |
|
Filters |
|
Components of GL's WebViewer™ Solution
Components of WebViewer™ Solution
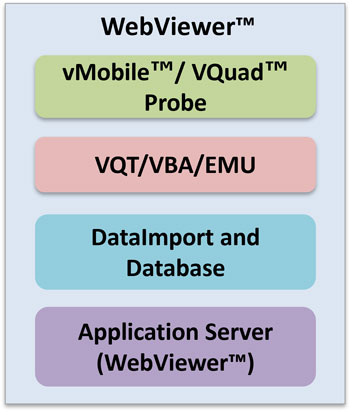
GL's WebViewer™ solution is a four tier architecture. The first layer consists of GL's vMobile™/VQuad™ which establishes the proper calls or direct connections between the near and far end using a variety of physical interfaces. The File Monitor transfers the degraded (recorded) voice files from the individual vMobile™/VQuad™ nodes to one of several VQT/VBA/EMU systems which are located on the second layer. Each VQT/VBA/EMU applications automatically analyze the degraded voice file and transmit the analytical results to a single central database located at the Data Layer. This third layer provides a means for storing the captured results. The last layer is the Data Access Layer (Application Server) where the data presentation logic is contained.
Data Layer
An Oracle or MySQL database (user specified) is used to store the analytical measurement results along with all pertinent data associated with the vMobile™/VQuad™/VQT/VBA/EMU/Data/Video Test systems (Call progress events, error events, timestamps, Call ID, location information, Echo Measurements, Data Test Results, Video Test Results, Fax Events, VQT PESQ and POLQA Events). This provides a very flexible and expandable architecture for data storage and data access. The database is accessed in real-time over the web using the WebViewer™.
The DataImport application is co-hosted with the database server running on the Data Layer. It collects the data posted by the probes and then updates the database using the collected data.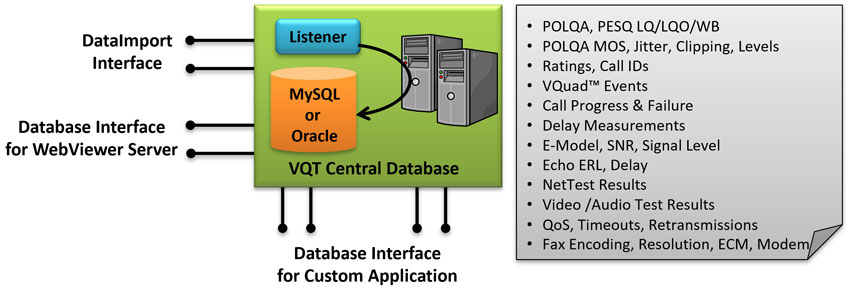
Data Layer of the WebViewer™ Solution
Application Server
The WebViewer™ provides an application server for accessing the vMobile™/VQuad™ Call progress events, user-defined error events, delay measurement results, Data Test results, Video Test results, Echo Measurement results, Fax Events and VQT PESQ/ VQT POLQA/VBA E-Model LQ/LQO/WB MOS measurements along with the additional analytical measurements including Call ID information. The results are queried over the internet using any browser-capable device such as desktops, table PCs MAC systems (Mac, iPhone, iPad) or PDAs. The application server is capable of serving the data in real-time or providing historic data based on customer selected filters.
Application layer of the WebViewer™ Solution
Using Application Server
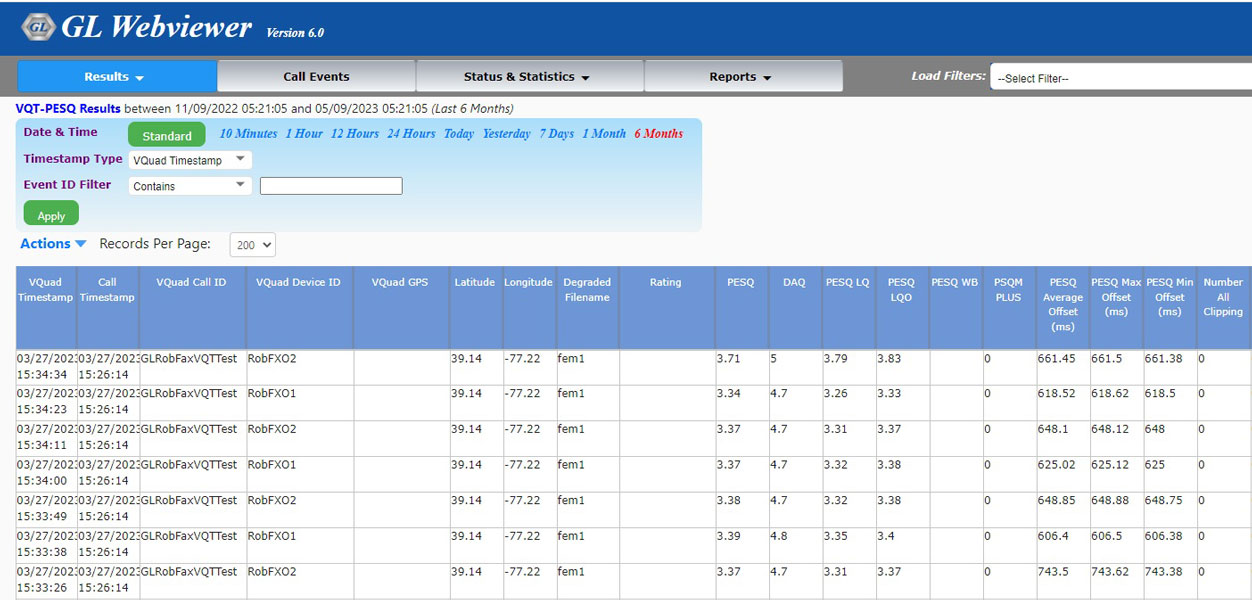
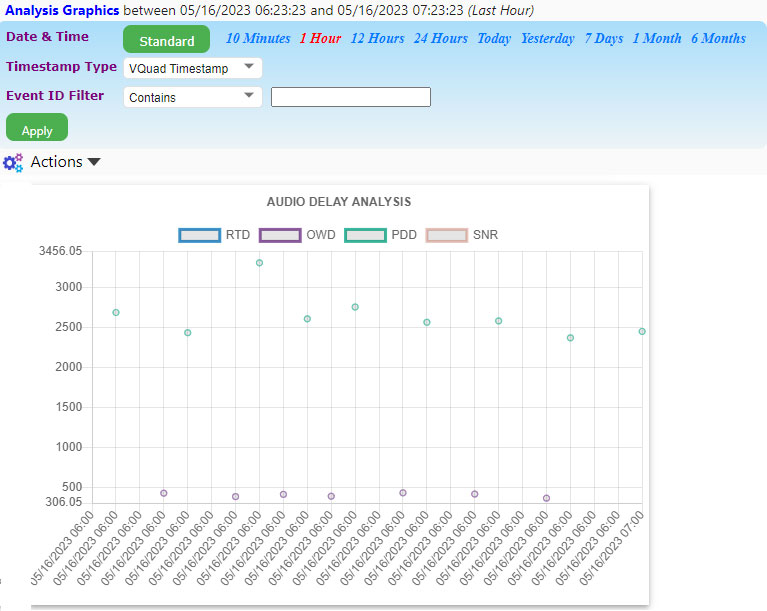
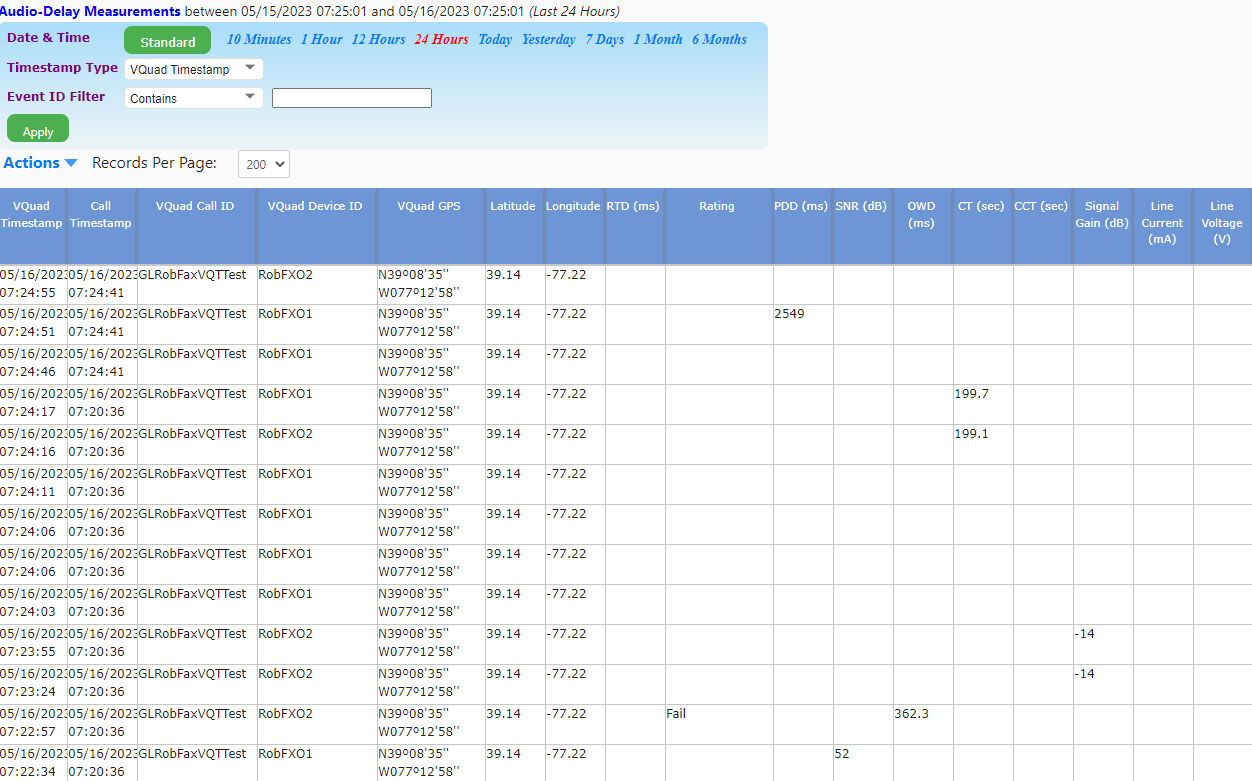
Using any browser-capable-device, you can access all network results from anywhere in the world. When you open the WebViewer™, the following page will be displayed. The WebViewer™ browser can display the VQT PESQ results and ratings, VQT POLQA Events, VBA results including E-Model and ratings, VQuad™ Delay Measurement results (RTD, OWD, SNR, PDD), Echo Measurement results, Data Test results (TCP, UDP, VoIP, Route, HTTP, FTP, DNS, SMS, Email, PhoneInfo, SimInfo, and UEInfo), Fax Events and VQuad™ Call Control events including call failures and error events.
WebViewer™ Main Screen
Network Status with Remote Operation
Network Status view gives the real-time status of all the vMobile™, VQuad™ nodes, connected Mobile Devices, VQT, File Monitor applications, and the Command Center applications in the network. The various options are available for the users to manually operate and control the systems remotely and start the applications on a selected node, load the test scripts, execute the scripts, and also to stop and exit from the applications remotely.
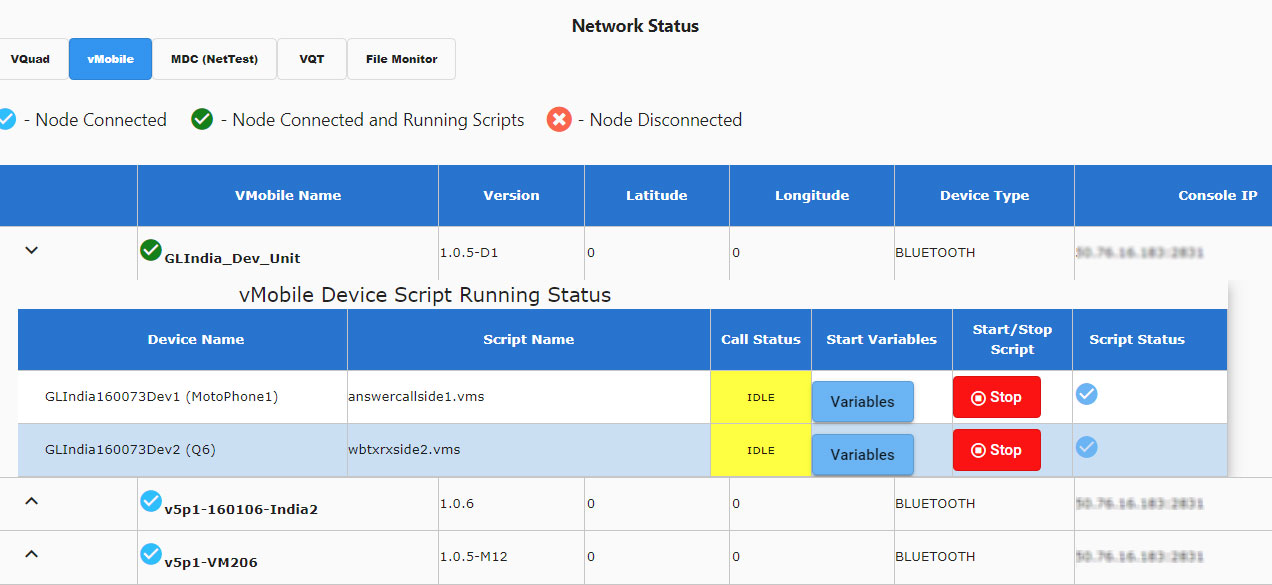
vMobile™ Network Status
vMobile™ Network Status
vMobile™ Network Status screen displays the vMobile™ and device Script Status. vMobile™ node parameters include Node Name, GPS co-ordinates (retrieved automatically from GPS receiver or can be user defined, to be displayed in WebViewer™ Google Maps), Device Type, Console IP Address, Listener IP Address. Editable vMobile™ node parameters include Script loading, Start Variables, Start and Stop script, and also displays the Script Status.
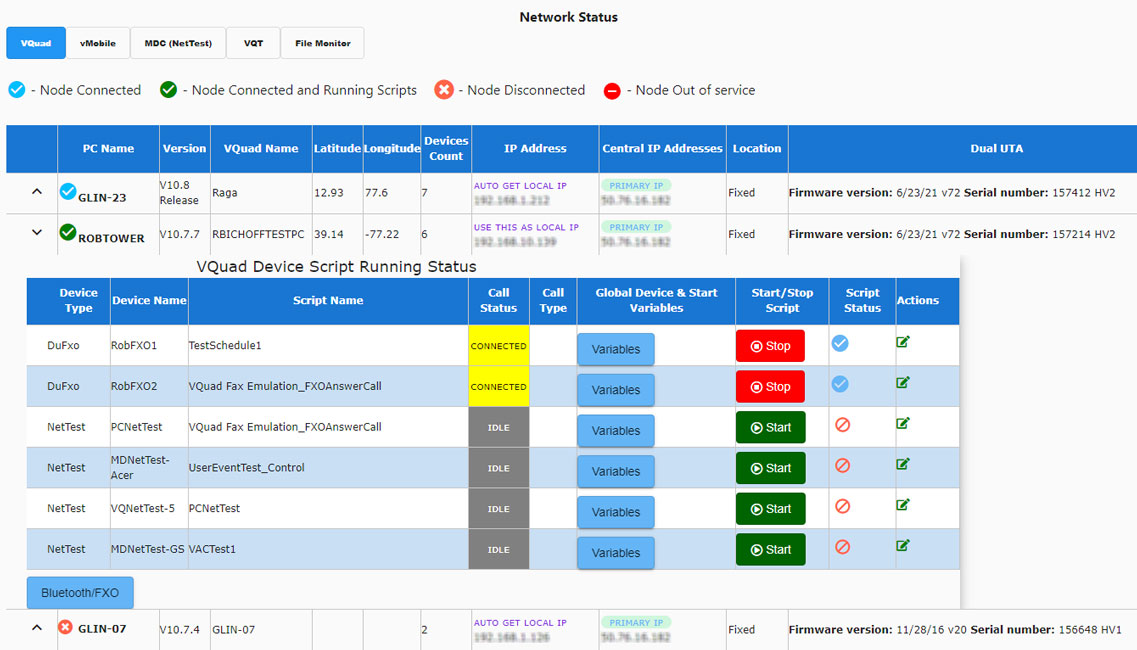
VQuad™ Network Status
VQuad™ Network Status
VQuad™ Network Status screen displays the VQuad™ Status and the Devices Script Status.
Option to edit VQuad™ and File Monitor Node parameters are included for easy control of the nodes. Editable VQuad™ node parameters includes Node Name, GPS co-ordinates (retrieved automatically if GPS receiver is attached to Dual UTA HD or can be user defined, to be displayed in WebViewer™ Google Maps), VQuad™ PC IP address, Primary and Secondary Central DB IP Addresses configuration for backup and redundancy, and VQuad™ location (Fixed/Mobile) type. VQuad™ node device script status parameters such as the Script Name, Call Type (5G, 4G, LTE, 3G, PSTN, and CvoIP), Global Device, Start Variables, FXO Bluetooth number, and Start/Stop script manually.
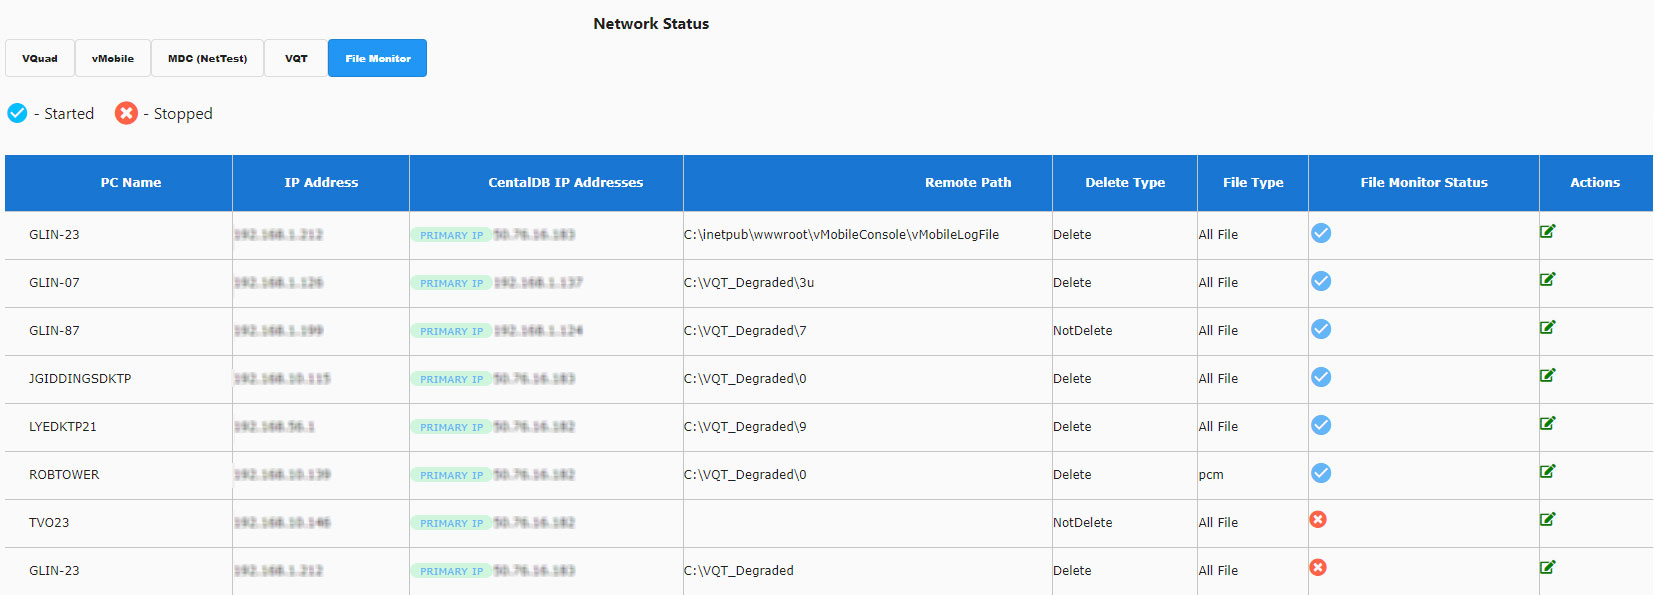
File Monitor Network Status
File Monitor Network Status
File Monitor node status screen displays the Computer Name, IP Address, Primary and secondary VQT Destination IP Addresses to handle network fail-overs, Remote Path, Delete Type, File Type, and the running/ stopped File monitor Status. The editable File Monitor node parameters include Destination IP Addresses, Remote Path, Delete Type, and File Type.
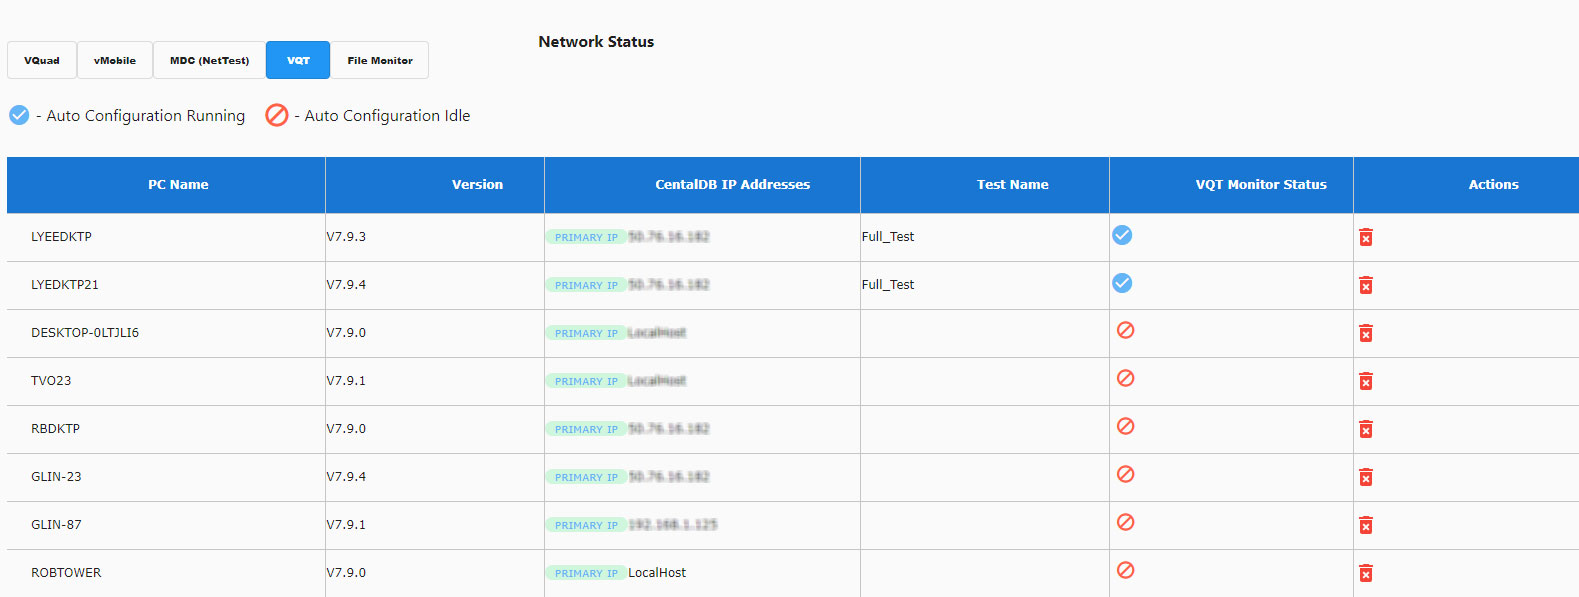
VQT Network Status
VQT Network Status
VQT node status screen displays Computer Name, Central DB Primary and secondary IP Address for back-up and redundancy, Version, Test Name, and the Test Status.
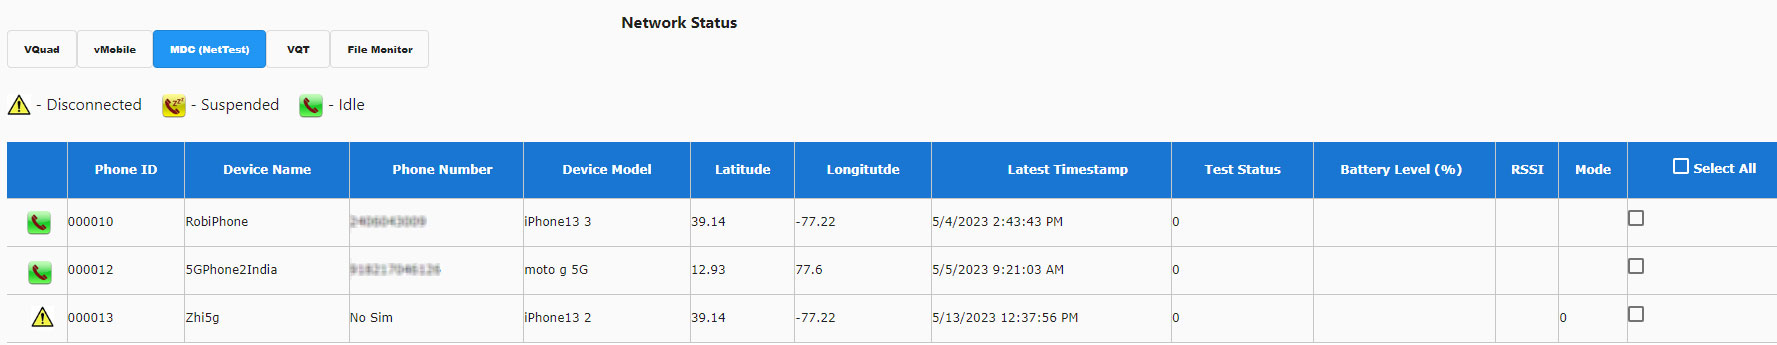
Mobile Device Network Status
Mobile Device Network Status
Mobile Device Status such as Disconnected, Phone Suspended, Phone Idle, and other conditions along with mobile device information in the network are also displayed.
Filters
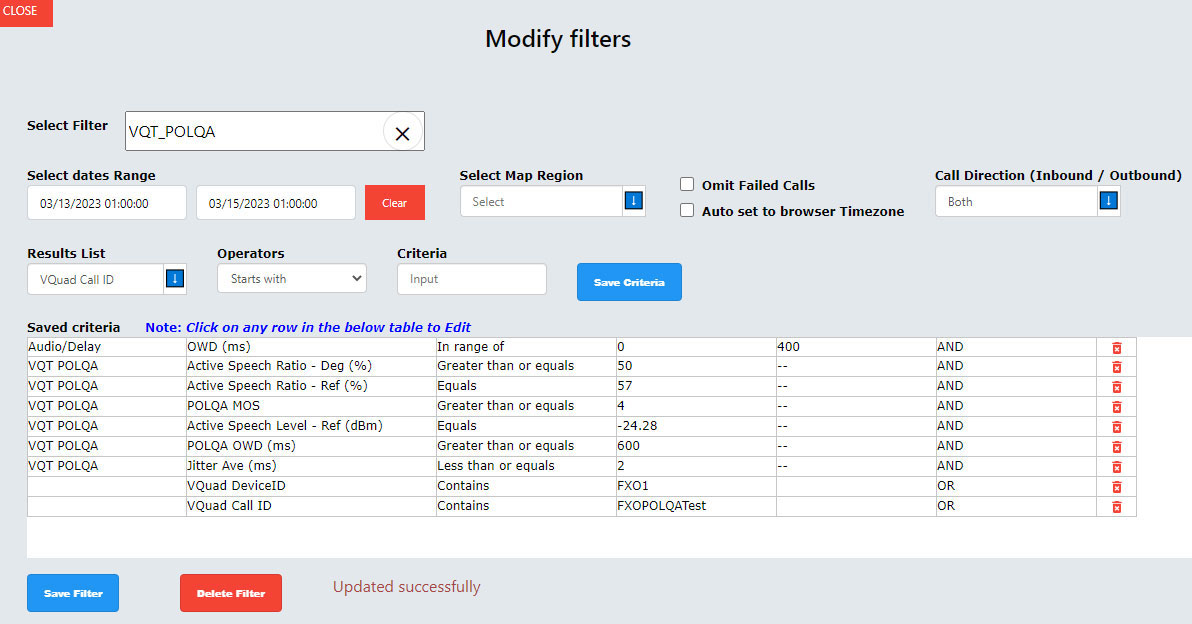
The filter options allow users to configure search criteria (VQT, vMobile™, VQuad™, NetTest, VAC, VBA). Users can utilize the Search Criteria to filter the search based on various criteria, including Called Number, Ratings, Measurement Range, GPS position, and User-Specified Events. Users can configure PC-based and Mobile device NetTest parameters to create search criteria. Users have the flexibility to combine filter Criteria parameters using logical operators AND or OR to create a filter with multiple conditions.
Send Results to Excel, PDF, CSV Files
The output results option can be used to export any selected test results to a PDF, Excel, or CSV files. The reports can even be customized using the Custom Report feature.
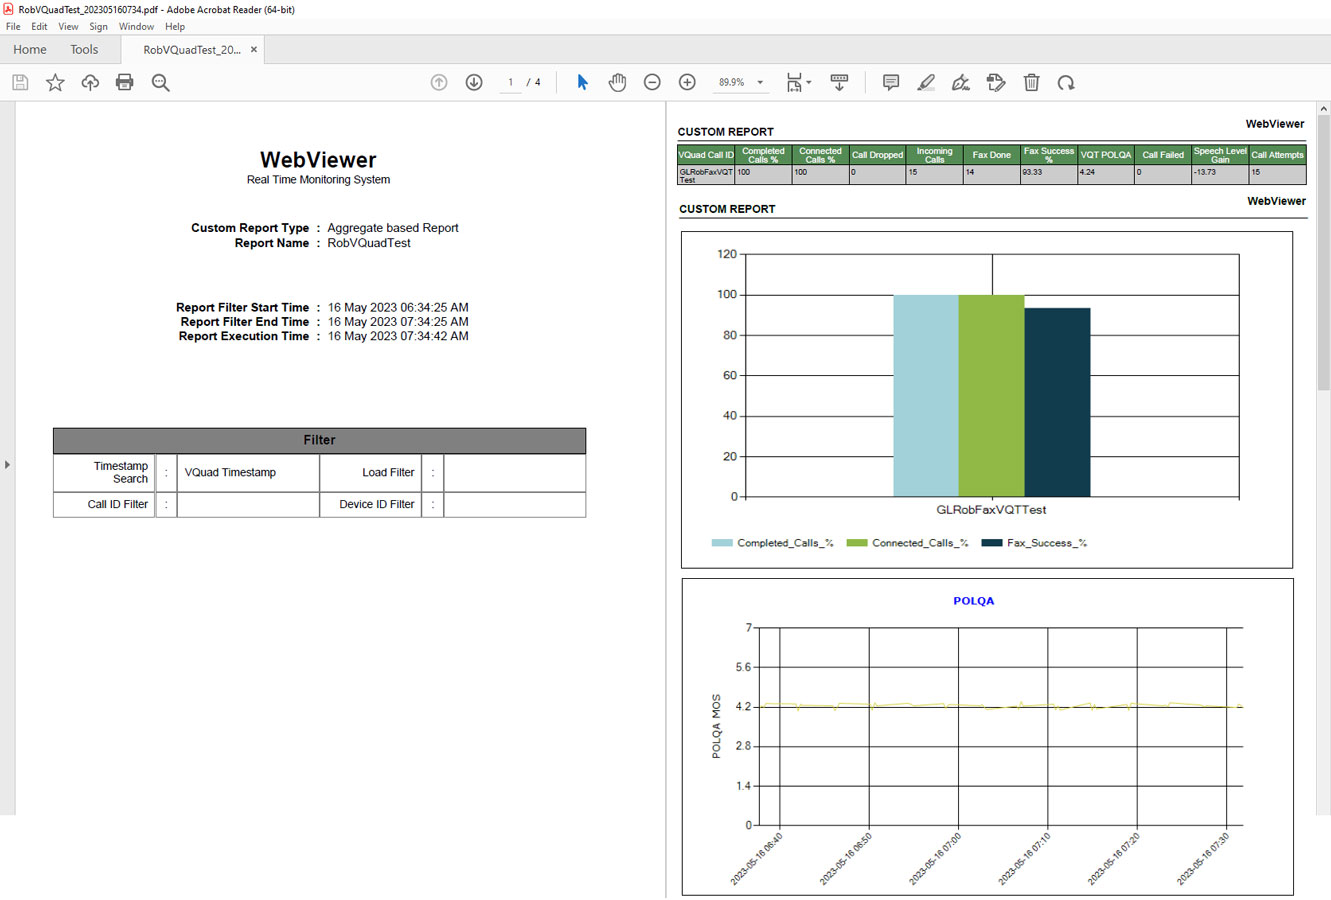
Results Exported to PDF File
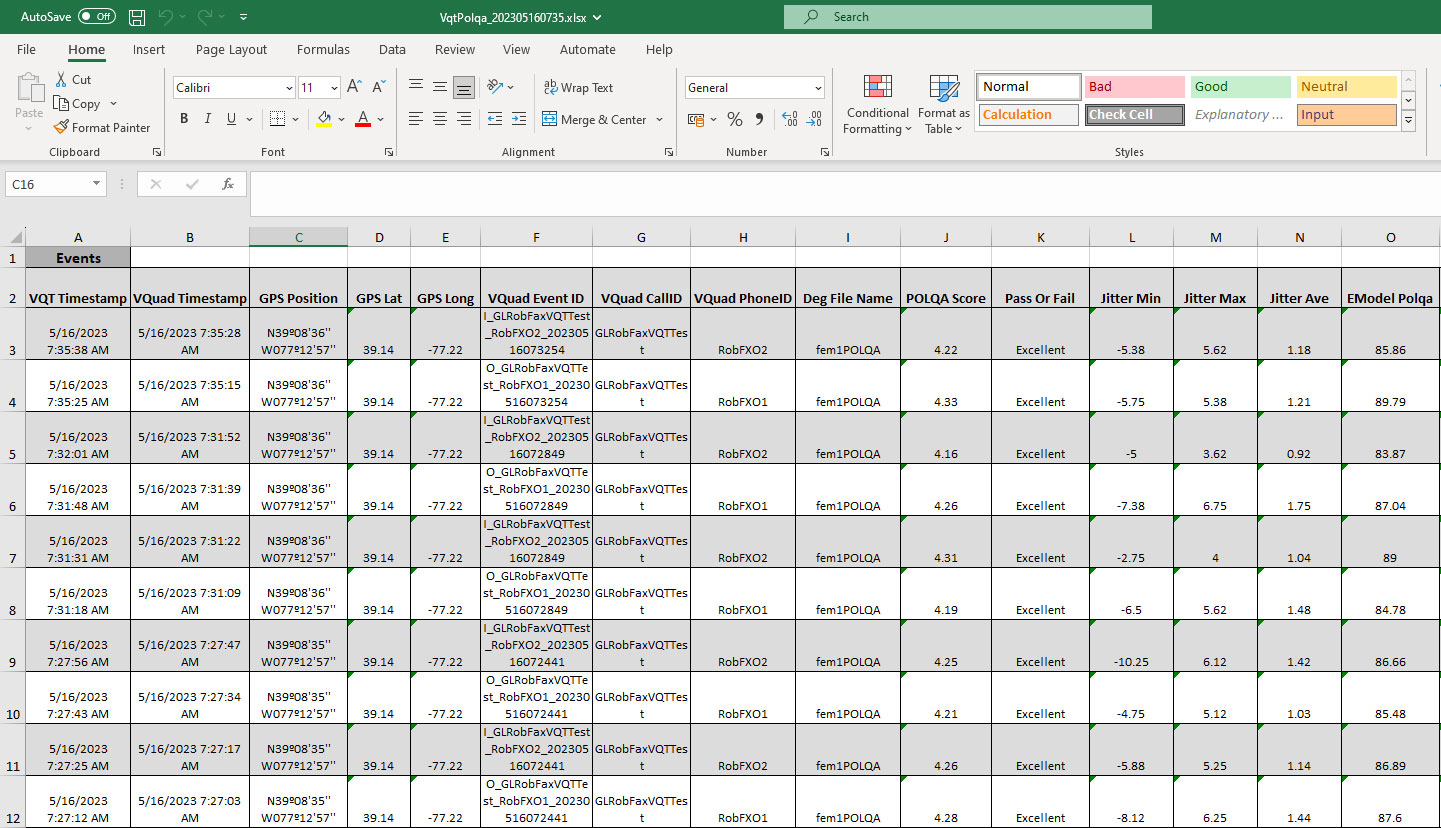
Results Exported to Excel File
Custom Reports
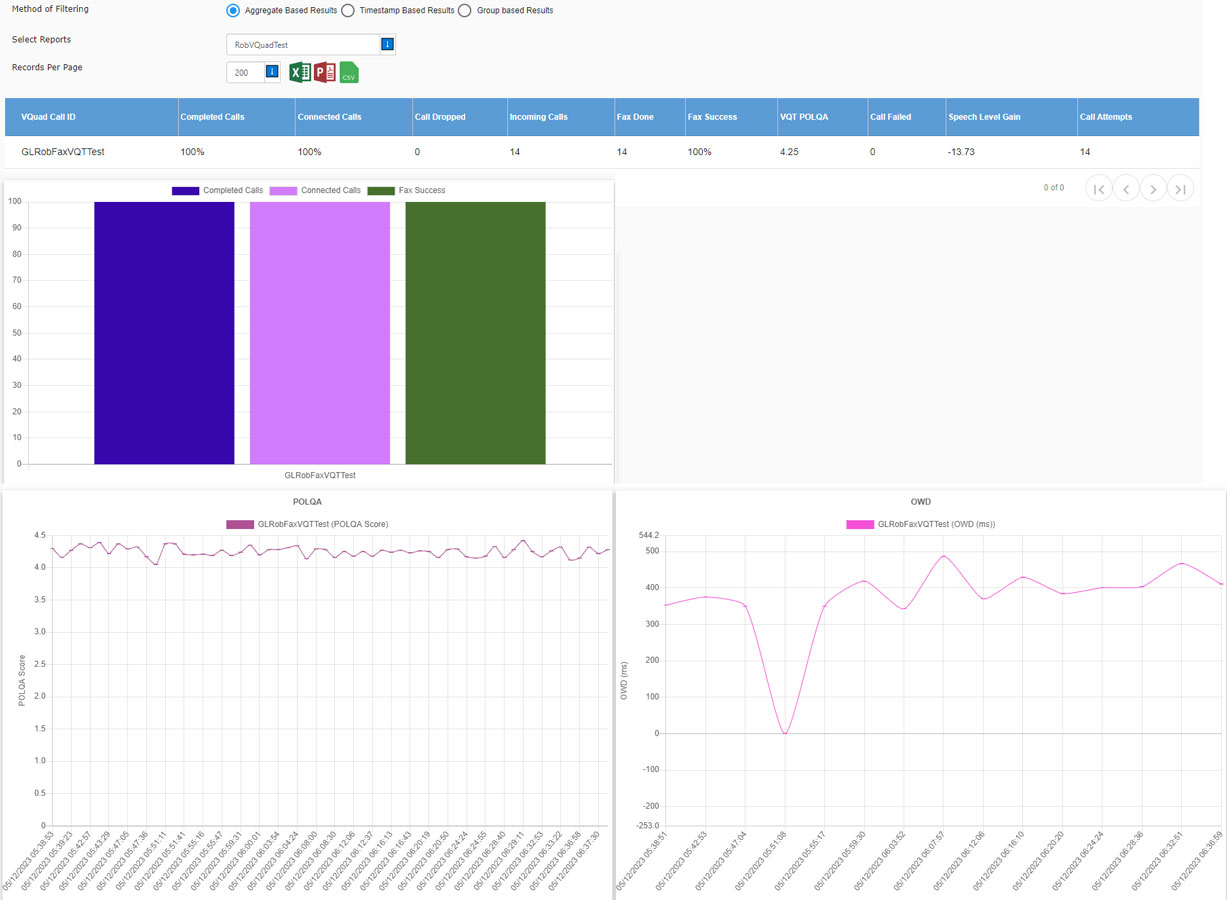
Using WebViewer™, user can customize report generation with result statistics, tabular data, bar graphs, and line graphs. Reports can be customized based on a combination of different parameters in Results View, Call Events, and Statistics. WebViewer™ can generate and export the customized report in either PDF or Excel or CSV formats, while also allow users to view results dynamically on WebViewer™.
WebViewer™ can generate the custom reports with a variety of filtered configurations. All configurations are created and modified directly within WebViewer™ - create a new report or modify existing reports for displaying the user-specified results. Included with Custom Reports is the ability to specify custom Line Graphs.
Additionally, Report Scheduler gives the user the ability to specify when to schedule a report along with the schedule period and user-specified filters. For instance, every Monday schedule a report which includes last 7 days, or schedule a report every morning or once a month. The Scheduler uses the Custom Reports as specified above and outputs as PDF or Excel or other format. As part of the Report Scheduler, all reports generated can be shared automatically via Email or SMS. So, if desired, every morning user can have an email or SMS with the past day testing performance.
Custom Reports
Google Maps
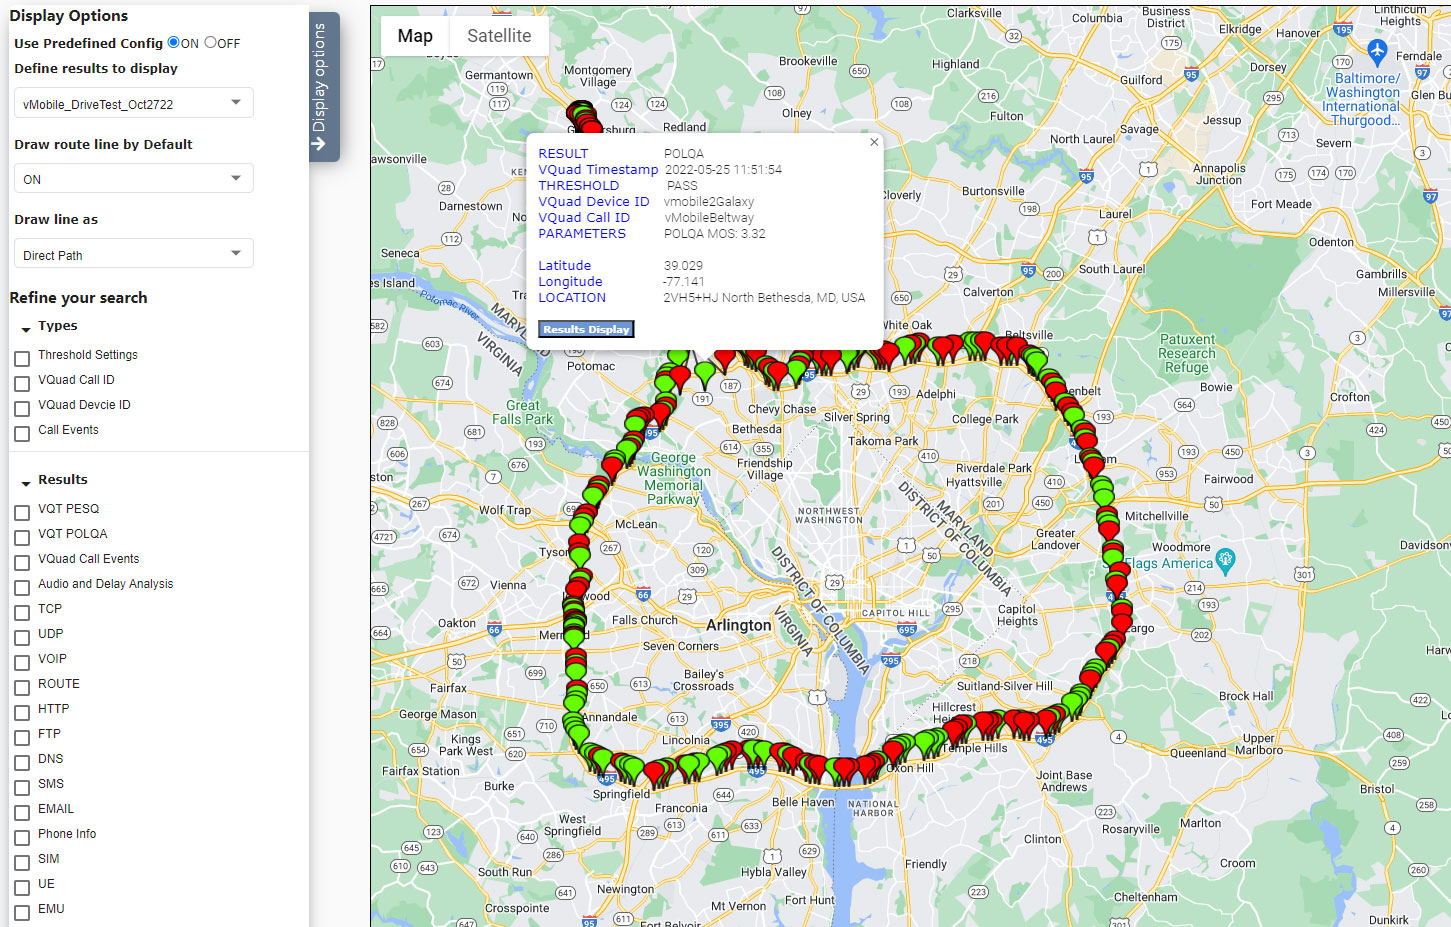
Google Maps plotting option is provided to display the GPS co-ordinates of various Results, vMobile™, VQuad™ Nodes, and Mobile Devices. Results include VQT PESQ, VQT POLQA, NetTests, Call Connect Events, EMU, FAX, and VBA tests. These are differentiated using color codes and text call-outs. Plotting can be done in real-time while drive testing and also while testing at a location.
Google Maps plotting can be customized based on the specific map configuration. The customized map plotting can be further refined by choosing the test parameter such as VQuad™ location, VQuad™ Phone ID, Call Events, Threshold Settings; and other result types.
Within the map, any node result details such as Result type, Device PhoneID, Device Name, GPS Position, and Location of the test result can be obtained. Users can also get the individual device or application status or result statistics.
Google Maps Plotting
The Google maps Plotting Configurations can be created for the 4 map types (Threshold Settings, VQuad™ Location, VQuad™ Phone ID, and Call Events), and the results available for the results types, and the Phone IDs. The Pin configuration includes the color and the text settings to indicate the Pass and the Fail conditions on the map.
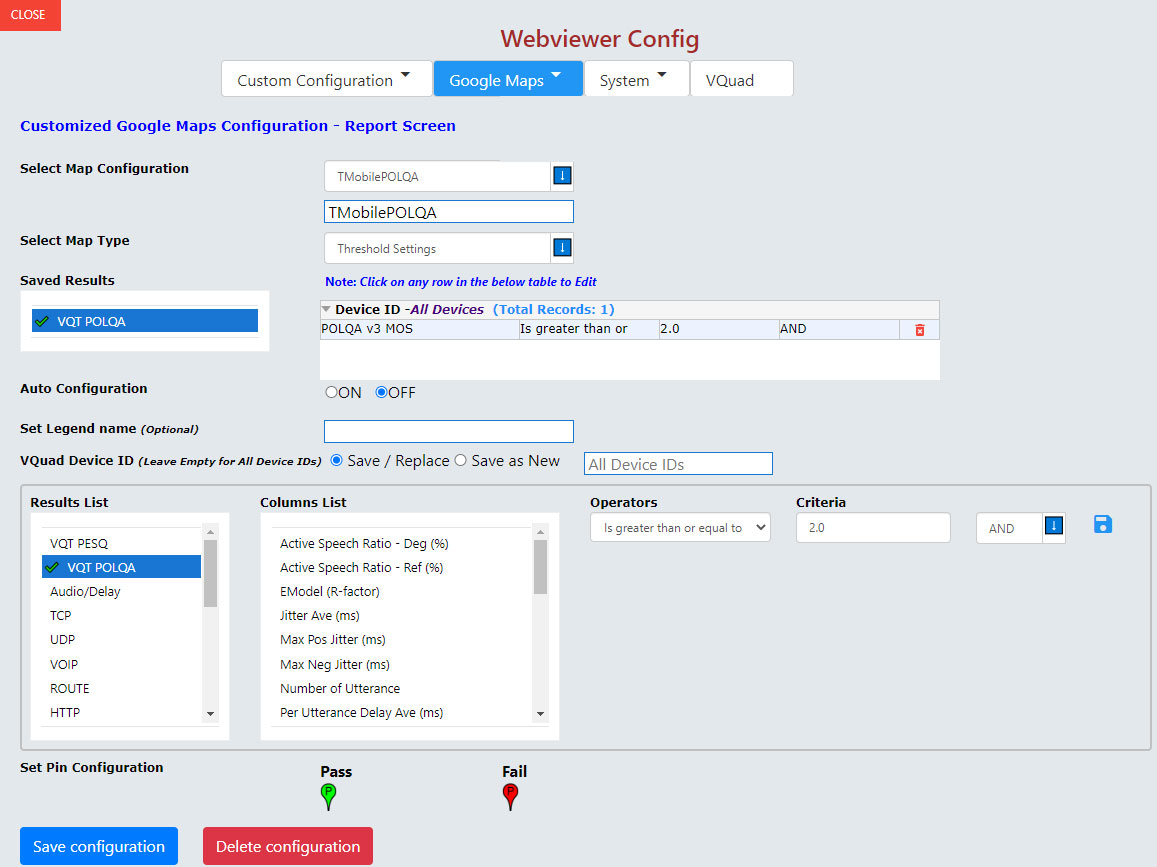
Google Maps Configuration
Indoor Tracking System (ITS)
WebViewer™ simplifies indoor tracking where GPS is unavailable by plotting vMobile™ and VQuad™, results directly on customer provided JPG floor plan or location diagrams associated with the testing environment. The GL ITS supports walk-tests in underground, remote, or inaccessible areas. This GL solution offers a user-friendly method for conducting efficient indoor or non-GPS accessible testing of radios or mobile phones.
The ITS Viewer, as depicted in the WebViewer™, presents the ITS test route and the test results associated with the VQuad™ and vMobile™ walk test, both Uplink (Circle) and Downlink (Triangle) results.
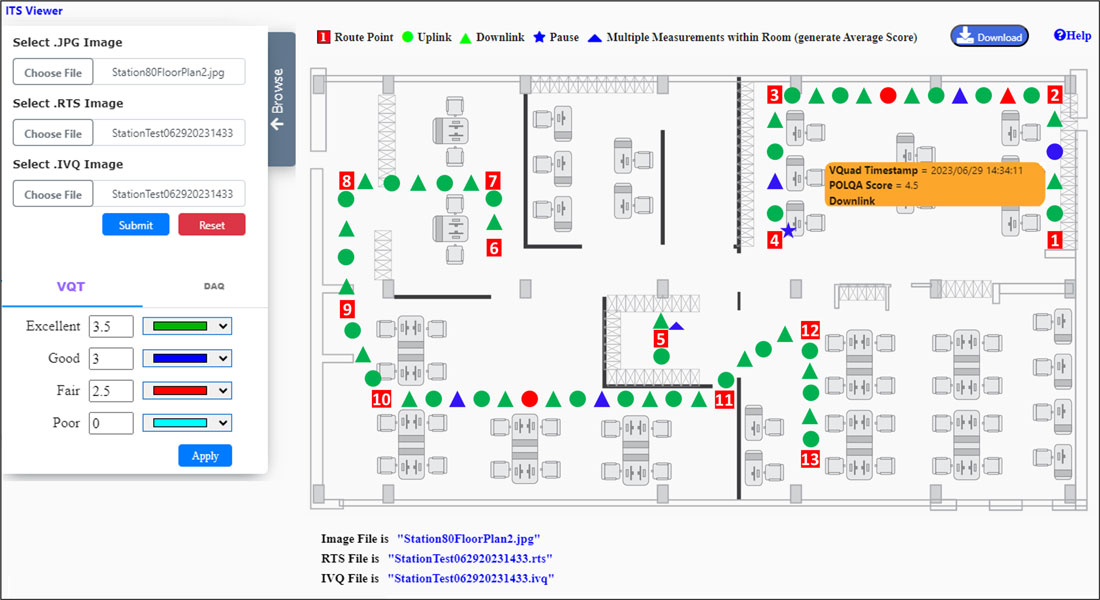
ITS Viewer
KPI & Results
| Call Control & Events | Supported KPI | Graphical Results | Tabular Results |
|---|---|---|---|
Call Events |
|
 |
|
VQT |
|
 |
 |
Delay Measurements and Analysis |
|
 |
 |
FAX Testing |
|
 |
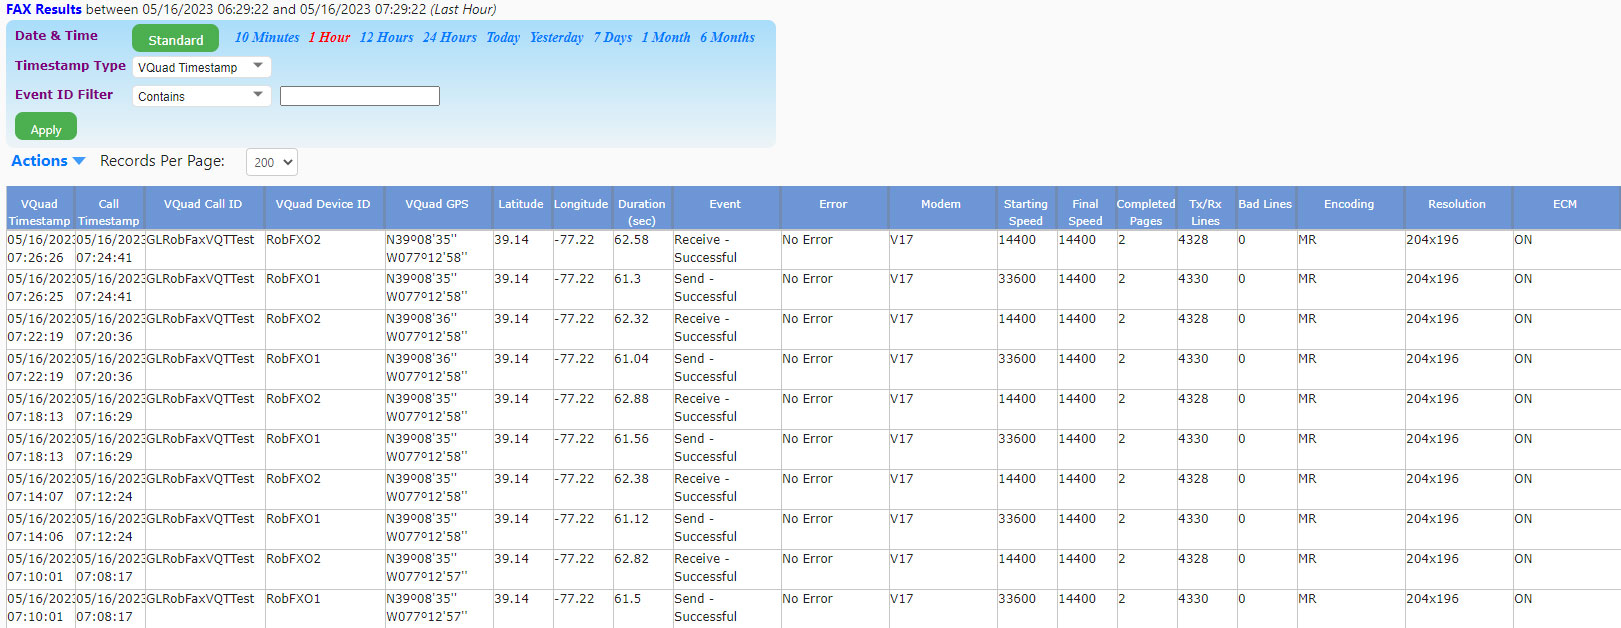 |
Data Testing KPIs |
|
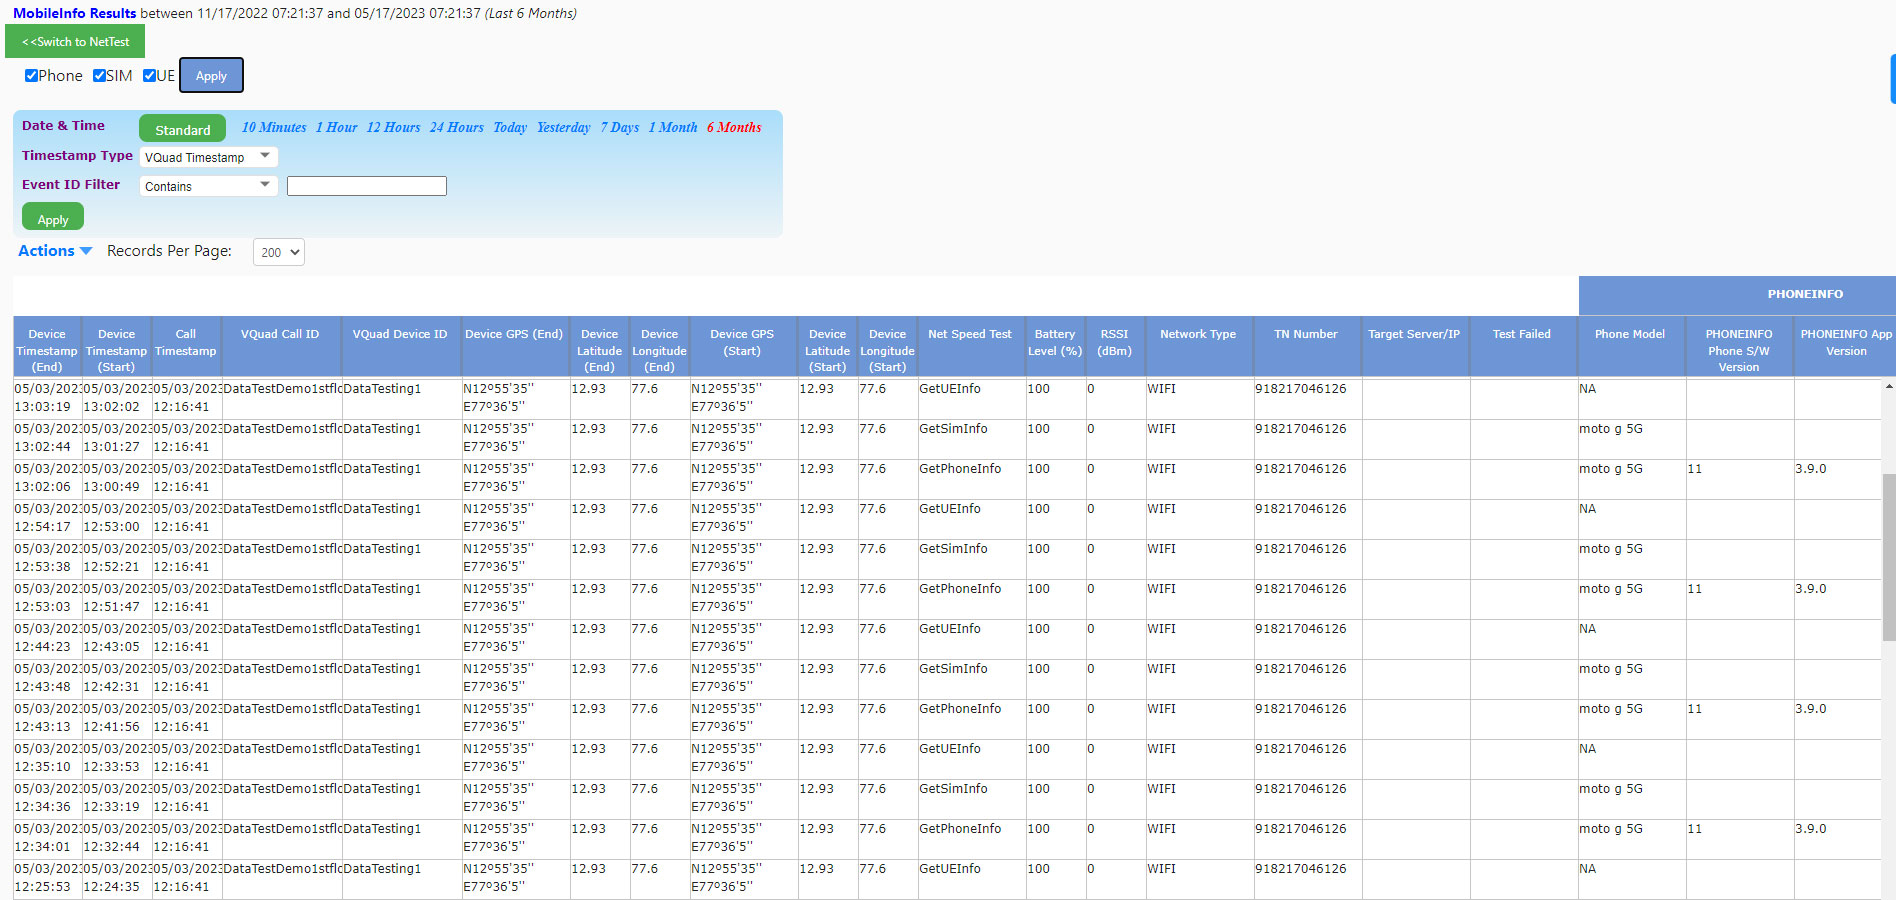 |
|
Video Testing KPIs |
|
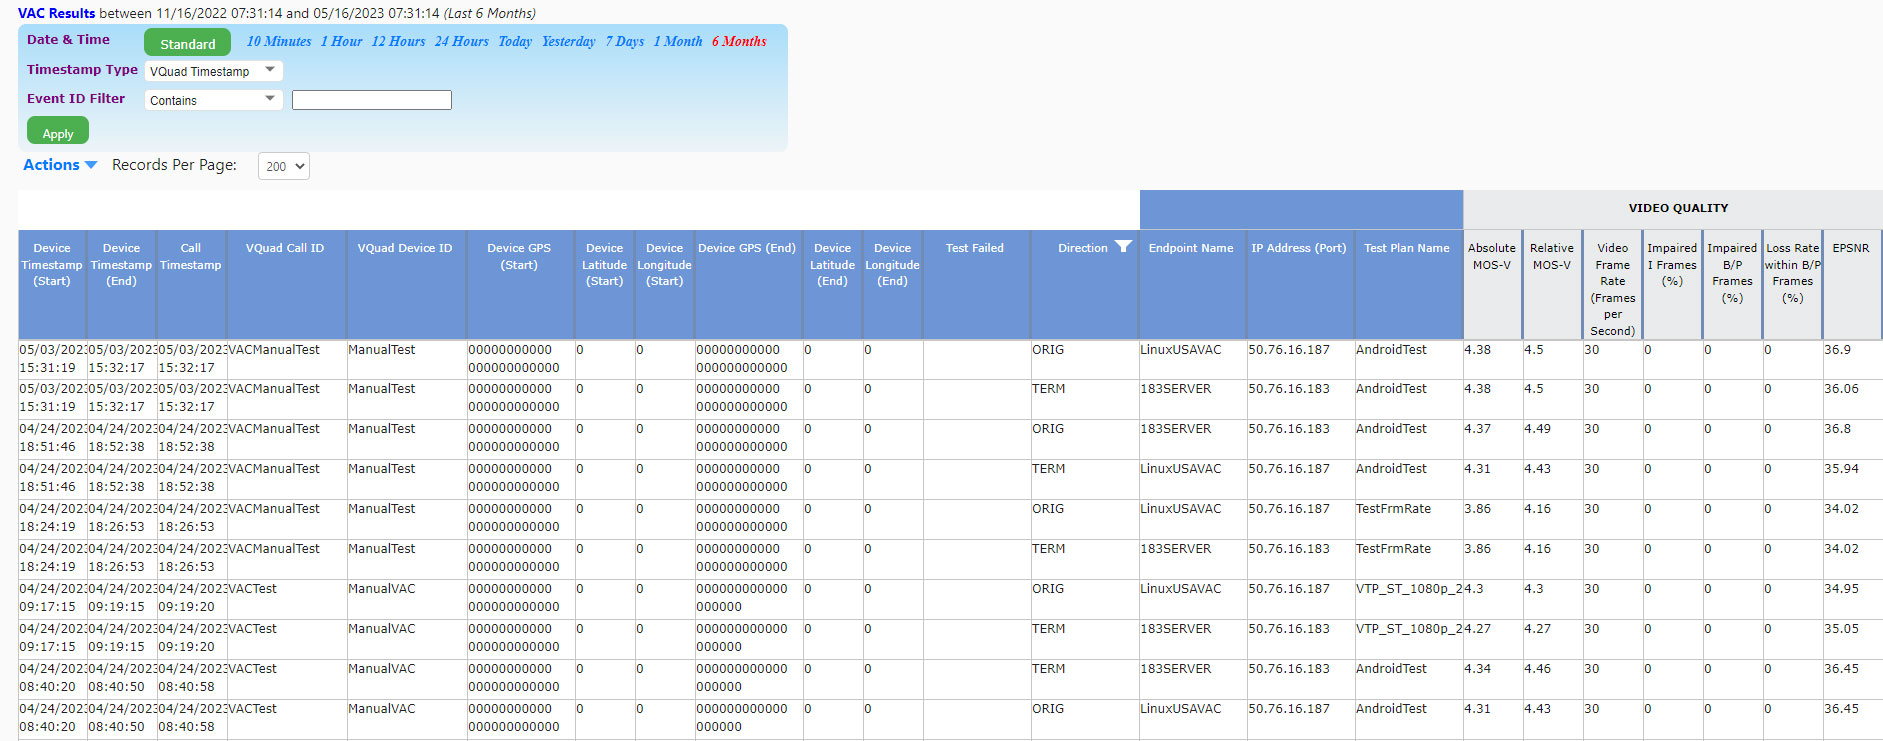 |
Resources
Note: PCs which include GL hardware/software require Intel or AMD processors for compliance.
| Item No. | Item Description |
| VQT040 VQT041 |
VQT Webviewer™ VQT WebViewer™ w/ Database |
| Related Items | |
|---|---|
| VQT010 | VQuad™ Software (Stand Alone) |
| VQT280 | VQuad™ Probe HD (with Dual UTA HD) |
| VQT291 | vMobile™ - Portable VQT Test Solution |
| VQT601 | Mobile Device Controller (MDC) Software |
| VQT600 | VQuad™ NetTest Data Server Solution (Requires annual license renewal to remain functional) |
| VQT002 | Voice Quality Testing (PESQ only) |
| VQT006 | VQT w/ POLQA Server license (no limitations) |
| VQT007 | VQT POLQA v3, server license for 20 nodes |
| VQT008 | Voice Analysis Tool (VAT™) |
| VQT014 | AutoVQT™ |
| VQT014U | Upgrade from VQT POLQA to AutoVQT™ |
| VBA032 | Near Real-time Voice-band Analyzer |
| EMU037 | Echo Measurement Utility (EMU) Software |
| VQT650 | Video Application Controller (VAC) |
| Quick Install Guide |
|---|
| WebViewer and Data Import Quick Install Guide |
| VQuad Quick Install Guide |
| VQT Quick Install Guide |