Bit Error Rate Testing (BERT) for Laptop T3/E3 Analyzer
Overview
GL's T3/E3 Bit Error Rate Tester application measures the correctness of data received on T3/E3 channels for a repetitive fixed or pseudorandom pattern for the given transmission.
The digital data in various fields such as digital circuits, mobile communications, antennas, digital broadcasting need to be monitored for error-free transmission. Bit Error Rate provides a figurative measurement of the number of erroneous bits received for the total number of bits transmitted. With GL's powerful Bit Error Rate Tester, users can compare the bit/data pattern received against a known pattern in order to identify errors.
The features include support for multiple ports, with a consolidated result view. The Tx & Rx settings for all the ports can be independently controlled or coupled as per the convenience of the user.
Other features include graphical view for the results, sophisticated logging of events, status, trouble indications, and error & bit pattern (static and user defined) insertion.
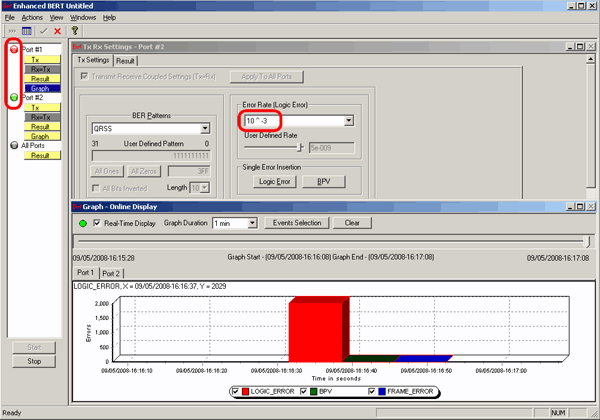
Bit Error Rate Testing application for the T3 (DS3) and E3 Analyzers
Main Features
- Performance Analysis: ITU-T G.82, G.826, M.2100, M.2110, M.2120
- Error Insertion - Single Manual error, Automated error rate 10-2 through 10-9, User defined error rate ranging from 0.01 to 1e-009
- Bit Patterns - Permits users to insert an n*64 kbps (or selected 64 kbps channel) test pattern in an incoming signal and send it out through transmitter
- QRSS, 26-1, 29-1, 211-1, 215-1, 220-1, 223-1
- Static: All 1s, All 0s, 1010, 1 in 7, 3 in 24., CSU Loop-Up, CSU Loop-Down, NIU Loop-Up, NIU Loop-Down
- User Defined: 1 to 32-bits
- Events and Error logging - Events can be logged for extended periods. This information is recorded in XML file format. The length of these result files is limited with defined time duration or file size. Online (real-time) view of events and offline view of saved events are supported through a powerful graphic event viewer application.
- Graphical Display - The Error Count Vs Time graph of the bit error test results is displayed. For real-time graph, the results are displayed live. For Offline graph display the saved result files (*.xml) are loaded for analysis. The entire result file saved from a previous analysis can be played back for complete visualization of the result.
- Testing on multiple ports - Supports testing on multiple ports simultaneously with consolidated result view
- Independent settings for Tx and Rx configuration - Tx and Rx settings for multiple ports can be independently controlled or they can be copied (Apply to All) from a single card to all cards.
- Quick view of the status and trouble indication - The icon on the tree view will show the status (BERT is running or stopped through continuous blinking) as well as indicate any kind of errors through the red, green or yellow alarms, allowing the users to look at the results for further investigation.
- Save and Load configuration settings - With this feature, the configuration settings created for a particular scenario can be saved for later use. These saved profiles can be made available to address various testing conditions.
- Error Insertion - The application can automatically insert Logic and BPV errors at regular intervals of time (secs) or just insert single bit errors into the transmit stream.
- Error Rate -Supports predefined and user defined error insertion rate ranging from 10^-2 to 10^-9 (0.01 to 1e-009).
- Bit Patterns (Static and User-defined) - Generates various static bit patterns such as - QRSS, 2^5-1, 2^9-1, 2^11-1, 2^15-1, 2^20-1, 2^23-1, All ones,
All zeros, 1:1, 1:7, 3 in 24, CSU Loop-Up (0001), CSU Loop-down (001), NIU Loop-UP (11000), and NIU Loop-Down (11100), and user-defined static patterns
of size up to 32 bits.
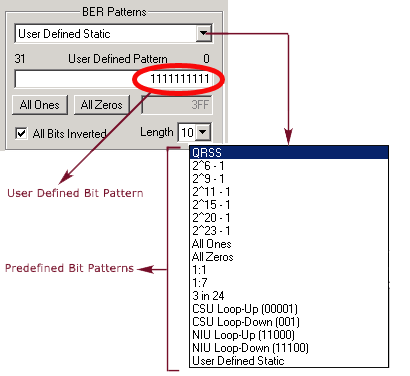
Static and User-defined pattern selection
- Events and Error logging - Events can be logged for extended periods. This information is recorded in an XML file. The length of these result files can be limited with defined time duration or file size. Online (real-time) view of events and offline view of saved results are supported through a powerful graphic event viewer application.
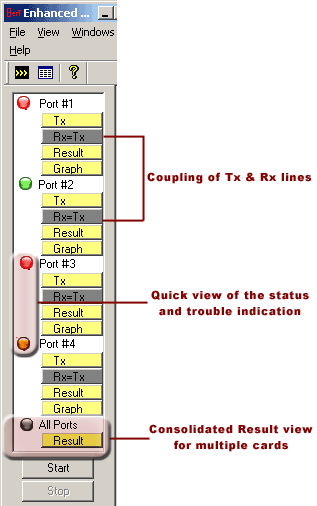
Selection of Port - View Error Status, Results
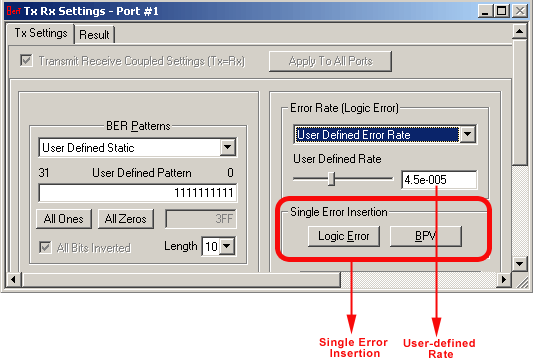
Error & bit patterns insertion
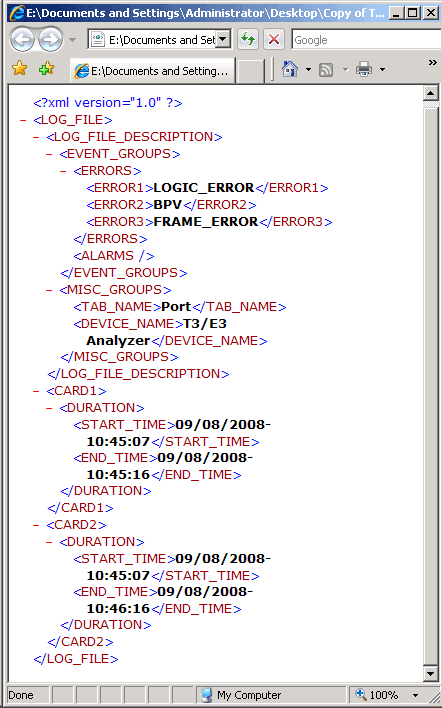
Events and Results Logging
BER Patterns
BERT application has various available predefined data patterns:
- Quasi Random Signal Source (QRSS):
The length of this pattern is 1,048,575 bits. This pattern is generally used as a test signal to test T3/E3 lines. - 2ˆ6-1 (63):
Here a maximum of five consecutive zeros and consecutive ones are generated. The length of this pattern is 63 bits. - 2^9-1 (511):
Here a maximum of eight consecutive zeros and nine consecutive ones is generated. The length of this pattern is 511 bits. - 2^11-1 (2047):
Here a maximum of ten consecutive zeros and eleven consecutive ones is generated. The length of this pattern is 2047 bits. - 2^15-1:
Here a maximum of 14 consecutive zeros and 15 consecutive ones is generated. The Length of this pattern is 32,767 bits. - 2^20-1:
Here a maximum of 19 consecutive zeros and 20 consecutive ones is generated. The length of this pattern is 1,048,575 bits. See definition of QRSS. - 2^23-1:
Here a maximum of 22 consecutive zeros and 23 consecutive ones is generated. The length of this pattern is 8,388,607 bits. - CSU (Channel Service Unit) Loop Up Code:
The framed sequence consists of a repetitive 5 bit sequence "00001" with the framing bit in its normal position. The unframed sequence consists of the same repetitive 5bit sequence without a framing bit. - CSU Loop Down Code:
The CSU Loop Down Code is a 3 bit sequence "001" and is similar to the CSU Loop Up Code in the unframed and framed modes. - NIU Loop UP and Loop Down codes:
Loop up code is of 5 bits ('11000' as defined in application) and Loop down code is of 3 bits (111). - All Ones, All Zeroes:
It's a Static pattern of continuous ones or zeros respectively. - 1:1:
It's a Static pattern of alternating ones and zeros. - 1:7:
It's a Static pattern with one "1" and seven "0"s. - 3 in 24:
It's a Static pattern with three "1"s in a string of 24 bits User Defined User definable 24-bit static pattern. - User Defined Static Pattern:
It is a Static pattern with 32-bit pattern. Available bit patterns are binary 1's or 0's / HEXA values or all ones / all zeroes values.
Real-time Tabular Display
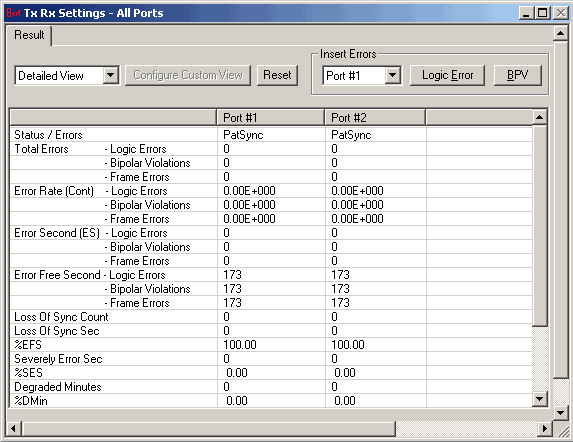
Consolidated Result View (Tabular)
Tabular Result for Frame Errors, Bipolar Violations and Logic Errors
- Status/Errors:
"Pat Sync" is displayed in this field if BER is less than 0.019. "No Pulses" is displayed if no signal is received.
- Total Bit Errors:
This is the Count of total number of bit errors detected after Pat Sync is achieved.
- Err Rate (Cont):
This is the ratio of Total Bit Errors to the total number of bits received i.e., the BER.
- Err Second (ES):
It is the number of seconds with one or more errors detected during the Pat Sync condition.
- Err Free Second (EFS):
It is the number of seconds with no errors detected during the Pat Sync condition.
- %EFS:
The ratio of EFS to Test Sec multiplied by 100, where, Test Sec = Test Run Sec - Loss of Pat Sync Sec.
- Severely Err Sec (SES):
It is the number of Test Sec with a Bit Error Rate worse than 1*10-3 in each second.
- %SES:
This is the ratio of SES to Test Sec multiplied by 100.
- Degraded Minutes:
The number minutes with a Bit Error Rate in each minute equal to or worse than 1.0*10-6
- %Dmin:
This is the ratio of Degraded Minutes to the Test Run Minutes. Loss of Pat Sync time is included in Test Run Minutes.
- Loss of Sync Count:
The count of number of times the pattern sync was lost. Pat Sync is automatically re-established if lost.
- Loss of Sync Sec:
The total number of seconds the pattern sync was lost. If Pat Sync was momentarily lost and re-established during 1-second interval (one or more times), then this count is incremented by one.
- Loss of Pat Sync Threshold:
If the BER is worse than 0.19 (approximately 1 error in bits on average) during any poll of the pseudo random bits, a Loss of Pat Sync is declared. A poll occurs with a frequency of once in 3 to 10 multiframes depending on whether a fast Pentium or a fast 386-host computer is used.
- Available Seconds:
The number of seconds with a BER in each second better than .0*10-3
- %Available Sec:
It is the ratio of available seconds to the Test Run Sec multiplied by 100. Loss of Pat Sync time is included in Test Run Sec.
- Unavailable Seconds:
It is the number of seconds with a BER in each second worse than 1.0*10-3. The count begins at ten and after ten consecutive unavailable seconds has been detected.
Graphical Result
The Error Count Vs Time graph of the bit error test results is displayed. For real-time graph, the predefined or the user defined bit pattern and the errors can be inserted.
Any of the events such as LOGIC_ERROR, BPV, or FRAME_ERROR can be set for the displayed. The graph depicts the start and end of the x-axis and for the entire file.
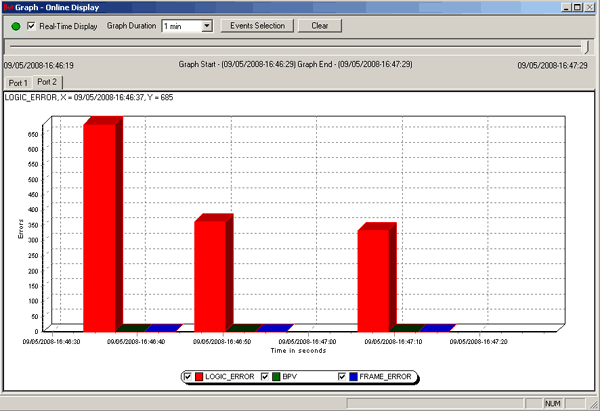
Real-time Graphical Result View
Offline Graphical Display
For Offline graph display the saved (*.xml) files are loaded for analysis. The entire file selected for analysis can be played back for complete view of the graph.
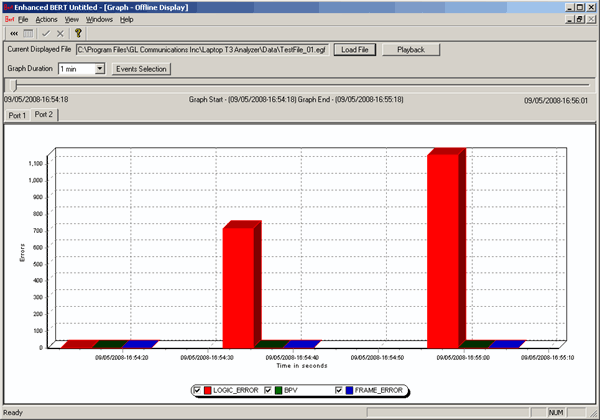
Offline Graphical Result View
 Back to List of T3E3 Basic and Optional Applications Main Page