GL’s Simplified Network Monitoring System for Multiple T1 E1 Lines
22nd, Jun 2018
Welcome to another June 2018 issue of GL Communications' newsletter providing information and insight into our high-density Network Monitoring Systems. This newsletter gives you insights on our 16-port T1 E1 Analysis Probe (tScan16™) for TDM network surveillance system (NetSurveyorWeb™). Additionally, for operators looking a cost-effective and plug-and-play solution, GL has introduced NetSurveyorWeb™ Lite, a simplified web-based network surveillance system – read below to know more.
Simplified Network Monitoring System for Multiple T1 E1 Lines
GL’s Passive Network Monitoring and Diagnostic Systems facilitate historical storage, retrieval, querying, and display of Call Detail Records (CDRs) by non-intrusively connecting to TDM, Optical, or IP networks. Currently supported protocols include LTE, IMS, DIAMETER, UMTS IuCS, UMTS IuPS, VoIP (SIP, SIGTRAN, H.323, MAP, CAP), SS7, ISDN, CAS, TRAU and GSM.
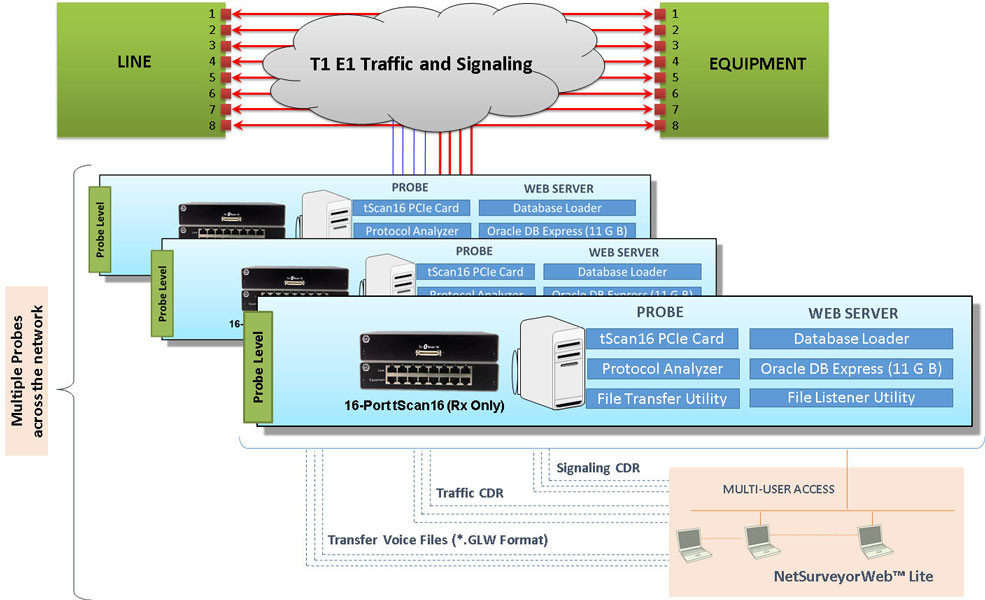
Typically, this requires protocol analysis probes for capturing physical layer, signaling call flows, and voice/data traffic, and a central system comprised of a database engine, web server, and NetSurveyorWeb™ (PKV170), a web-based application, to facilitate data storage and retrieval through web browser clients. Recent developments introduced NetSurveyorWeb™ Lite (PKV169), an integrated and a cost-effective monitoring system, that allows multiple protocol analysis probes, and all central system components such as database engine, and web server to run on a single system as depicted in the above diagram. The system allows for easy plug-and-play and simplified deployment process to start monitoring the networks.
In this newsletter, we bring focus on GL's Passive Network Monitoring and Diagnostic System for high-density T1, and E1 networks using 16-ports T1 E1 tScan16™ Analysis probe and NetSurveyorWeb™. Deploying High-density tScan16™ T1 E1 probes can continuously and simultaneously monitor Hundreds to Thousands of Signaling Links over 16 T1s or E1s lines with high performance. This provides improved processing and response times for calculating Statistics, Quality Measurements, Call Data Records, Filter, Search and other such functions.
Essential Components of Network Monitoring System
The NetSurveyorWeb™ Lite system comprises of three tier distributed architecture driven by non-intrusive hardware probes, webserver, intelligent software, and a database engine. The architecture is shown above and consists of a scalable and flexible system, so the user can use it for multiple sites and various applications.
- Non-intrusive hardware probe is a high-density tScan16™ T1 E1 board with 16-ports and the newer PCIe (x1) bus interface. The sixteen T1 E1 ports are Receive-only ports optimized for high performance voice and data capture, monitoring, and analysis requirements.
- The data (Signaling, and Traffic Call Data Records) collected at probe-level are stored into a relational database (Oracle) using ODBC. With the use of NetSurveyorWeb™ application, the real-time and historic call data records can be accessed using simple web browser interface for remote / local monitoring.
16-ports T1 E1 tScan16™ Analysis Hardware
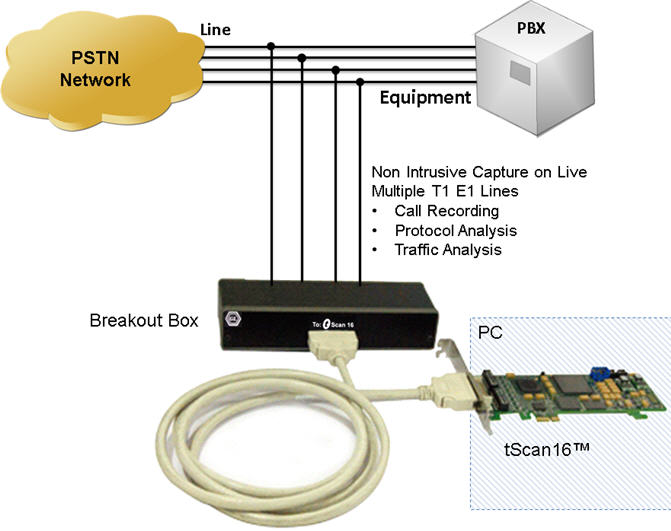
The T1 E1 equipment transmits a signal to the line and eventually to the network (outside world). Likewise, the signal from the outside world enters and eventually ends up at the equipment. The tScan16™ Breakout Box consists of 8 pairs of Line and Equipment RJ45c ports, which is used to receive the signals from both Line and Equipment sides. The 36-Pin Connector (3M Mini D Ribbon cable) interfaces the Breakout Box to the tScan16™ PCIe Board plugged to the PC.
The signals from line and equipment are routed through the tScan16 breakout box and non-intrusively monitored. This is repeated for all trunks in the following methods:
- Breakout Box with DSX-1 Patch Panel: tScan16™ breakout box connects to a DSX-1 patch panel which already have resistive monitor points. In this case, tScan16 is configured without resistors
- Monitoring Signals through Resistors: The signals are routed through the tScan16 breakout box and non-intrusively monitored (through resistors)
tScan16™ gathers signaling details non-intrusively and forwards call detail records (CDRs) and statistics to a central system. The probes connect to an ODBC compliant database via TCP/IP. Only precise and filtered data (user selectable) is collected into the centralized database.
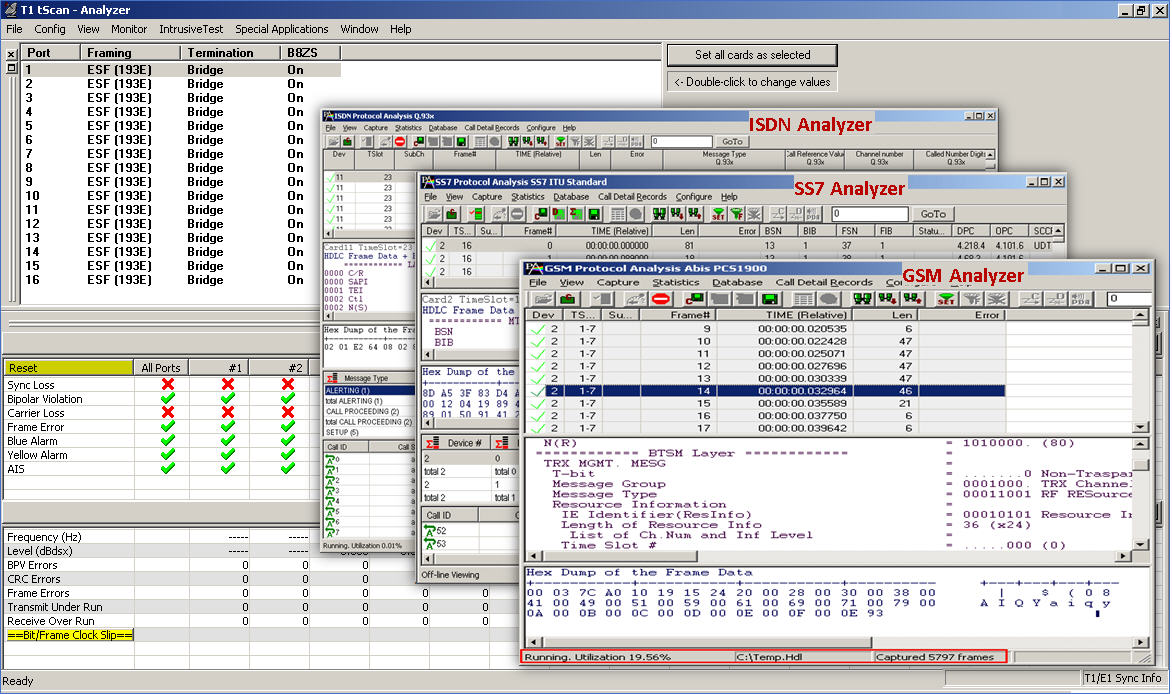
tScan16™ with TDM Protocol (TDM, GSM, SS7, CAS…) Analyzers
Advantages of tScan16™ Analysis Hardware include:
- Software selectable 16-Rx Only T1 or E1 interfaces
- Convenient High-Density Cabling
- PCI Express x1 Lane/Board
- Monitor T1 E1 line conditions such as frame errors, bipolar violations, alarms, frequency, and power level.
- Most all "Rx Applications" are available with tScan16™
- Analysis of ISDN, SS7, Frame Relay and Multilink Frame Relay, PPP and Multilink PPP, HDLC, and many more protocols
- Comprehensive analysis of Voice, Data, Fax, Protocols, and Digital signals, including Echo and Voice Quality testing
- Call Recording, Analysis, and Monitoring for hundreds to thousands of calls in one platform
Central System:
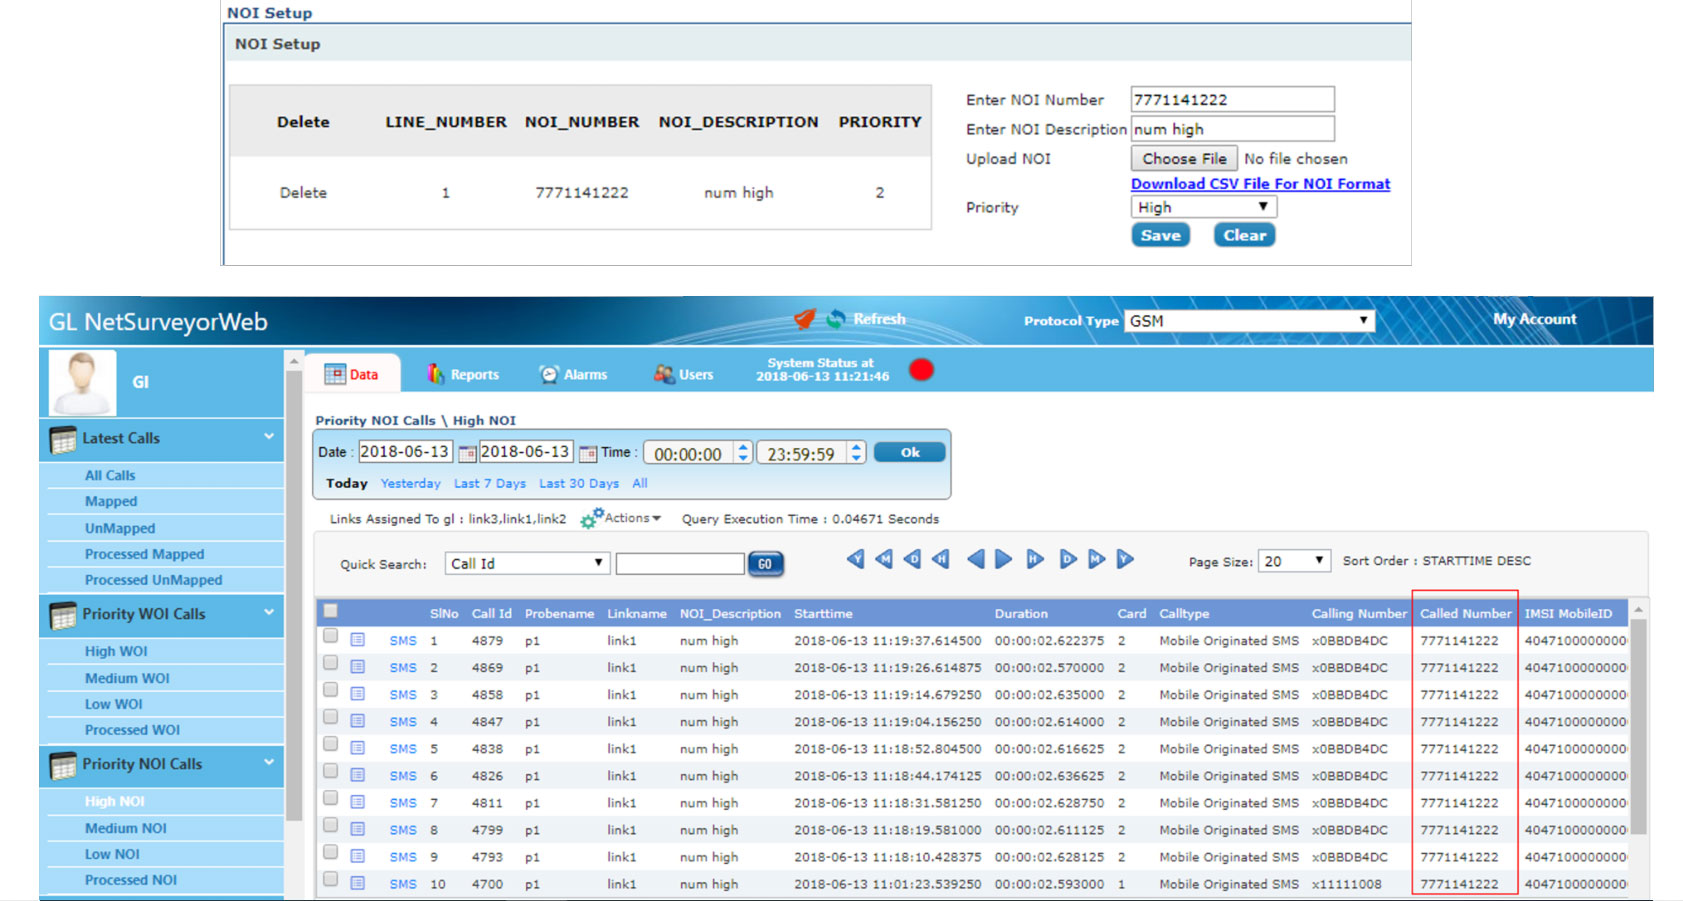
At the central system, the data (Signaling, and Traffic Call Data Records) collected at probe-level are stored into a relational database (Oracle) using ODBC. Interface between the probes and the database is well defined and is called "Listener" to stream data. With the use of NetSurveyorWeb™ application, the real-time and historic call data records can be accessed using simple web browser interface for remote / local monitoring.
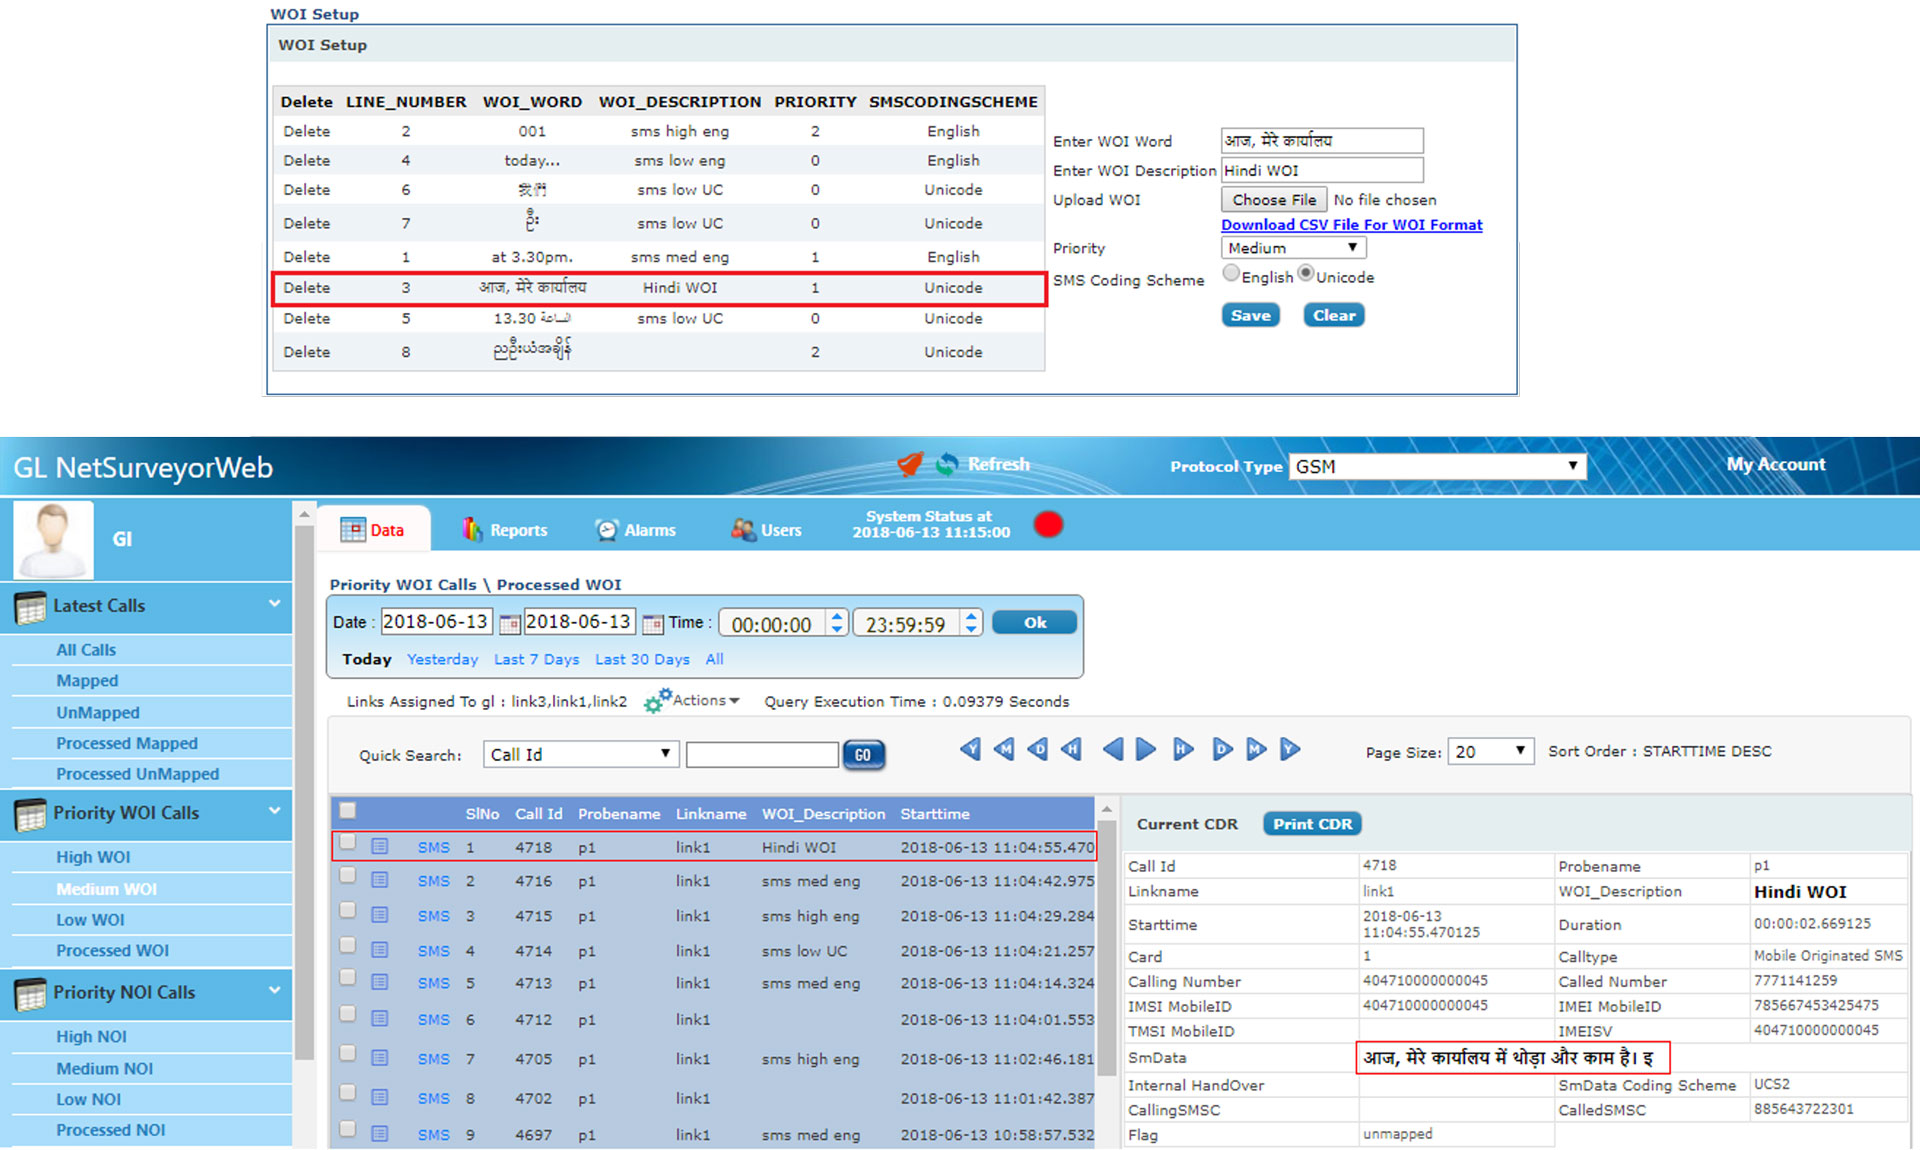
As depicted in the screenshots below, one can view real-time and historic data including call ID, probe name/location, call disposition, called and called number, and call duration.
As depicted in the screenshots below, one can view real-time and historic data including call ID, probe name/location, call disposition, called and called number, and call duration.
- Modular and distributed architecture is capable of theoretically 'infinite capacity'
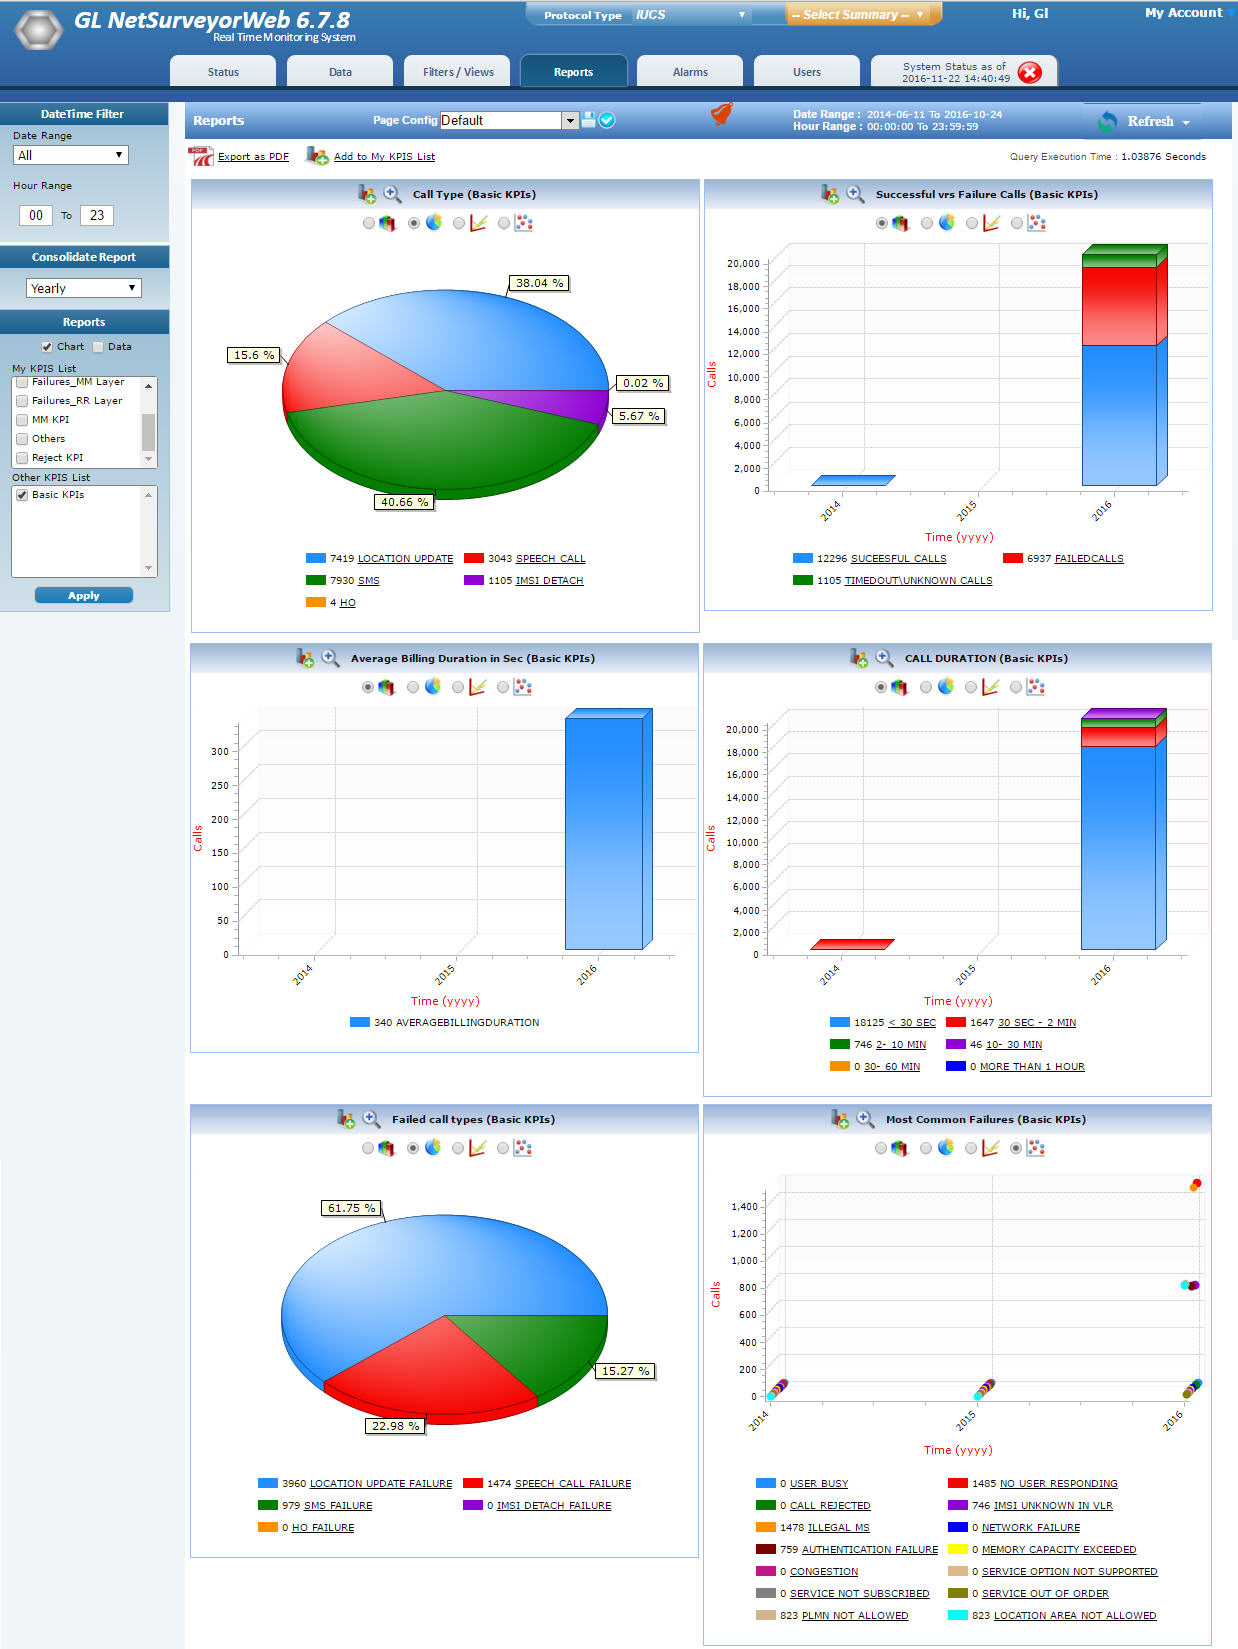
- Ability to identify and analyze network trends using Key Performance Indicators (KPI’s)
- View call graphs for each call
- Flexibility to perform complex filtering based on the protocol fields
- Automatically alert users when "Calls of Interest" occur
- Filtered calls will be available for a quick view as Processed Calls
- Priority can be set to these filtered records of interest – as high, low or medium
- Flexible report generation
- Access real-time data and historic remotely via browser-based clients
- Customized reports and graphs displayed both in tabular and graphical formats
- Graphs provided for Call Completion Ratio, Link Name Message Counters, Time Duration Message Counters, and Disposition Count
- Real-time data displays information such as called number, calling number, source & destination IP address, RTP packet details, frame decodes and more
- Customization of filter criteria for data analysis; use logical operators between filters
- Ability to export both graphical and tabular reports view as PDF
- Ability to export the call detail records displayed based on time filter or record index as PDF and CSV
The below graph shows how GL’s NetSurveyorWeb™ filters ISDN records based Called/calling Number (Number of Interest)
The below graph shows KPIs of the UMTS calls such as Total Calls, Passed Calls, Alerted Calls, and Failed Calls.
The below graph illustrates how GL’s NetSurveyorWeb™ filters SMS records on GSM network based on Local Languages or English (Words of interest)
NetSurveyorWeb™ - Filtered TDM ISDN Call Records
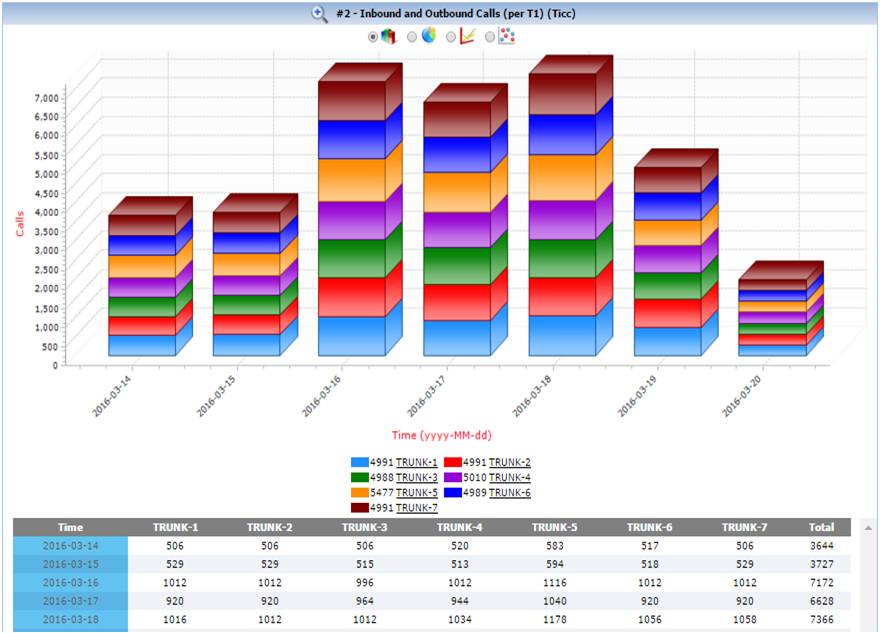
The below graph shows the Inbound vs Outbound Calls over T1 ISDN Trunk KPIs.
NetSurveyorWeb™ KPIs
 Back to Newsletter Index Page