Newsletter: GL Announces PacketScanWeb™ Software
(Real-time Network Monitoring System for VoIP Networks)
Welcome to a February, 2010 issue of GL Communications' newsletter providing information and insight into our PacketScanWeb™ software - A real-time network monitoring system for VoIP networks.
Overview
PacketScanWeb™ along with GL's PacketScan™, Listener, and Oracle database, provide the essential elements for a centralized packet monitoring system.
PacketScan™ is a powerful tool that captures live IP traffic, and segregates into SIP, H323, Megaco, or MGCP type calls. Hundreds of calls can be monitored in real-time including detailed analysis of selected voice band streams.
PacketScanWeb™ is a network monitoring extension of PacketScan™, wherein multiple PacketScan's monitor and provide statistics to a central database. With PacketScanWeb™, users can assess in real-time various network nodes using a simple web based interface.
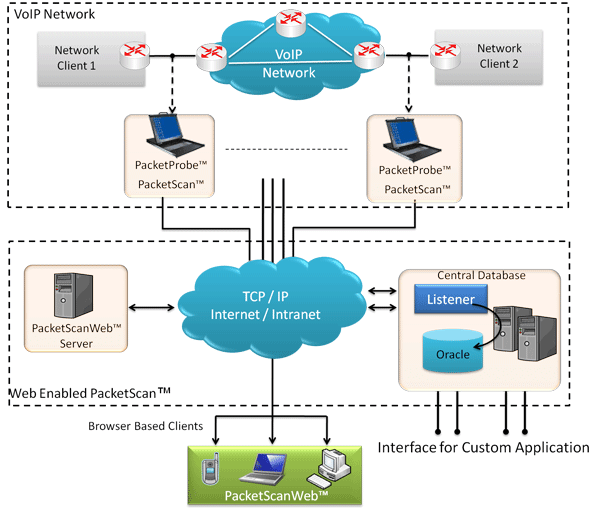
Architecture
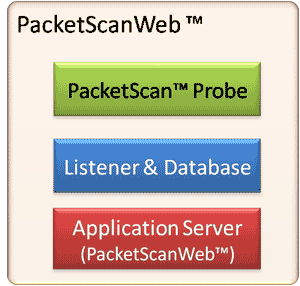
PacketScanWeb™ has three-tier architecture. Each PacketScan™ probe in layer 1 captures and transmits measurements and statistics to the central database. This second layer provides a means for storing the captured statistics. The third layer is the Application Server, where the data presentation logic is contained.
Using the Application Server
Using any browser-capable-device, you can access the results from anywhere in the world. The Real-time Data will be displayed as shown in figure below.
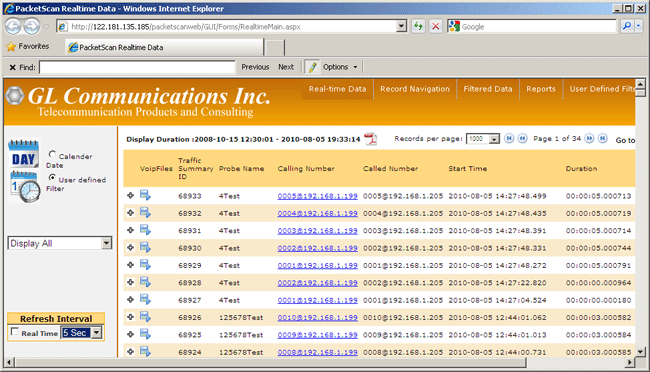
This above screenshot simply displays details of all calls in database captured by various probes. It provides various statistics such as, Probe Name, Calling/Called Number, Start Time, Call Duration, Session Request Delay (ms), Session Disconnect Delay (ms), Originating IP Address, and Destination IP Address.
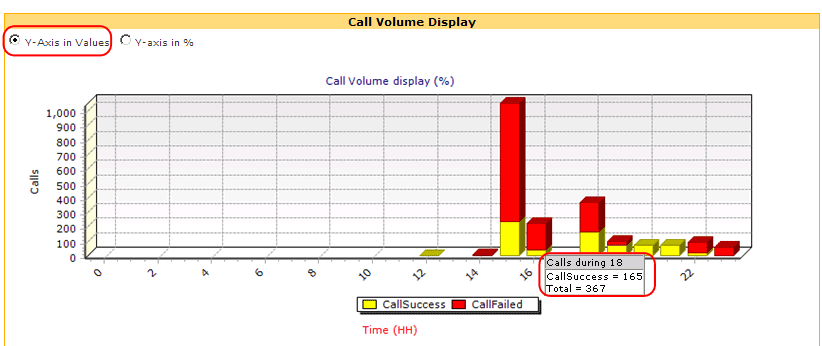
Graphs & Reports
Reports view provides an overall summary of the captured packet traffic over the entire network with the help of useful graphs such as Call Volume Display, Average Mean Opinion Score (MOS) Display, Call Completion Ratio, Call Failure Cause, Session Request Delay (SRD), Failed Calls Display, Calls Answered Display, and Average Paid Minutes Display.
Sample of screenshot of Call Volume Display
Main Features
- Accessible remotely via browser based clients
- Multi-user support, and user-friendly interface
- Database stores the real-time and historic data collected
- Supports interfacing with Oracle database
- Provides database query methods to gather status, statistics, events & query results
- Results are displayed both in tabular and graphical formats
- Provides call details such as Call Graph, Frame Summary and Frame Decodes
- Custom Filters (Day, Time, Called/Calling Number, Probe, Payload, Duration...)
For comprehensive information on the application, please visit PacketScanWeb™ web page.
 Back to Latest News Page