Newsletter: GL Announces Enhanced NetsurveyorWeb™
(Web based network surveillance system for TDM Networks)
Welcome to another September, 2012 issue of GL Communications' newsletter providing information and insight into our enhanced NetsurveyorWeb™ software - A web based network surveillance system. The NetSurveyorWeb™ is a web-based client that can connect to SS7 / ISDN / GSM / GPRS probes through a web server that facilitates display of call data records using a web interface.
Overview
The SS7 network is the backbone for fast and efficient signaling irrespective of network type - whether wireless, wired, or VoIP. Also, the inherent database features of SS7 make today's advanced intelligent features and services a reality. To keep pace with this evolution, GL has enhanced its SS7 monitoring and diagnostic system. Not only can it be used for billing verification, remote protocol analysis, and traffic engineering, but now it can also provide key performance indicators, failure analysis, and call trace capability, to name a few.
A network operator, service provider, or equipment manufacturer must have the means to perform the above surveillance tasks remotely, automatically, and non-intrusively. Fortunately, the network backbone contains a wealth of information that can be monitored and collected to support these activities.
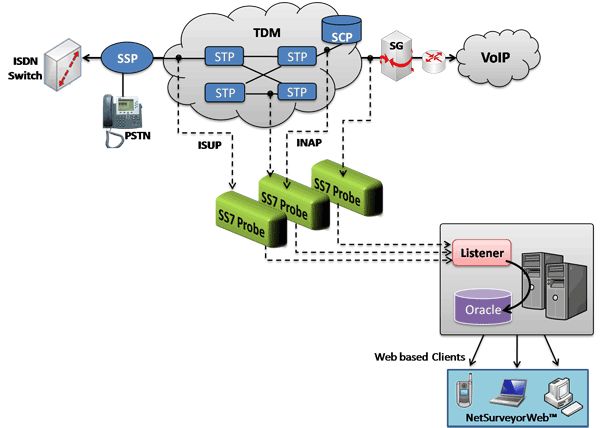
GL's TDM Network Monitoring System uses an open three tier distributed architecture driven by non-intrusive hardware probes, intelligent software, and a database engine. The architecture is shown above and consists of a scalable and flexible system, so the user can use it for multiple sites and various applications. T1/E1/T3/E3 Probes are deployed in the field to monitor various protocols and conditions, which are then collected at a central site into a database. Data records are stored into a centralized database (Oracle) using ODBC. With the use of web server, the remote / local monitoring can be accessed using simple web browser interface such as NetSurveyorWeb™.
Key Benefits of NetsurveyorWeb™
- Ability to identify and analyze network trends using Key Performance Indicators (KPI's)
- Automatically alert users when "Calls of Interest" occur
- Flexible report generation
- Comprehensive analysis from overall network health to detailed protocol monitoring
Other Features
- Access real-time data and historic remotely via browser based clients
- Set alarm conditions and generate alerts of different types like email alert, visual alert, audible alert, or even log into tables for future analysis
- Reports are displayed both in tabular and graphical formats; customize reports and graphs based on SQL queries
- Graphs provided for Call Completion Ratio, Link Name Message Counters, Time Duration Message Counters, and Disposition Count
- Real-time data displays information such as called number, calling number, source & destination IP address, RTP packet details, call flow graph, frame decodes and more
- Apply single or multiple filters for data analysis; use logical operators between filters
- Ability to export both graphical and tabular reports view as PDF
- Ability to export the call detail records displayed based on time filter or record index as PDF and CSV
Typical Applications
- Call Detail Records, fraud detection and location, remote protocol analysis and troubleshooting, real-time signaling monitor, traffic optimization engineering, statistics
- Determine actual call signaling routes to verify network functionality under all situations including congestion and loss of SS7 nodes
- Revenue and billing verification, alarm monitoring, intrusive testing
- Quality of service measurements, call trace and recording
NetsurveyorWeb™ Graphical User Interface (GUI)
Call Detail Record (CDR) Display
The CDR Display provides visibility into each individual call. All KPI information is shown and each call can be investigated. Flexible filtering can help organize and identify "Calls of Interest".
The Frame Summary detail of any calling number includes the following columns - Frame Number, Time Stamp, Probe Name, Card, Linkname, Linkname Directional, TS1, TS2, CIC, SLS, OPC, DPC, ISUP Message Type, Calling Number, and Called Number.
Each Call is also depicted by message sequence, which gives ladder diagram of the call flow between the Called and the Calling numbers. This call flow graph allows easy verification of the status and the messages exchanged in a call. Users can highlight any messages in the ladder diagram and observe the corresponding detail decoded message details. A pictorial representation of Call Flow is shown below.
Custom Filter
- Filter call records based on various filter parameters such as Probe name, Call ID, Link Names, Calling Number, Start Time, Duration, Timeslot, OPC, DPC, and so on
- Save, load / delete filter profiles
- Edit & update already existing custom filter profiles
- Apply one or more custom filters
- Apply logical operations between parameters of a filter or between multiple filters
Graphs and Reports
Reports view provides an overall summary of the captured packet traffic over the entire network with the help of useful graphs such as Call Completion Ratio, Link Name Message Counters, Time Duration Message Counters, and Disposition Count. Reports are also available in a tabular format for each of the plotted graph. The reports can be displayed for filtered data by using the Date/Time Filter options.
Essential Components of Network Monitoring System
- T1 / E1 Hardware probes: Gathers signaling details non-intrusively and forwards call detail records (CDRs) and statistics to a central database. T1 / E1 Probes non-intrusively monitor physical lines of the network. The probes connect via TCP/IP to ODBC compliant real-time database loader. Only precise and filtered data (user selectable) is collected into the centralized database.
- Central database: Stores the data collected by the probes. Records are stored into a relational database (Oracle) using ODBC. Interface between the probes and the database is well defined and is called "Listener". Listener is located at the central site and is responsible for listening to the streaming data from probes and entering into the database (usually Oracle). Listener is modifiable and supportable with MySQL.
- WebServer: Provides real-time and historic views of the data through various 'browser based' clients
- NetsurveyorWeb™: The NetSurveyor™ is a user-friendly web-based client which accesses the results provided by the GL's SS7 and ISDN signaling probes through a web server. As depicted in the screenshot below, one can view real-time and historic data including call ID, probe name/location, call disposition, called and called number, and call duration.
- Modular and distributed architecture is capable of theoretically 'infinite capacity'.
For more information on the product feature, please visit NetsurveyorWeb™ web page.
 Back to Newsletter Index Page