Newsletter: New PacketScan™ with Video QoS
Welcome to a September 2010 issue of GL Communications Newsletter providing information on the latest enhancements introduced to our PacketScan™ software, an IP/VoIP traffic Analyzer.
Overview
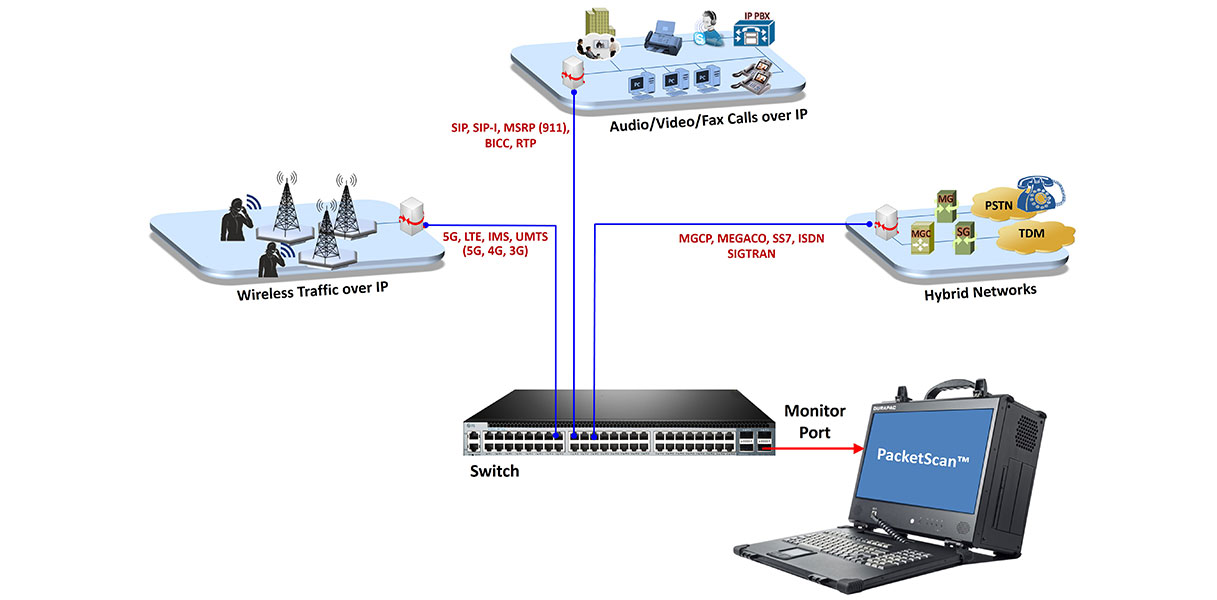
PacketScan™ is a powerful software tool that features real-time capture and monitoring of IP, VoIP, and now IP based Video traffic:
- segregates, captures, and collects statistics on VoIP calls (H.323, SIP, MGCP, Megaco, T.38, and others),
- monitors QOS (quality of service) on voice and video calls,
- permits analysis of adherence to protocol standards for the system under test or observation,
- provides graphical presentation of analysis, including ladder diagrams of protocols
The application can also monitor, report, analyze, and capture calls for infinite time, limited only by the finite space of your hard disk or network hard drive! It can work with PacketScanWeb™, a central monitoring system for a comprehensive view of network performance. It features rich graphics, ladder diagrams, CDRs (Call Data Records), and compatibility with almost every CODEC.
We continue to improve PacketScan™ with features that our customers request. The enhancements recently incorporated are:
- PacketScan™ has been enhanced to send H.323 CDR to central Database. This permits monitoring network performance through web based clients such as PacketScanWeb™.
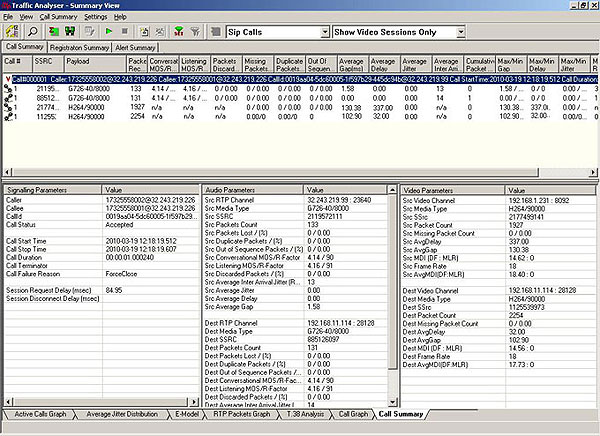
- PacketScan™ can now calculate Video Statistics such as Media Delivery Index for video sessions. The Media Delivery Index (MDI) is a set of measures that can be used to monitor both the quality of a delivered video stream and to show system margin for IPTV systems by giving an accurate measurement of jitter and delay at network level (Internet Protocol, IP), which are the real causes for quality loss. The Media Delivery Index is typically shown as two numbers separated by a colon the Delay Factor (DF) and the Media Loss Rate (MLR).
- The video stats available under "Call Summary" tab in PDA are: RTP Channel IP, Port pair, Codec Info, SSRC, Frame Count, Packet Count, Packets Lost, Duplicate Packets, Out of order Packets, Frame Rate, Media Delivery Index (Delay Factor : Media Loss Rate), Average Media Delivery Index
- Traffic Summary sent to central database now includes SIP-Origination IP address, i.e. Callers IP address.
- Along with Traffic Summary, Frame Summary and Frame Octets details are also sent to central database.
Other Features Include:
- Protocol summary information and binary frame data can be sent via TCP-IP connection to a Database Loader to load data into a database. The provided options are:
- Send Call Detail Records: If this option is selected, all the call detail records will be sent to the remote database.
- Send Traffic Summary: If this option is selected, all the details in Summary View Packet Data Analysis will be sent to the remote database. Traffic Summary sent to central database now includes SIP-Origination IP address, i.e., Callers IP address, Destination IP address, Packet type, and so on.
- SIP Performance Metrics
Additional SIP performance metrics have been provided in statistics counters for Sip calls and are: Session Establishment Ratio, Session Establishment Effective Ratio, Session Defects, Ineffective Session Attempts, Session Completion Ratio, Session Request Delay, Session Disconnect Delay and Registration Request Delay. - Call Summary Tab
In Packet Data Analyzer (PDA) portion of PacketScan™, a new tab has been added that displays Signaling and Audio Parameters for the selected call (SIP, H323, MEGACO Calls). - Save Call
Save Call feature has been enhanced to save the captured trace along with a PCAP compatible file. - Alert Summary
PacketScan™ has been enhanced to generate alerts when a particular vital parameter goes beyond a specified value. The user can specify the criteria based on which the alerts are to be generated. The alerts can be set by selecting an option in Alert Summary and in Triggers and Action Settings.
Alert Summary tab provides summary of the each alerts that have occurred during the analysis. Each summary has the following columns: Call#, Protocol, Message, Type, Threshold, Value, Caller, Callee, CallId. - T.38 Analysis
T.38 has been enhanced to reassemble the fragmented data and to identify the T.30 message from it. Identified T.30 message is displayed in the T.38 ladder diagram. - VQMon Setting
VQMon Setting is enhanced with an option to select the Japan or North America International standard code. These standards are followed in calculating MOS scores based upon R-Factor scores. - There is display now for bandwidth consumption for VoIP traffic and also for protocols like SIP, RTP, MEGACO and H.323. All are displayed in PDA.
For comprehensive information on the application, please refer to PacketScan™ web page.
 Back to Latest News Page