Enhanced T3 E3/T1 E1 Analyzer
with SNMP Trap Notification
Welcome to another January 2017 issue of GL Communications' Newsletter providing information and insight into our enhanced T3 E3/T1 E1 Analyzer with Rackmount version that includes T3 T1 Physical Layer Analyzer and SNMP Trap Notification.
Overview
A T3 line is an ultra-high-speed signal capable of transmitting data at rates up to 44.736 Mbps. An E3 signal is situated at the third level within the Plesiochronous Digital Hierarchy (PDH) and has a bit rate of 34.368 Mbps. With the advent of the internet, T3 (DS3) and E3 can be used to transport not only data, but also packetized voice, and packetized video. Example protocols include Asynchronous Transfer Mode (ATM), PPP, HDLC, and Frame Relay.
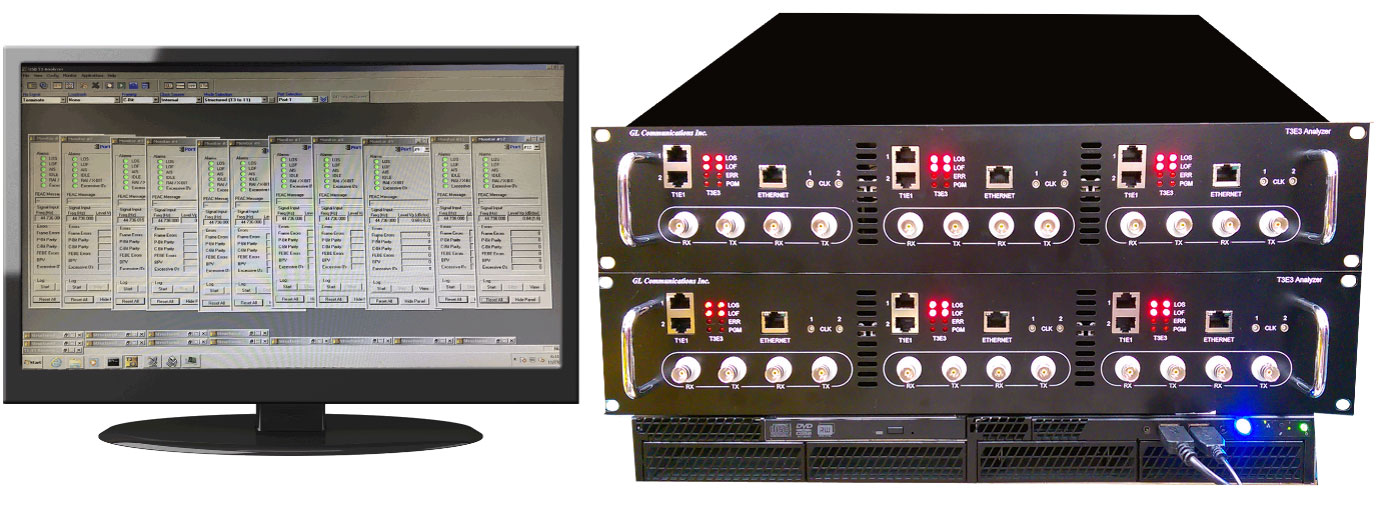
GL's USB T3 E3 Analyzer is now available in 2U Rackmount platform. The Rack unit supports 6 T3 E3 ports (6 * 672 DS0s) per unit, whereas a portable USB-based unit supports 2 T3 E3 ports per unit. Multiple rack units can be stacked together for greater scalability.
T3 or E3 has two flavours: Channelized (structured) and Unchannelized (unstructured). In Channelized (Structured) form, a channelized T3 signal carries 28 T1 signals, each operating at a rate of 1.544 Mbps and a channelized E3 signal carries 16 E1 signals each operating at a rate of 2.048 Mbps. In Unchannelized (Unstructured) form, T2s or T1s or E2s or E1s DO NOT exist within T3 or E3. Instead, most of the capacity within T3 (44.736 Mbps) and E3 (34.368 Mbps) is used for data, with a small amount for overhead.
Enhancements
The enhanced T3 E3 Analysis software complements the hardware and supports simultaneously monitoring up to 12 x T3 E3 lines (2x Rack units or 6x Portable units) for all alarms, frame errors, signaling and data.
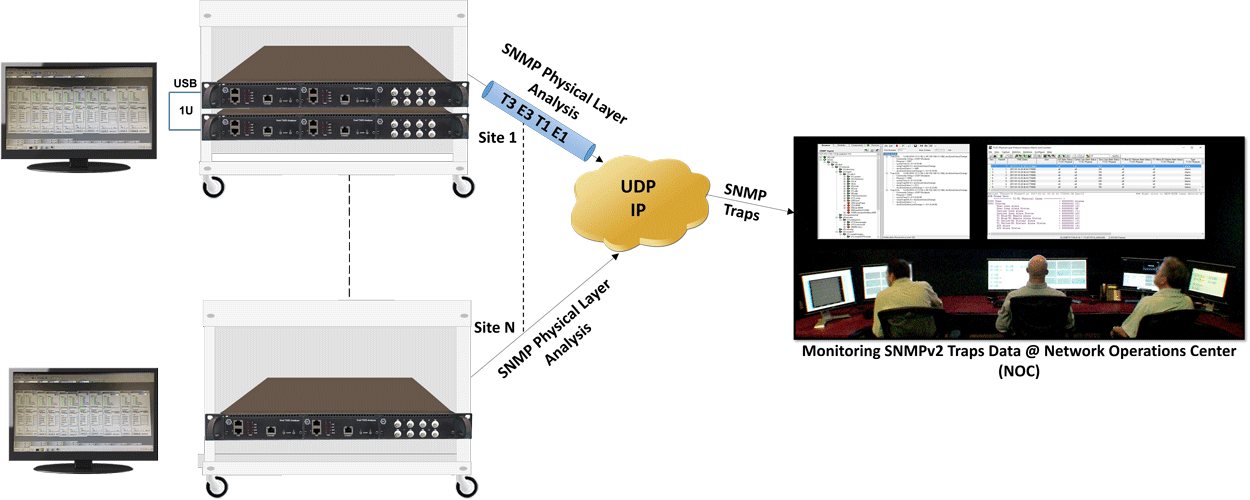
Physical Layer Analyzer and SNMP Trap Notification
For monitoring provisioned DS0s on a channelized T3, one just adds the Channelized T1 E1 Analyzer software to the system. Then the T1s within the T3s can also be analyzed in software, 12 x T3 E3 lines (=12*28 T1s) constituting 336 full duplex T1s, or 672 simplex T1s monitored simultaneously using a single Rack unit. With additional applications, such as record-only, one can also record traffic at DS0 levels.
The enhanced USB T3 E3 Analysis software, also comes with T3 T1 Physical Layer Analyzer system that monitors all physical layer "T3s" and "T1s" within the T3s" connected to it via monitor level (non-intrusive - 20 dB attenuated) T3 signals. Alarms monitored at the DS3 level and at the DS1 level are packetized and sent via TCP/IP to central database or via Simple Network Management Protocol (SNMP) to network operation center.
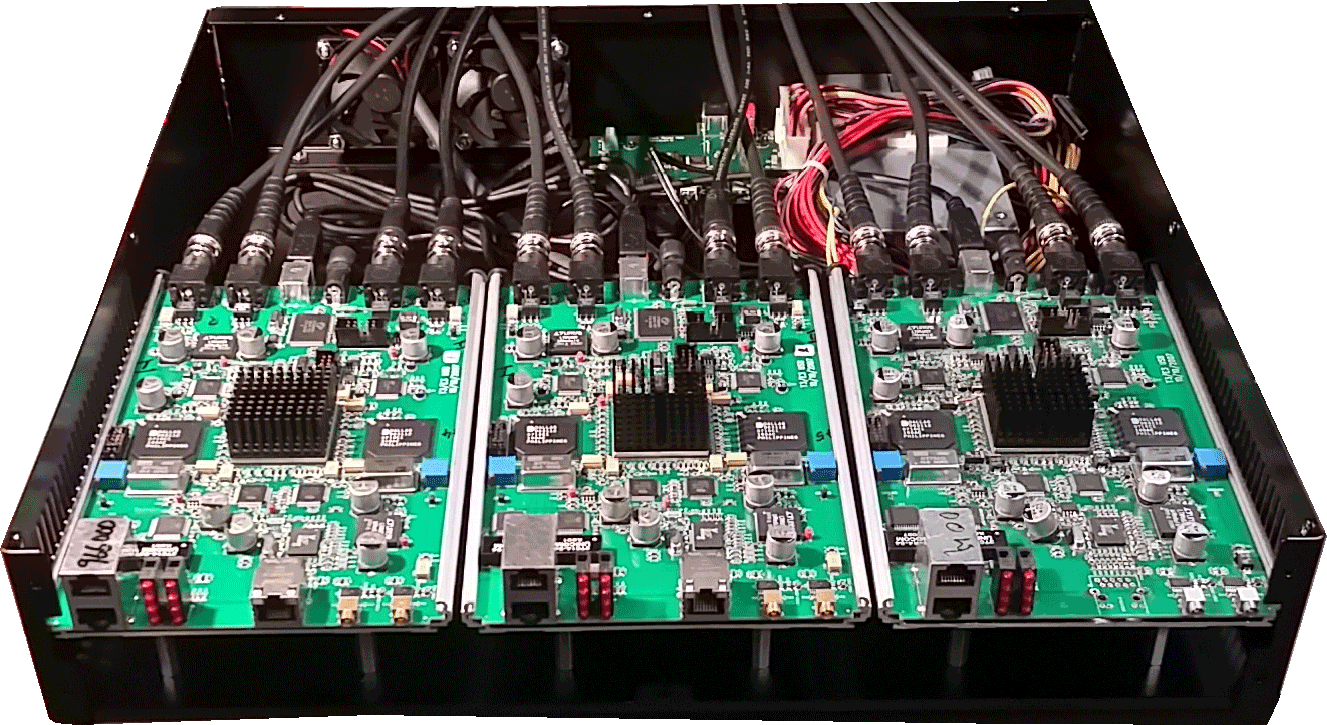
Top view of Rack Enclosure
T3 E3 Physical Layer Analyzer
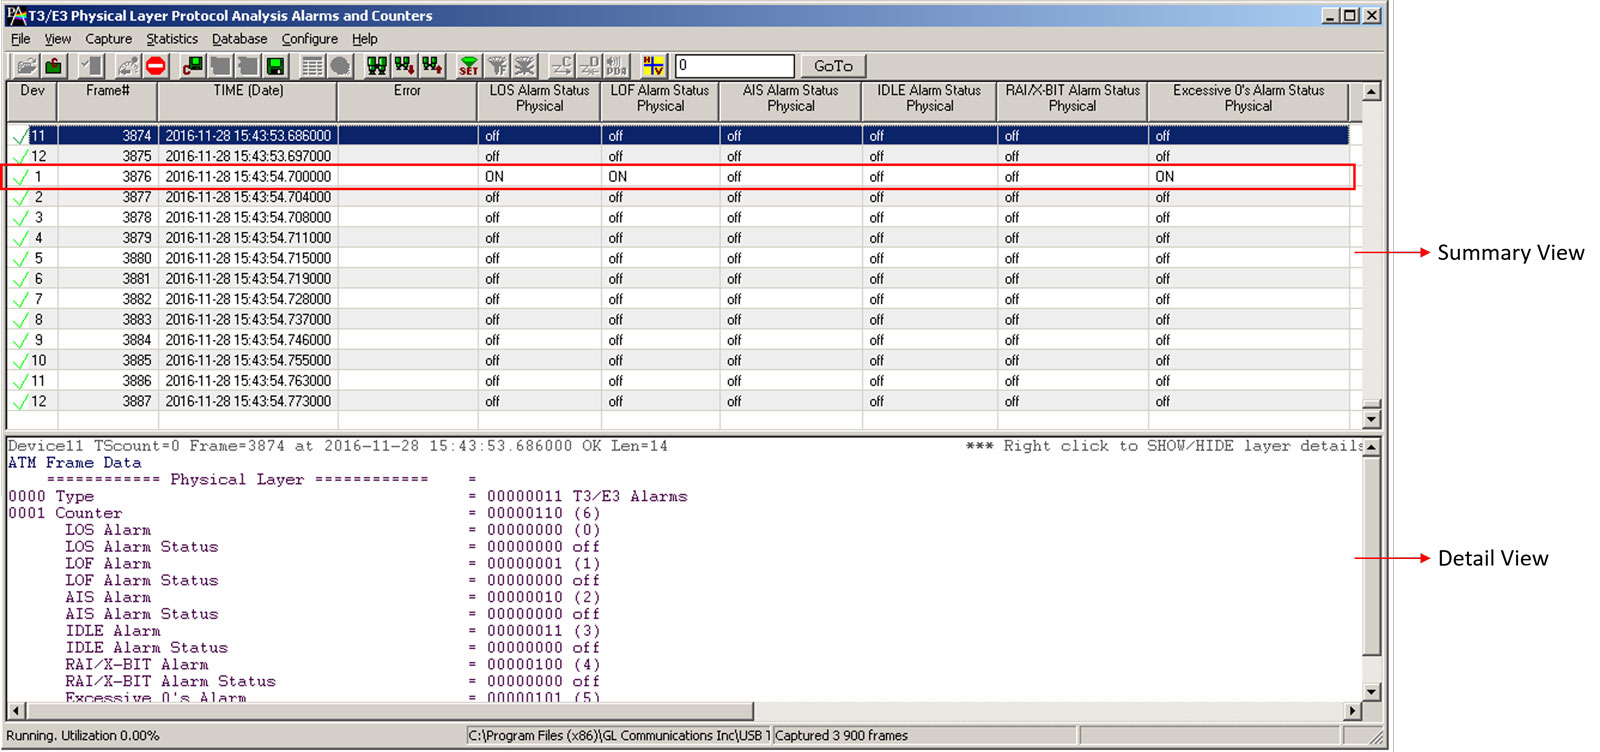
Alarm Status in T3 E3 Physical Layer Analyzer
Physical Layer Analyzer within the T3 E3 Analysis software is used to capture and monitor Loss of Signal (LOS), Loss of Frame (LOF), Alarm Indication Signal (AIS), Idle, Remote Alarm Indication (RAI), and Excessive 0's alarms over T3 E3 lines. The Alarm Status ON, indicates that there is an alarm. If the status is OFF, then there is no alarm. Observe in the figure below that real-time capturing process is automatically capturing T3 Alarms. In the Summary View for Device 1, LOS, LOF and Excessive 0's alarm status is ON indicating there is an alarm. For AIS, IDLE and RAI alarm status is OFF indicating there is no alarm.
DS3 SNMP Traps in MIB browser
The SNMP option within the Physical Layer Analyzer supports SNMP v2 version to send the DS3 alarms and errors from T3 E3 Physical Layer Analyzer on the configured IP Address and UDP Port. These alarms can then be monitored using any SNMP or Management Information Base (MIB) browser. When the alarm status changes, then SNMP Traps will be sent to the Network Operations Center (NOC).
Observe in the below figure for the SNMP DS3 Traps captured in NU Design MIB Browser.
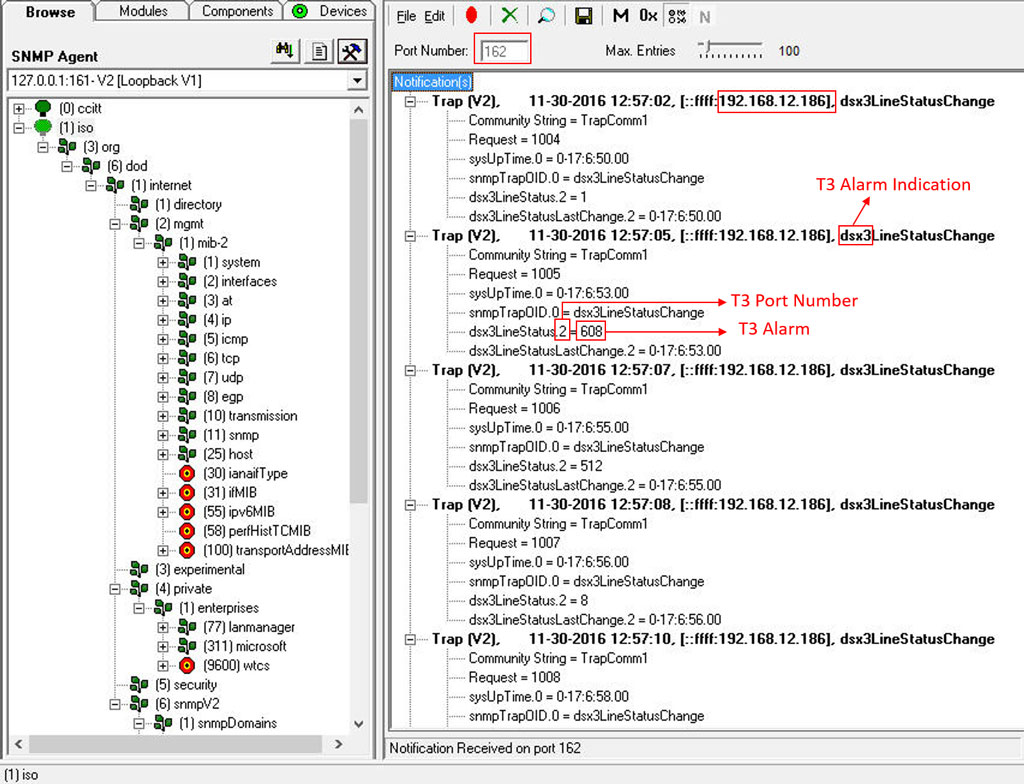
Alarms Monitored on SNMP Ports
The above figure depicts SNMP DS3 Traps captured on the IP Address 192.168.12.186 with the UDP Port 162. In the figure, DSX3 indicates the alarm trap belongs to T3. dsx3LineStatus.2=608, here, "2" indicates T3 Port Number and "608" indicates T3 alarm.
The alarm 608 is a summation of Loss of Frame, Loss of Signal, and Loss of Multiframe alarm values as shown in the below table.
| 32 | dsx1LossOfFrame | Near end LOF (a.k.a. Red Alarm) |
| 64 | dsx1LossOfSignal | Near end Loss of Signal |
| 512 | dsx1RcvFarEndLOMF | Far end sending TS16 LOMF |
T1 E1 Physical Layer Analyzer

Alarm Status in T1 E1 Physical Layer Analyzer
Physical Layer Analyzer within the Channelized T3 E3 Analyzer software allows capturing Sync Loss, Carrier Loss, Frame Error, Blue Alarm, AIS, and Yellow Alarms over T1 lines as shown in the figure below.
DS1 SNMP Traps in MIB browser
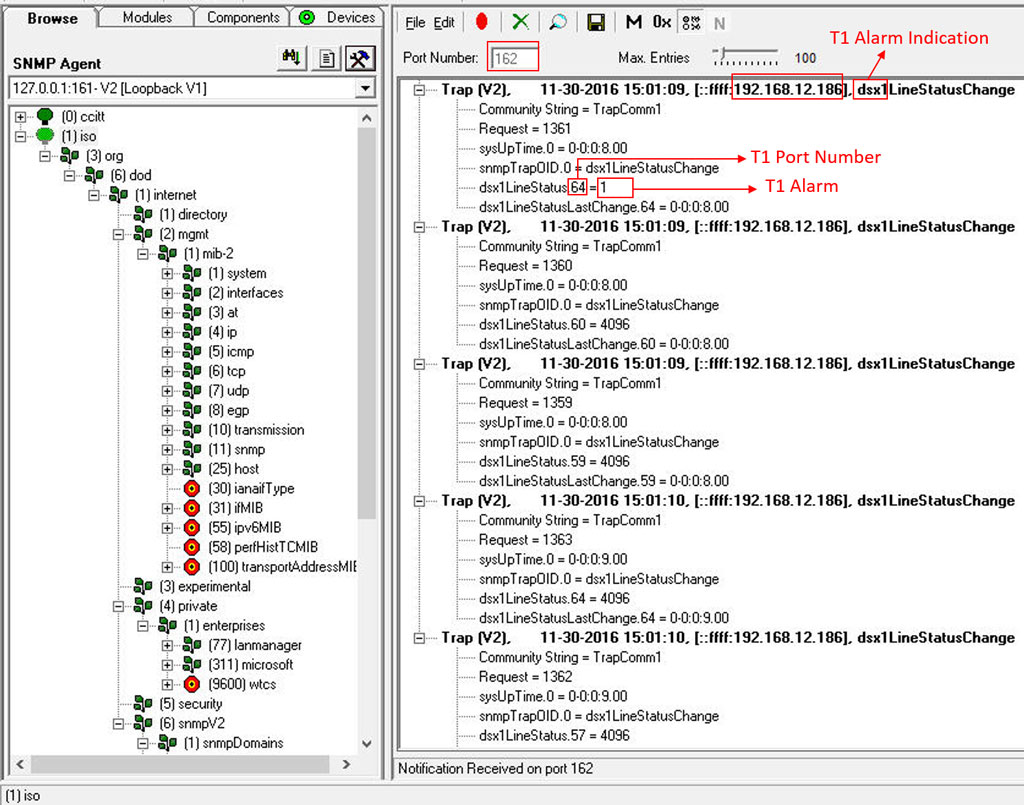
The SNMP option within the Physical Layer Analyzer supports SNMP v2 version to send the DS3 alarms and errors from T1 E1 Physical Layer Analyzer on the configured IP Address and UDP Port. When the alarm status changes ON/OFF, then SNMP Traps will be sent to the NOC.
Observe in the below figure for the SNMP DS1 Traps captured in NU Design MIB Browser.
Alarms Monitored on SNMP Ports
The above figure depicts SNMP DS1 Traps that are captured on the IP Address 192.168.12.186 with the UDP Port 162. In the figure, DSX1 indicates the alarm trap belongs to T1 dsx1LineStatus.64=1, here, "64" indicates T1 Port Number and "1" indicate presence of T1 alarm.
 Back to Newsletter Index Page