Jitter Measurement
Jitter Measurement application is included with T1 E1 Basic Software
Overview
Jitter is the time discrepancy between the time of arrival of a clock pulse and its theoretical arrival time. Jitter arises from a number of sources, including aging of clock circuits, thermal and loading effects, Doppler shifts, and de-multiplexing from higher bit rate data streams. Since no clock is perfect, all clocks exhibit some degree of jitter. Jitter is always computed by comparing a clock signal (called the "nominal clock" or the "clock under test") with a clock having superior accuracy (called the "reference clock").
Now, Jitter Generation and Measurement, Pulse Mask Compliance (XX012) application is available as a part of basic applications in T1 E1 analyzer.
Jitter can be measured in terms of the time duration of a single clock pulse. This time interval is referred to as a "Unit Interval" or UI. For T1 systems operating at 1.544 Mbps, 1 UI equals 647 nanoseconds. For E1 systems operating at 2.048 Mbps, 1 UI equals 488 nanoseconds. UI durations for higher rate bit streams are proportionately smaller.
Clock deviations are grouped into ranges depending on the frequency of the cumulative jitter:
- Jitter: Small amplitude fast variations in clock pulses with frequency of variations above 10 Hz.
- Wander: Larger amplitude slow variations in clock pulses with frequency of variations below 10 Hz.
To these, GL Communications Inc. recognizes the following groupings:
- Drift: Very slow variations in a clock signal (below 1 Hz).
- Frequency Offset or Deviation: A permanent or steady-state difference in clock rates. It will eventually result in either frame slips (bit insertions or deletions) or in loss of synchronization of network elements.
These classifications are important because clock deviations in the various ranges present different problems for network equipment.
GL's Jitter Measurement application allows one to accurately measure jitter associated with T1 or E1 signals. The jitter evaluation is done by either a tick-by-tick or a cumulative basis. Technically, cumulative jitter is of primary importance as network equipment must cope with the cumulative jitter. However, tick-by-tick measurements are also presented in this module. In addition to these, the application recognizes the very slow variations in a clock signal (below 1 Hz), and the Frequency Offset or Deviations in clock rates.
In addition, GL's Jitter Generation application allows generating jittered output T1/E1 signal with the user-selected frequency and amplitude in compliance with standards such as G.823. In conjunction with GL's Jitter Measurement application, Jitter Generation may be used to test jitter transfer. Jitter transfer measurement is required to confirm that there is no amplification of jitter by network elements (NEs) in the transmission system.
The jitter measurement capability is available in GL's Dual T1/E1 Express (PCIe) boards, tProbe™ T1/E1 Analyzer units, and Universal T1 E1 boards.
GL’s Pulse Shape Measurement software is also available as a part of Jitter Generation and Measurement application. It can determine if the pulse shape fits within a “pulse mask” as specified by standards ITU G.703 and ANSI T1.102-1993.
Main Features
- Easy, accurate, visual pulse shape and jitter measurement for T1/E1 signals (only available with Dual T1/E1 Express (PCIe) Cards, Universal T1/E1 cards, and tProbe™ T1/E1 analyzer).
- Provides an option to select T1 or E1 port for monitoring and the frequency range of interest.
- Supports One-Shot capture and Repeated Capture options for jitter measurement.
- CSV files are generated for further analysis using spreadsheet one containing the raw clock counts, and raw jitter counts, the other file containing the FFT data which can be used within a data analysis tool to plot the jitter frequency spectrum
- Graphs generated can be saved to a file, zoomed-in/zoomed-out, printed, and more
Theory of Operation
GL's Jitter Measurement module computes jitter by comparing the incoming signal against a much higher rate reference clock. The nominal clock signal (the "Clock Under Test" or "CUT") is recovered from the incoming data stream. The number of reference clock ticks for each incoming nominal clock tick thus extracted is captured for analysis. Reference clock values are captured in blocks of 2048 consecutive measurements. The strategy is illustrated in the following figure.
When computing the jitter frequency spectrum, the frequency resolution is dependent on the nominal clock rate and the number of nominal clock tick values. Frequency precision is given by the following formula:
Where,
Nc is the nominal clock rate in bits per second
Nyq is the Nyquist frequency corresponding to that nominal clock rate
1024 is the number of
frequency "bins" in the computed frequency spectrum.
User Interface
The user interface provides various pages that display the jitter measurement results in decimal and graphical formats.
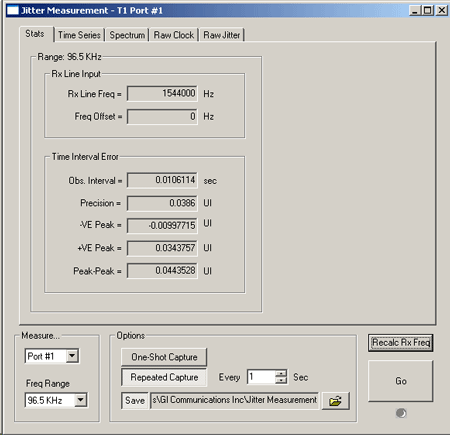
Statistics (Stats) Page - The Stats page displays measurement values for the current 2048 point measurement. The measurement period constitutes the "observation interval" for TIE peak-to-peak jitter measurement purposes. Constitutes the observation interval, T1/E1 Precision value, ± VE Peak value, and peak-to-peak value for measurement purposes.
In addition to jitter measurements, the steady-state Rx Line Frequency and Frequency Offset are also displayed.
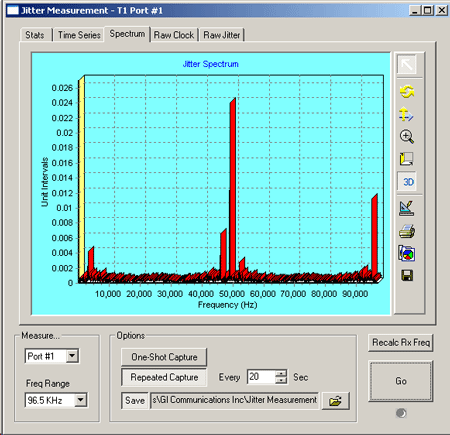
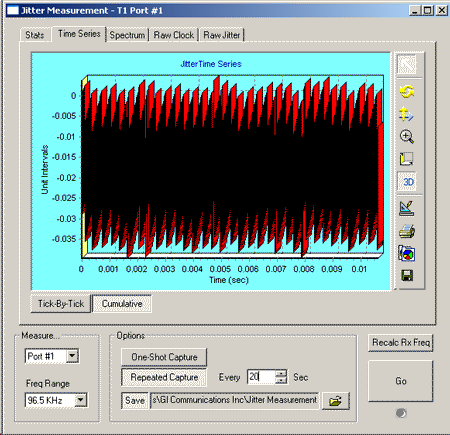
Time Series and Spectrum Page - The time series displays the captured jitter values on either a cumulative or tick-by-tick basis. The frequency spectrum of the captured jitter values will be displayed in the spectrum page. The Peak-to-peak jitter is displayed as a function of jitter frequency.
Other Related Applications
WCS Jitter Measurement
The Jitter measurement can be performed through commands with the Windows Client-Server application. The jitter ranges can be monitored on a specified port using simple commands by a client application.
For more information refer to WCS Jitter Measurement and Pulse Mask web page.
Pulse Mask Compliance Testing
GL's Pulse Mask Display software helps to determine if the pulse shape fits within a "pulse mask" as specified by standards ITU G.703 and ANSI T1.102-1993. The software is available in both visual and tabular formats. Tabular formats are convenient for automation and scripted test environments.
For more information, visit Pulse Mask Compliance Testing web page.
Resources
Note: PCs which include GL hardware/software require Intel or AMD processors for compliance.
Please Note1: The XX in the Item No. refers to the hardware platform, listed at the bottom of the Buyer's Guide, which the software will be running on. Therefore, XX can either be ETA or EEA (Octal/Quad Boards), PTA or PEA (tProbe Units), XUT or XUE (Dual PCIe Express) depending upon the hardware.| Item No. | Item Description |
| XX012 | Pulse Mask Compliance, Jitter Generation, and Jitter Measurement (Available as a part of basic applications in T1 E1 analyzer) Easy, accurate, visual pulse shape and jitter measurement for T1 E1 signals |
| Related Hardware | |
|---|---|
| XTE001 | Dual T1 E1 Express (PCIe) Boards (requires additional licenses) |
| PTE001 | tProbe™ T1 E1 Analyzer |
 Back to List of T1E1 Basic and Optional Applications Index Page


