Voice and Data Quality Testing with Centralized Monitoring
GL is pleased to announce the latest edition of our newsletter, which provides valuable insights into our Centralized Voice, Video, and Data Quality Testing Solution – WebViewer™. With GL's WebViewer™, you can access real-time measurements of voice, video and data quality testing from a convenient web-based dashboard.

Overview
GL’s WebViewer™ is a robust web-based network quality and analysis tool to ensure optimal performance and reliability. WebViewer™ uses any web browser to display and access, in real time, all individual Voice, Data and Video Quality testing tools such as vMobile™ and VQuad™. The status of each operational test is displayed along with customized user statistics and graphical depiction of the testing results. In addition, using the WebViewer™ the user has full remote access to any node connected to the network.
GL's VQuad™ and vMobile™ offers automatic call control across multiple networks and supports real-time transmission/capture of voice files from various nodes. Recorded voice files are automatically transferred to the Central System where GL's Voice Quality software (VQT) analyzes and generates results using the POLQA (ITU-T P.863) or PESQ (ITU-T P.862) algorithms. The GL VQT algorithm delivers additional analytical metrics, such as jitter, clipping, and level measurements, providing comprehensive insights into audio quality.
Web-Based Data Query and Display:
GL's WebViewer™ empowers users to access Voice, Data, and Video Quality Measurements, Call Control Events, Errors, and Statistical results with ease, using a simple web browser. All results are retrieved from a central MySQL database, ensuring real-time and historical data availability.
Efficient Data Query and Customized Views with WebViewer™:
With WebViewer™, you can easily query results from individual VQuad™/vMobile™ nodes, as well as Voice Quality measurements, One-Way and Round-Trip Delay measurements, Data Quality Tests, Video Quality Tests, Call Control events including Call Failed, Call Dropped, and FAX Events. Utilize user-specified search criteria and time filters to retrieve specific data.
Results are presented in both tabular and graphical formats, allowing for clear visual representation. Users can export all results to CSV, PDF, or Excel formats. Moreover, a user-customized consolidated view enables the user to customize how the results are displayed including line and bar graphs. Using this feature results can be shown as Average/Min/Max or as percentage. All results within the database are accessible for customized report viewing.
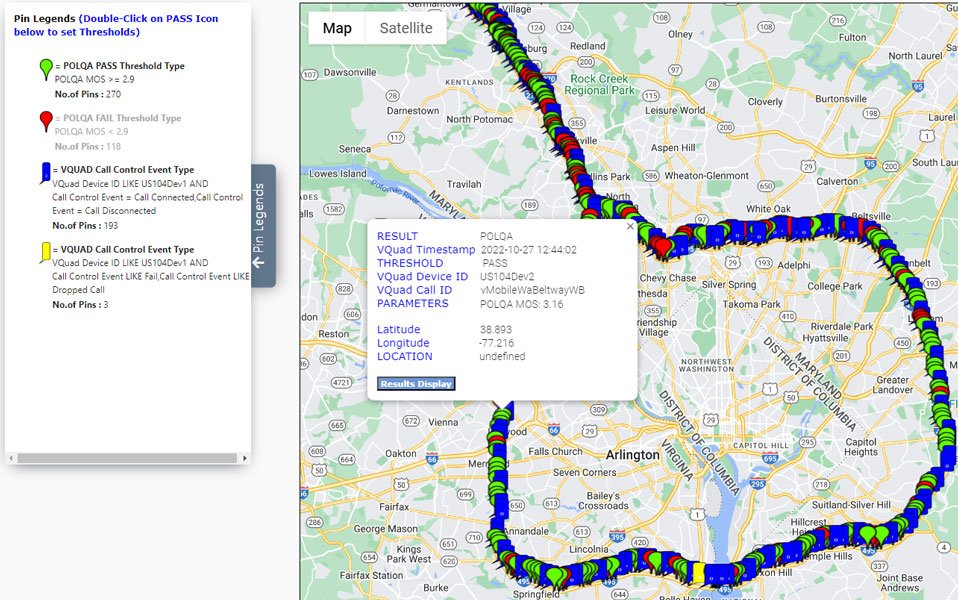
Real-time GPS Plotting along with Quality Testing:
As part of the Drive and Walk test supported by both VQuad™ and vMobile™, the WebViewer™ Google Maps plotting displays user-specified test results with user-customized plotting configuration. This includes individual pin type and color, customized text within the individual pins, and full access to results when clicking on the individual pins. Users can access real-time results during drive and walk testing and while testing at specific locations.
Indoor Tracking System (ITS) with WebViewer™:
WebViewer™ simplifies indoor tracking where GPS is unavailable by plotting vMobile™ and VQuad™, results directly on customer provided JPG floor plan or location diagrams associated with the testing environment. The GL ITS supports walk-tests in underground, remote, or inaccessible areas. This GL solution offers a user-friendly method for conducting efficient indoor or non-GPS accessible testing of radios or mobile phones.
The ITS Viewer, as depicted in the WebViewer™, presents the ITS test route and the test results associated with the VQuad™ and vMobile™ walk test, both Uplink (Circle) and Downlink (Triangle) results.

Scheduling the Reports:
WebViewer™ can manually and automatically create custom reports with graphics and send the reports through email after the test is completed or during any interval (for instance every morning at 9am send a report). These WebViewer™ reports are based on the user-customizable reports which can also include both line and bar graphs. The emailed report can be in PDF, CSV, or Excel formats.
Key Features
- Supports both Oracle and MySQL Databases on Windows® 10 and above Operating System
- Instantly view the real-time status of the entire network and remotely access any node within the network
- Remotely control both VQuad™ and vMobile™ nodes for starting/stopping scripts directly from the WebViewer™ web browser
- Pre-define vMobile™ and VQuad™ nodes and operations within WebViewer™, regardless of their network connection (public or private IP)
- Automatically sends all results from vMobile™ nodes, VQuad™ probes, Voice Quality software, NetTest (Data Testing), Video Conference testing, and FAX applications to the central database
- Seamlessly communicates with nodes and databases, supporting effortless backup, export, and import functionalities
- Easily segregates NetTest results (TCP, UDP, VoIP, Route, HTTP, FTP, DNS, SMS, and Email) and Mobile Device Information results (PhoneInfo, SimInfo, UEInfo) for clear and organized viewing
- Results include VQT (POLQA and PESQ), Call Control (Call Failure, Call Dropped, Call ID), Echo Measurements, Data Test (via Mobile device or PC Ethernet), Delay Measurements, Fax Tx Rx Events, and Video
- Analyze standard measurements and events (Call Control, Time Delay, VQT) through graphical and tabular views
- Export and schedule results, statistics, or custom output reports to *.csv, *.xls, or *.pdf file formats
- Plot results from vMobile™ and VQuad™ Nodes, as well as VQT software on Google Maps using available GPS coordinates during drive or walk testing
- Filter any results view based on specific measurements and call control conditions
- Supports Indoor Tracking (ITS) plotting
 Back to Newsletter Index Page