Overview
GSM being one of the first mobile communications standard, was predominantly over traditional TDM network. It continues to be the default standard in many parts of the world. With recent developments, communications over the Global System for Mobile (GSM) network can be exchanged over TDM transport networks as well as with IP or Ethernet transport services.
GSM networks operate in three different frequency ranges,
- GSM 900 (operates in the 900 MHz frequency range; is used in most parts of the world -Europe, most of Asia, Australia, Africa, Middle East)
- GSM 1800 or DCS 1800 (operates in the 1800 MHz frequency range; is found in a number of countries including France, Germany, Switzerland, the UK, and Russia)
- PCS 1900 or DCS 1900 - ( used in the United States and Canada)
GL Communications supports the following types of GSM analyzers:
- For GSM over IP transport
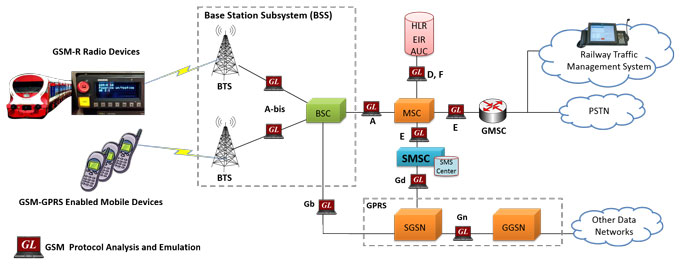
- GL's GSM Protocol Analyzer (PK103) is available as an optional module within PacketScan™ analyzer (PKV100) or PacketScan™ HD analyzer (PKV120/PKV122) upon additional licensing.. With the support of this additional license, PacketScan™ can be used to analyze the protocol exchanged between the MSC & BSC (A-interface) and BSC & BTS (Abis-interface) nodes of GSM network over IP backhaul. Additionally, with the support of PKV105 license PacketScan™ can handle MAP, CAP, and INAP interfaces.
For more details, visit Sigtran Protocol Analyzer Webpage. - For GSM over TDM transport
- T1 E1 Real-time GSM Analyzer (XX150) is available as an optional module within T1 E1 Analyzer. With this software, the T1 E1 Analyzer permits continuous real-time monitoring of are A (Interface b/w BSC and MSC), A-bis (Interface b/w BSC and BTS), Mobis (Motorola Proprietary Interface b/w BSC and BTS and also b/w BSC and PCU), Gs (Interface between SGSN and MSC), Ls / Lb / Lp Interface (Interface between MSC and SMLC), Up (Interface between UNC (UMA network controller) and MS). (Pre-requisites: GL's field proven E1 or T1 internal cards or USB based external units, required licenses and Windows® System)
- T1 E1 Offline GSM Analyzer (OLV150) (Pre-requisites: Hardware Dongles and Windows® System)
GL's GSM Protocol Analyzer is used to analyze GSM protocols, a switching and signaling telecommunication protocol between MSC & BSC, BSC & BTS, MSC & SMLC, UMA & MS. and so on. GSM analyzer also supports decoding proprietary 'Mobis' Interface (Motorola equivalent of the GSM A-bis interface) with additional license XX151 between BSC (Base Station Controller) - BTS (Base Transceiver Station) and BSC (Base Station Controller) - PCU (Packet Controller Unit).
GL’s GSM Protocol Analyzer supports complete analysis, decode and monitoring of GSM-R (GSM-Railway) - an international wireless communications standard for railway communication and applications.
GSM analyzer collects physical and line level status and performance information, voice, data, protocol, statistics, and transmit information to a central / distributed Network Management System (NMS).
These probes now supports Packet Data Analyzer with recording capabilities. Packet Data Analysis (PDA) is an outstanding tool for live monitoring of signaling and traffic over TDM. Allowing users to monitor live TDM networks including capture, analysis, and reporting of every call-in detail.
GL’s NetSurveyorWeb™ (PKV170) a central system comprised of a database engine and web server monitoring systems facilitate real-time analysis, historical storage, retrieval, querying, and display of Call Detail Records (CDRs) by non-intrusively connecting to TDM, Optical, or IP networks.
It also offers NetSurveyorWeb™ Lite (PKV169) a cost effective, simple Plug & Play connection, which is an integrated and simplified web-based system that is distributed at probe level.
Other interfaces supported include GSM-R (GSM Railways standard), Gs (Interface between SGSN and MSC), Ls / Lb / Lp Interface (Interface between MSC and SMLC), and Up (Interface between UNC (UMA network controller) and MS).
Highlights
- Interfaces supported are A (Interface b/w BSC and MSC), A-bis (Interface b/w BSC and BTS), Mobis (Motorola Proprietary Interface b/w BSC and BTS and also b/w BSC and PCU), Gs (Interface between SGSN and MSC), Ls / Lb / Lp Interface (Interface between MSC and SMLC), Up (Interface between UNC (UMA network controller) and MS).
- Supports decoding of GSM-R as per EIRENE specification (H 22 T 0001 2) and ETSI TS 102 610 standards to verify and monitor GSM-R Network
- Summary View displays MTP2, MTP3 information, GSM Message types, information about various channels used during the call, frequency hopping and so on in a tabular format.
- Decoding of many RR layer non-transparent messages such as "System Information", "Measurement Result", "Immediate Assignment" etc.
- Call Detail View displays call statistics such as number of active/completed calls, durations of the completed calls, Type of Call (e.g. SMS/Location Update/Authentication/Speech Call), IMSI/TMSI associated with each call.
- Call Detail Recording feature includes data link groups that help in defining the direction of the calls in a given network and form logical groups comprised of unidirectional (either 'Forward' or 'Backward') data links.
- For GSM over T1 E1 interface
- Streams can be captured on the selected time slots (contiguous or non-contiguous), sub-channels or full bandwidth.
- Real-time filtering based on the frame length.
- Supports decoding of frames with FCS of 16 bits and 32 bits, or none.
- Recorded trace files can be played back using HDLC Playback application.
- Multiple streams of GSM traffic on various T1 E1 channels can be simultaneously decoded with different GUI instances.
- Frames can be transmitted or captured in either, n x 64 kbps, or n x 56 kbps data channels.
- The variations accommodated in the software are inverted or non-inverted data, and byte reversal or non-reversal.
Related Applications
- MAPS™ GSM A Emulator
- MAPS™ GSM Abis Emulator
- MAPS™ MAP Emulator
- MAPS™ SIGTRAN Emulator
- SS7 Analyzer
- SIGTRAN Analyzer
- GSM-GPRS Wireless Lab
GSM-R (GSM Railway)
GSM-R (GSM Railway) is a proven mobile communications standard of ERTMS (European Rail Traffic Management System), the European standard for railway operations. It is used to carry railway-specific voice and data services. It is an extension of the standard GSM signaling protocol and uses frequencies specifically reserved for railway operations.
GL’s GSM Protocol Analyzer adds GSM-R features such as VGCS, VBS, eMLPP, Emergency numbering and Functional numbering etc. GSM Protocol Analyzer also adds User to User Information IE to GSM CC, BCC and GCC protocols to support GSM-R features according to EIRENE specification (H 22 T 0001 2) and ETSI TS 102 610. A GSM-SS layer decode is also added to existing GSM protocol stack to support all the Supplementary Services.
Monitoring GSM-R Services with GSM Analyzer
- Alerting of a Controller (User-to-User Signaling - UUS)
- Presentation of a Functional Number – UUS
- Multi driver Communication – (Multi Party - MPTY)
- Registration and Deregistration of Functional Numbers – (Unstructured Supplementary Services Data - USSD)
- DSD Alarm Notification – UUS
- Enhanced Location Dependent Addressing – UUS
- Shunting – MPTY, SCD, VGCS, FA
- Functional Addressing – Follow Me
- Confirmation of High Priority Calls – UUS
- Railway Emergency Calls – MPTY
- Voice Broadcast Service (VBS)
- Voice Group Call Service (VGCS)
- Enhanced Multi-Level Precedence & Pre-emption (eMLPP)
- Line identification services like CLIP, CLIR etc
- Call Forwarding, Call Waiting, and Call Hold
- Closed User Group
- Advice of Charge
- Call Barring and Call Deflection
- User-to-user signaling
- Follow Me (Based on USSD and CF)
- Location Services, USSD and more
Typical Users
- Railway operators
- Railway system integrators
Typical Applications
- Complete end-to-end surveillance of the GSM-R Network
- Surveillance of specific tracks and high speed lines
- Roll-out, and verification railway specific applications
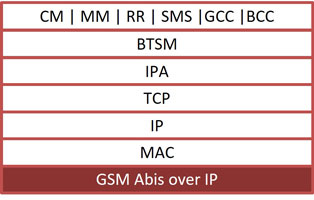
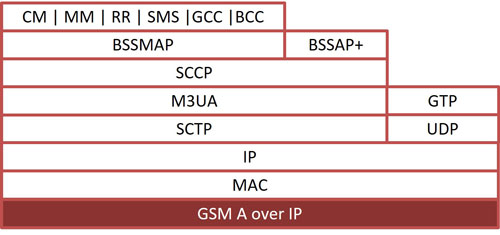
GSM over IP
Supports decode and analysing complete GSM protocol stack on A and Abis interface.
| Supported Protocols | Standard / Specification Used |
|---|---|
| BSSAP+ | 3GPP TS 29.018 V6.0.0 |
| BSSAP-LE (BSSMAP-LE/DTAP-LE) | 3GPP TS 49.031 V7.3.0 |
| CC | 3GPP TS 04.08 V7.17.0 |
| MM | 3GPP TS 04.08 V7.17.0 |
| GCC (Group Call Control) | 3GPP TS 44.068 V9.0.0 |
| BCC (Broadcast Call Control) | 3GPP TS 44.069 V9.0.0 |
| RR | 3GPP TS 04.08 V7.17.0 |
| BSSGP | 3GPP TS 08.18 V8.10.0 |
| LLC | 3GPP TS 04.64 V8.7.0 |
| GMM | 3GPP TS 04.08 V7.19.0 |
| BTSM | 3GPP TS 08.58 V8.6.0 |
GSM over TDM
Supports decode and analysing complete GSM protocol stack on A-Interface, Abis-Interface, Gs-Interface, Up-Interface, Lb, Ls, Lp-Interfaces, Mobis Interface. Over TDM, HDLC based frames are parsed according to Q.921, SS7 information parsing is based on ANSI and ITU standards: T1.111, T1.112, T1.113, Q.703, Q.704, Q.708, Q.723, Q.763 & GSM information parsing is based on 3GPP TS 08.08¸ 3GPP TS 24.008, 03.40, 3GPP TS 04.11, 3GPP TS 08.58, 3GPP TS 04.18. MTP2 is parsed according to ANSI-ITU standards and the higher GSM layer information parsing depends on the user's selection of GSM 900, DCS 1800 & PCS 1900 according GSM variants.
| Supported Protocols | Standard / Specification Used |
|---|---|
| TCP | RFC 793 |
| UDP | RFC 768 |
| IP | RFC 791 |
| MAC | IEEE 802.3 |
| MTP2 | Q.703, ITU-T Blue Book / ANSI T1.111-1996 |
| MTP3 | Q.704, ITU-T Blue Book / ANSI T1.111-1996 |
| SCCP | Q.713, CCITT (ITU-T) Blue Book / ANSI T1.112-1996 |
| BSSMAP / DTAP | 3GPP TS 48.008 10.0.0 |
| SMS | 3GPP TS 03.40 V7.5.0 & 3GPP TS 04.11 V7.1.0 GSM 03.38 version 7.2.0 Release 1998 |
| Test & Network Management Messages (ITU) | ITU-T Q.703, Q.704 |
| Test & Network Management Messages (ANSI) | ANSI T1.111.4, ANSI T1.111.7 |
| MM | 3GPP TS 04.08 V7.17.0 |
| CC | 3GPP TS 04.08 V7.17.0 |
| LAPD | Q.921, CCITT (ITU-T) |
| BTSM | 3GPP TS 08.58 V8.6.0 |
| RR | 3GPP TS 04.18 V8.13.0 |
| BSSAP+ | 3GPP TS 29.018 V6.0.0 |
| RRLP | 3GPP TS 44.031 V 7.5.0 |
| BSSLAP | 3GPP TS 48.071 V 7.2.0 |
| SMLCPP | 3GPP TS 48.031 V 6.6.0 |
| LLP | 3GPP TS 44.071 V 6.0.0 |
| BSSAP-LE (BSSMAP-LE/DTAP-LE) | 3GPP TS 49.031 V7.3.0 |
| Mobis Layer 3 | BSC-BTS: Motorola GSM Base Station System BSC to BTS Interface Design Specification. Document ID: GSD-GSM_NRS-MULTI_FA-IDS-001. BSC-PCU: Motorola GSL External Interface Specification - GSR9. Document ID: GSD-GSR9-GSL-EIS-001. |
| UMA Protocols (Stage 3) R1.0.4 | TS 24.008, Mobile radio interface layer 3 specification, Core Network Protocols - Stage 3 TS 25.331, RRC Protocol Specification TS 44.018, Mobile radio interface layer 3 specification TS 48.018, Base Station System (BSS) - Serving GPRS Support Node (SGSN) TS 48.008, BSS GPRS Protocol (BSSGP) TS 45.008, Radio subsystem link control |
| GCC (Group Call Control) | 3GPP TS 44.068 V9.0.0 |
| BCC (Broadcast Call Control) | 3GPP TS 44.069 V9.0.0 |
GSM -R Protocol Stack
| Supported Protocols | Standard / Specification Used |
|---|---|
| GSM A | 3GPP TS 24.080 3GPP TS 04.08 V7.17.0 (2002-02) (SS Layer) |
| GSM-R | ETSI TS 102 610 |
| EIRENE H 22 T 0001 2 | |
| FRS (Functional Requirements Specification) 7.1 | |
| SRS (System Requirements Specification) 15.1 |
Screenshots
GSM Over IP
Summary, Detail, Hexdump view
Protocol Filters
CDR and Statistics View
GSM Over TDM
Summary, Detail and Hex dump Views
Protocol Filters
Statistics and Call Detail Record View
Enhanced Trace Saving Options
Resources
Please Note: The XX in the Item No. refers to the hardware platform, listed at the bottom of the Buyer's Guide, which the software will be running on. Therefore, XX can either be ETA or EEA (Octal/Quad Boards), PTA or PEA (tProbe Units), XUT or XUE (Dual PCIe Express) depending upon the hardware.
| Item No. | Item Description |
| XX150 | T1 or E1 Real-time GSM Protocol Analyzer |
| OLV150 | Offline T1 or E1 GSM Protocol Analyzer |
| XX151 | GSM Motorola Mobis option |
| XX031 | Enhanced T1 E1 Call Capture/Analysis Software |