GPRS Protocol Analysis (Gb & Gn)
GSM, GPRS, and UMTS Network Architecture
Request a Demo / Quote Brochure
Overview
GPRS Service was introduced (in the late 90's and early 2000's) to enhance data carrying capabilities of the basic GSM Network.
GL Communications supports the following types of GPRS analyzers:
- For GPRS over IP transport
- GPRS Protocol Analysis over IP (PKV103) is available as an optional module within PacketScan™ analyzer (PKV100) or PacketScan™ HD analyzer (PKV120/PKV122) upon additional licensing. With this additional license, the PacketScan™ permits continuous monitoring of GPRS data connectivity over Gb, and Gn/Gp interface. (Pre-requisites: Hardware Dongle, and Windows® System)
- For GPRS over TDM transport
- T1 E1 Real-time GPRS Analyzer (XX155) is available as an optional module within T1 E1 Analyzer. With this software, the T1 E1 Analyzer permits continuous real-time monitoring of GPRS data connectivity over Gb interface. (Pre-requisites: GL's field proven E1 or T1 internal cards or USB based external units, required licenses and Windows® System)
- T1 E1 Offline GPRS Analyzers (OLV155) is available as an independent software that allows to decode and analyze pre-recorded traces of GPRS data over Gb interface. (Pre-requisites: Hardware Dongle, and Windows® System)
GL's GPRS Protocol Analyzer offers powerful features to capture, monitor, decode, and collect statistics of GPRS messages over IP and TDM. It provides valuable information about routing area update, PDP activations, and traffic patterns in the network.
The GPRS Protocol Analyzer when connected between SGSN and BSS elements of a GPRS network, permits the monitoring of Gb interface. Similarly, when connected between SGSN and GGSN elements, permits monitoring of the Gn/Gp interface.
Highlights
- Supports filtering and search features based on parameters such as Data Link, Network Service, BssGp, LLC, Gprs Mobility/Session Mgmt, SMS, TOM and SNDCP
- Summary view displays information such as DLCI, FECN, BECN, SAPI, CTL, Session Mgmt Message etc
- For GPRS over T1 E1 Interface,
- Streams can be captured on the selected time slots (contiguous or non-contiguous), sub-channels or full bandwidth. Frames may also be contained in either one, n x 64 kbps, or n x 56 kbps data channels.
- Supports decoding of frames with FCS of 16 bits and 32 bits, or none.
- Capturing filter based on length of frames (FISU - Length as 5 and LSSU - Length as 7) can be set.
- Call Detail Recording feature includes data link groups that help in defining the direction of the calls in a given network and form logical groups comprised of unidirectional (either 'Forward' or 'Backward') data links.
- Recorded trace files can be played back using HDLC Playback application.
Related Applications
- MAPS GPRS Gb Emulator
- MAPS GPRS Gn Gp Emulator
- GSM GPRS Wireless Lab
- Centralized 2G / 3G Network Monitoring
- GSM Protocol Analysis
- UMTS Protocol Analysis
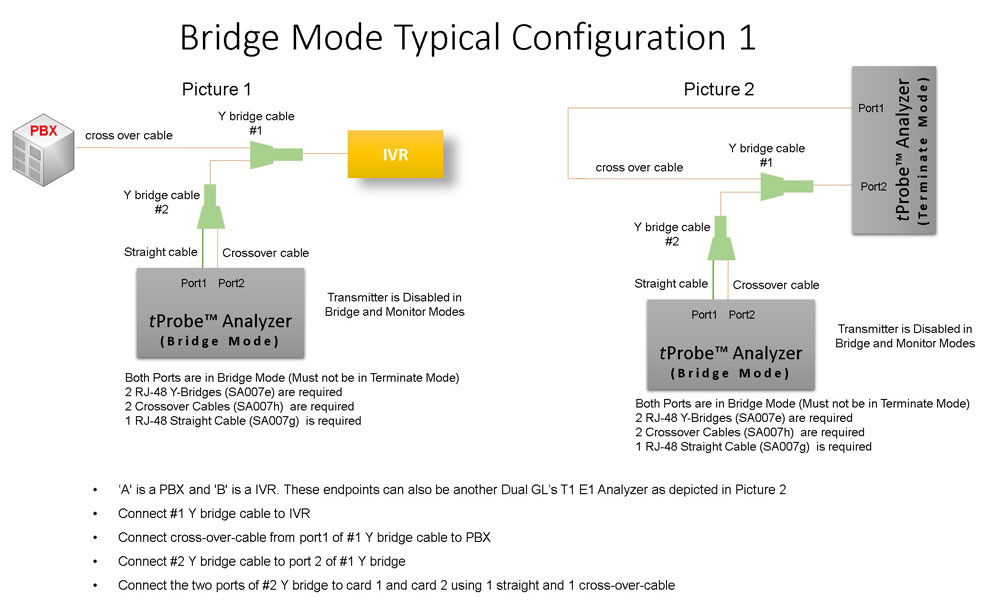
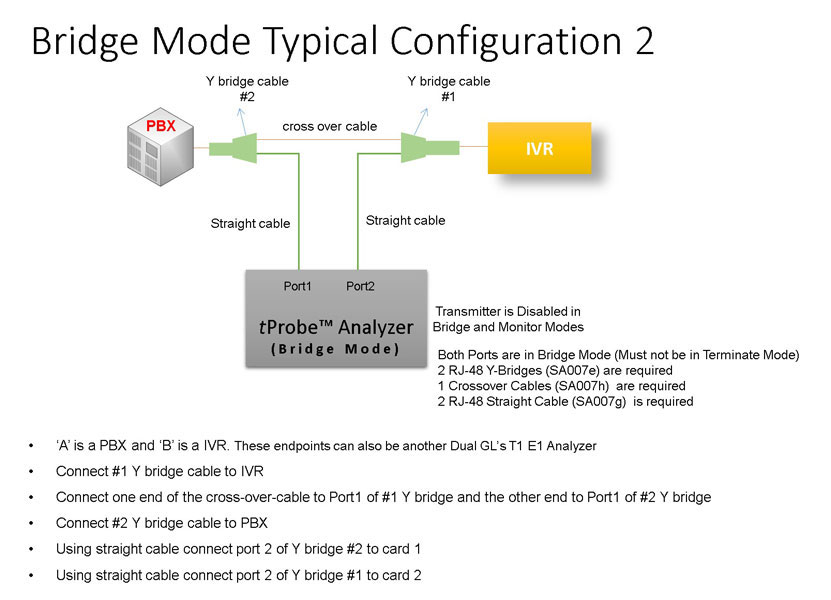
Bridge and Monitor Connections
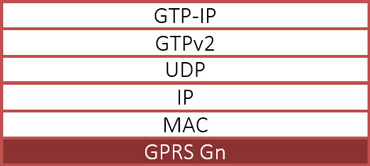
GPRS over IP
Supports decoding and monitoring of Gn and Gp control signaling used for mobility and session management between the SGSNs and GGSNs, and tunnelling of end-user data payloads in the backbone network.
| Supported Protocols | Standard / Specification Used |
|---|---|
| SMG | 3GPP TS 04.08 V7.19.0 |
| SNDCP (Subnetwork Dependent Convergence Protocol) |
3GPP TS 04.64 V8.7.0 |
| BSSGP | 3GPP TS 08.18 V8.10.0 |
| LLC (Logical Link Control) |
3GPP TS 04.64 V8.7.0 |
| GMM (GPRS Mobility Management) |
3GPP TS 04.08 V7.19.0 |
| SMS | 3GPP TS 03.40 V7.5.0 / GSM 03.38 version 7.2.0 |
| TOM | 3GPP TS 04.64 V8.7.0 (2001-12)-Annex B |
| NS (Network Service Frame Relay) | GSM 8.16 ETSI TS 101 299 V8.0.0 |
| GTP / GTPv2 / GTP (GPRS Tunnelling Protocol) |
3GPP TS 09.60 V7.9.0 / 3GPP TS 29.060 V6.5.0 / 3GPP TS 32.005 V3.7.0 and 3GPP TS 32.015 V3.12.0 |
| LAPF | Q.922 |
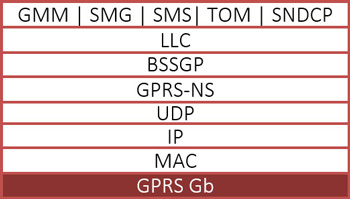
GPRS over TDM
Supports decoding and monitoring of Gb signaling that connects the BSS and the SGSN with the BSCs in TDM based GSM networks.
Screenshots
GPRS Over IP

Summary, Detail, Hexdump view
Protocol Filters
CDR and Statistics View
GPRS Over TDM
Summary, Detail and Hex dump Views
Stream selection
Protocol Filters

Statistics and Call Detail Record View
Enhanced Trace Saving Options
Resources
Please Note: The XX in the Item No. refers to the hardware platform, listed at the bottom of the Buyer's Guide, which the software will be running on. Therefore, XX can either be ETA or EEA (Octal/Quad Boards), PTA or PEA (tProbe Units), XUT or XUE (Dual PCIe Express) depending upon the hardware.
| Item No. | Item Description |
| XX155 | GPRS Protocol Analyzer |
| OLV155 | Offline GPRS Protocol Analyzer |