PacketCheck™ - Software Ethernet/IP Tester
PacketCheck™ is a complete PC based Ethernet / IP test tool that provides multi stream capabilities with BERT, Throughput, Delay, and Impairment testing features.
Request a Demo / Quote Brochure
Overview
GL's enhanced PacketCheck™ is a comprehensive PC based Ethernet / IP test tool with BERT, Throughput and Delay, Impairment (up to 500 Mbps) testing features. It is a general purpose network performance analysis tool for 10Mbps, 100Mbps and 1Gbps LANs and WANs. Throughput up to 500 Mbps can be easily tested.
PacketCheck™ makes use of PC's network interface card (NIC) to transmit and receive Ethernet or IP packets over the network.
The application generates multi stream Ethernet/IP/UDP traffic with on-demand bandwidth (up to 500 Mbps) and measures end-to-end performance such as Bit Error Rate, Total Packets, Packet loss, Out of Sequence Packets, Errored Packets, Round Trip Delay, and One Way Delay (within the same PC). Additional features include transmission of pre-recorded file traffic, recording per stream traffic to file, GTP traffic simulation, Bursty and Fixed IFG (Inter Frame Gap) traffic generation mode, impairment generation, and BER testing capability with provision to generate PRBS patterns or user-defined test patterns. Supports recording of the user defined stream traffic to a PCAP (PCAPNG/NTAR) or HDL (GL Proprietary) file format and playback the pre-recorded traffic from a PCAP (PCAPNG/NTAR) or HDL (GL Proprietary) file format.
Also included is a powerful Report Generation feature to view report in XML and PDF formats.
Product Videos


PacketCheck™ can operate on - Layer 1 (Physical), Layer 2 (Data Link), Stacked VLAN (Q-in-Q), Layer 2.5 (Stacked MPLS), Layer 3 (Network), and Layer 4 (Transport) of the OSI reference model.
PacketCheck™ at Layer 1 (Physical), Layer 2 (Data Link) with Stacked VLAN tag,
Layer2.5 (MPLS), Layer 3 (Network),
and Layer 4 (Transport) of OSI model
Key Network Test Applications
- Create multiple streams of traffic for network testing from layer 2, 3, or 4
- Bit Error Rate Testing for checking networks for dropped packets, out-of-order, non-test frames, and so on. Write packet errors to an error log
- Determine Round Trip Delay (RTD) between two IP addresses or two Ethernet MAC addresses with microsecond accuracy
- Determine One Way Delay (OWD) between two NIC cards on the test PC with microseconds accuracy
- Record test traffic in binary and/or PCAPNG or NTAR file format
- Playback PCAPNG files for test traffic generation. Either recorded from test BERT traffic or recorded traffic of interest
- Record non-test packets to a PCAPNG file. i.e. Non-BERT traffic related packets
Key Features
- High-Performance Ethernet/IP Testing
Generate and analyze Ethernet traffic up to 500 Mbps across 10 Mbps, 100 Mbps, and 1 Gbps networks, with full-duplex operation and precise bandwidth control - Comprehensive Layer Support (L1–L4)
Test across Ethernet (Layer 2), Stacked VLAN/MPLS (Layer 2.5), IPv4 (Layer 3), UDP (Layer 4), TCP (Layer 4), ICMP (Layer 4) to validate routers, switches, and network links end-to-end - Flexible Multi-Stream Generation
Create and manage hundreds of concurrent Ethernet/IP/UDP/TCP/ICMP streams, each independently configured for transmit, receive, or full-duplex mode. Copy stream profiles (one-to-one or one-to-many) for faster setup - Custom Protocol Configuration
Define unique MAC/IP addresses, VLAN/MPLS headers (up to three stacked levels), frame size, rate, EtherType, and UDP port parameters per stream for complete control - Real-Time Network Performance Metrics
Measure Bit Error Rate (BER), throughput, packet loss, out-of-sequence and errored packets, Round-Trip Delay (RTD), and One-Way Delay (OWD) with microsecond accuracy - Dynamic Bandwidth Control
Adjust transmission using Burst mode or Inter-Frame Gap (IFG) mode. Supports jumbo frames and real-time display of achievable throughput for precise traffic shaping - Smart ARP and Connectivity Validation
Automatically resolve IP-to-MAC addresses across all streams, populate switch/router tables, and verify multi-stream and multi-destination connectivity before test execution
- PRBS & Custom Payload Generation
Support for PRBS patterns (QRSS 26-1 to 223-1), user-defined test sequences, and zero-padding for small packets to ensure interoperability with all routers and switches - Traffic Capture & Playback
Record and replay traffic in PCAP/PCAPNG (Wireshark®) or HDL (GL proprietary) formats. Ideal for reproducing live network conditions and regression testing - Advanced Impairment Simulation
Introduce byte insertion/deletion or ReplaceBits/ToggleBits or logical (AND/OR/XOR) errors at configurable offsets, packet intervals, and repeat counts to assess network robustness - Powerful Reporting & Analysis
Generate detailed PDF reports with per-stream statistics, summary metrics, and pass/fail indicators for documentation and compliance - Supports Multiple Instances
Run multiple PacketCheck™ sessions simultaneously on a single PC to utilize all available NICs for parallel testing - Protocol Flexibility
Configure IP protocol types (0–255) for customized Layer 3/4 traffic testing and header verification
Frequently Asked Questions
- What is PacketCheck™?
- PacketCheck™ is a PC-based Ethernet/IP test tool by GL Communications that supports multi-stream traffic generation and analysis. It offers BERT (bit error rate testing), throughput, delay, and network impairment testing up to 500 Mbps.
- Which network types and speeds does PacketCheck™ support?
- It can be used for 10 Mbps, 100 Mbps and 1 Gbps LANs/WANs, with throughput up to 500 Mbps in the software.
- At which OSI layers can PacketCheck™ operate?
- PacketCheck™ can work at Layer 1 (Physical), Layer 2 (Data Link including stacked VLAN), Layer 2.5 (MPLS), Layer 3 (Network) and Layer 4 (Transport) for Ethernet/IP/UDP/TCP/ICMP traffic.
- What kinds of traffic generation and testing features are supported?
- The tool can generate multi-stream Ethernet/IP/UDP traffic, recording and playback of traffic (PCAP/HDL formats), configurable protocols (MAC/IP/UDP/TCP/ICMP headers), support for GTP traffic simulation, jumbo frames, burst/IFG (inter-frame gap) traffic modes, and impairment injection (insert/delete bytes, modify bits).
- What performance metrics does PacketCheck™ measure?
- It measures bit-error rate, total packets, packet loss, out-of-sequence packets, errored packets, one-way delay, round-trip delay, and per-stream statistics including sync loss and error counts.
- Does PacketCheck™ support impairment simulation?
- Yes. It supports insertion of impairments such as deleting or inserting bytes, modifying frame payloads via logical AND/OR/XOR, Toggle Bits, and Replace Bits operations, simulating packet loss, delay, jitter, and supports both directions of traffic.
- Can PacketCheck™ playback captured traffic and record non-test traffic?
- Yes. PacketCheck™ can record streams into PCAP/HDL files and playback pre-recorded traffic via those formats. It also supports capturing non-test traffic (NIC traffic not belonging to defined streams) into PCAP for analysis in Wireshark® or GL’s PacketScan™.
- What are some typical applications or use-cases for PacketCheck™?
- Use-cases include:
- Multi-stream traffic generation and network testing across layers 2-4
- Bit-error rate testing across physical, Ethernet, MPLS or IP layers
- Measuring one-way/round-trip delays with micro-second accuracy (e.g., between NICs or across networks)
- Playback of real network traffic for analysis of real-world conditions
- Network impairment simulation for latency, packet‐loss, jitter, packet disorder in IP/Ethernet networks
- Are there regulatory or special format report outputs?
- Yes. PacketCheck™ can generate reports in PDF formats and make those available periodically per stream during test runs.
- What licensing options are available?
- PacketCheck™ is available under node-locked or floating licenses, allowing flexibility for lab or field use.
- Can PacketCheck™ measure QoS parameters?
- Yes. It can calculate latency, jitter, and packet loss across multiple streams, helping verify service quality and compliance with SLA metrics.
- What file formats are supported for export?
- Captured results can be exported as CSV, or PDF depending on the selected operation (traffic analysis, capture, or reporting).
- Does it require dedicated hardware?
- No special hardware is required beyond a standard Windows PC and NIC. However, using a high-performance Intel Ethernet adapter improves accuracy and stability at higher traffic rates.
- Is VLAN tagging supported?
- Yes. It supports VLAN tagging and stacked VLAN (Q-in-Q) for enterprise and carrier Ethernet testing.
- Does PacketCheck™ support timestamp-based latency measurements?
- Yes. It provides microsecond-level accuracy for latency, jitter, and delay using internal packet timestamping.
- Does it support full-duplex testing?
- Yes, it supports both transmit and receive streams on multiple NICs, enabling bidirectional or full-duplex testing.
Modes of Operation
The MAC and IP addresses of the available NICs in a PC are displayed in the GUI. PacketCheck™ can be configured in Normal or Loopback mode.
- In "Normal" mode, the application can perform either transmit (Tx), receive (Rx), or transmit and receive (Tx and Rx) functions on single or multiple streams.
- In "Loopback" mode the packets received from the device under test (DUT) are transmitted back to the same device without modifying the pattern. This mode is used for RTD measurement.
Interface Selection and Details Settings
Normal Mode
PacketCheck™ offers the flexibility to configure Normal Tx and Rx modes for conducting BER testing across different layers. These layers include Layer 1 (Framed Layer 1), Layer 2 (Framed Ethernet), Layer 2.5 (Stacked MPLS), Stacked VLAN, IP, UDP, TCP and ICMP.
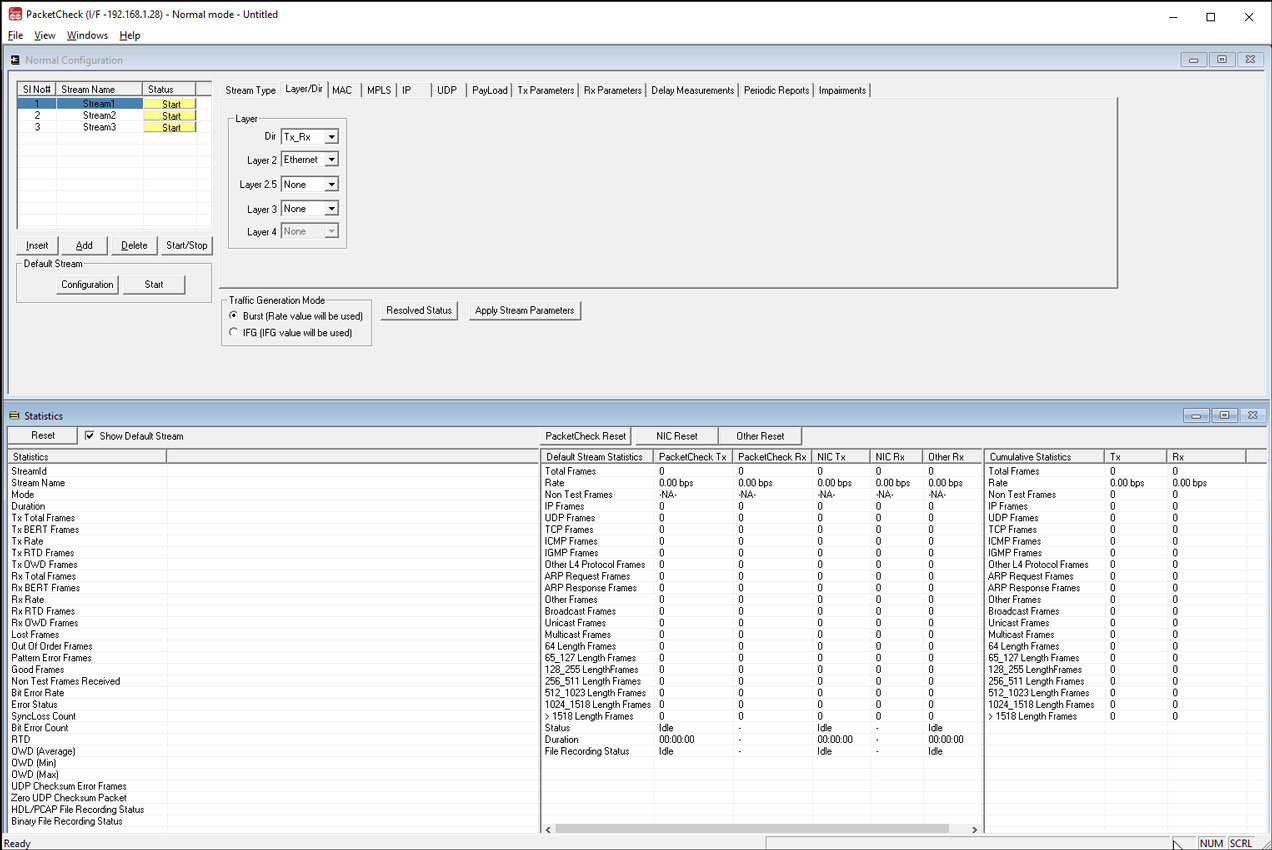
Normal Mode Configuration Window
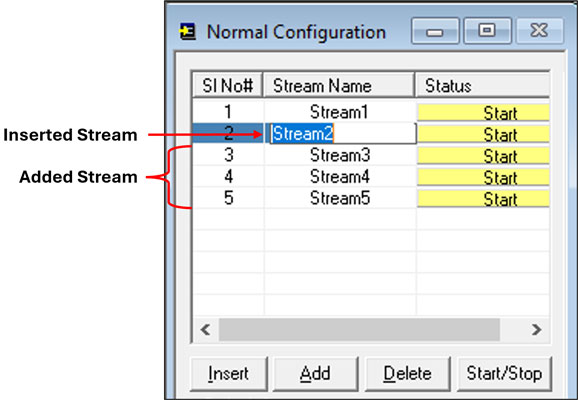
Add/Delete/Insert Streams
The configuration window provides Add, Delete, Insert options to operate on the stream instances.
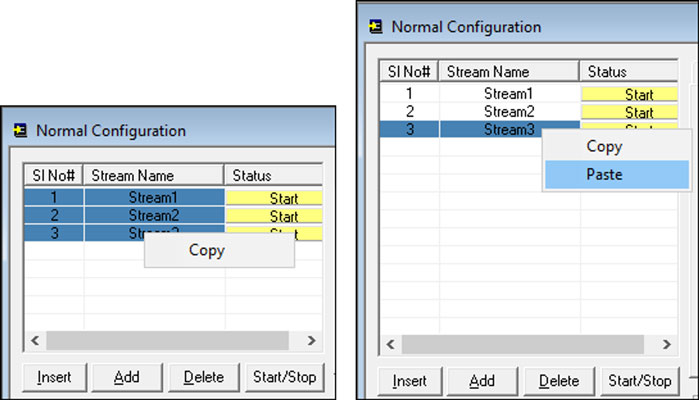
Copy and Paste Streams
Provides options to copy from one stream to another (both one-to-one copy and one-to-many copy) to quickly configure multiple streams.
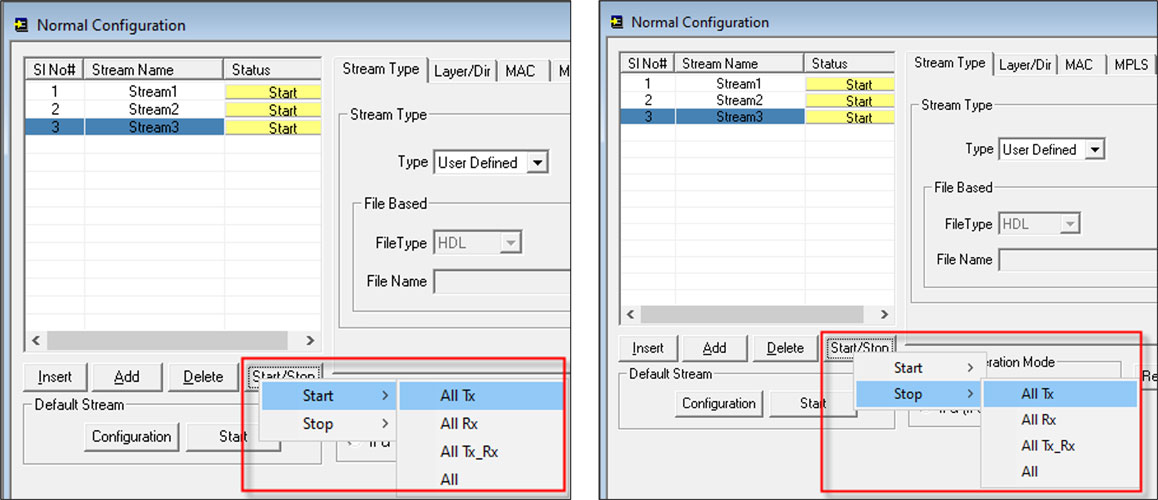
Start/Stop Streams
Allows users to independently start or stop 'All Tx streams,' 'All Rx streams,' 'All Tx_Rx streams,' and 'All streams,' providing the flexibility to start All Rx streams first, followed by All Tx streams.
Ethernet BER Testing
GL's PacketCheck™ supports BERT testing at various levels -
- Layer 1 (Physical layer) – Payload is made up of BERT patterns
- Layer 2 (Framed Ethernet layer) - Bit pattern is inserted as the Ethernet Payload.
- Layer 2 with Stacked VLAN - Bit pattern is inserted as Ethernet Payload with VLAN tags
- Layer 2.5 (MPLS) - Bit pattern is inserted as MPLS Headers
- Layer 3 (IP level) – Bit pattern is inserted as the IP packet payload
- Layer 4 (UDP level) – Bit pattern is inserted as the UDP packet payload
- Layer 4 (TCP Layer) – BERT traffic is generated and analyzed using configurable TCP header fields
- Layer 4 (ICMP Layer) – BERT traffic is generated and analyzed using configurable ICMP header fields
At Layer 1
The physical layer of the OSI model is where data is physically moved across the network interface. At Layer 1 cables, hubs and repeaters are used to transmit data across the medium.
For Layer 1 BER testing, PacketCheck™ can test the basic data flow over the physical connection. Connect the two test PCs using an Ethernet cable as shown below:
BERT Test Setup at Layer 1 connected using Ethernet cable
At Layer 2
Testing at layer 2 involves the switches, bridges, or NICs as the DUT. The bridges, switches, and NICs handle physical addressing, packing data into frames, and sequencing data frames. Only the MAC addresses need to be configured for layer 2 testing.
GL's PacketCheck™ can test the basic data flow over the network. This test is performed in order to
- Test the capability of the switch to handle frames at various bandwidths
- Test the forwarding capacity of the switch
- Measure the ability of the switch to deliver the frames in sequence
- Verify incoming data by analyzing bit patterns of the received frames
Scenario 1 - Source & Destination PC in the same LAN, connected through a single switch
Ethernet BER Test Setup at Layer 2 connected through a single switch
Scenario 2 - Source & Destination PC located at different LANs connected through multiple switches.
Ethernet BER Test Setup at Layer 2 connected through multiple switches
At Stacked VLAN Layer
Stacked VLAN ID feature is used to simulate Carrier Ethernet as shown below, where the SP VLAN ID is stacked on top of CE VLAN ID.
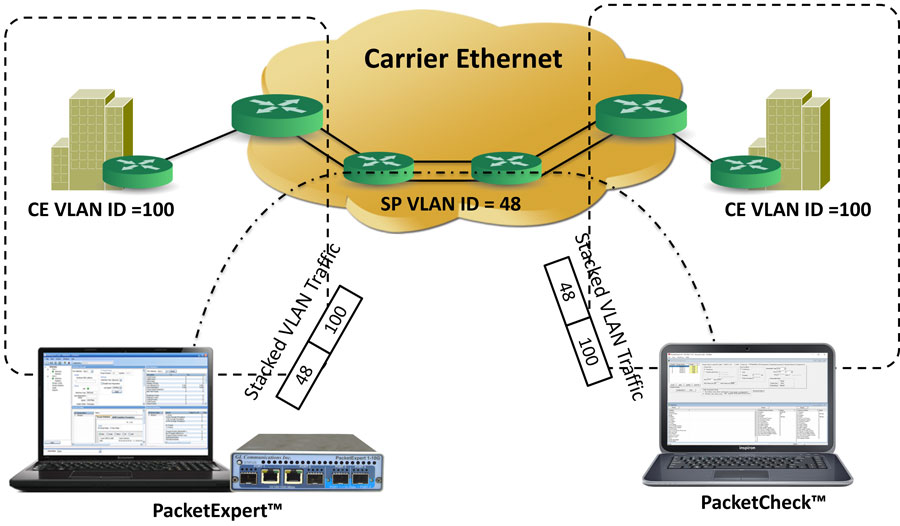
Stacked VLAN simulating Carrier Ethernet
At Stacked MPLS Layer
Stacked MPLS (up to 3 levels) is supported. Various test combinations such as single MPLS, multiple MPLS, VLAN + MPLS can be tested for single and multiple streams.
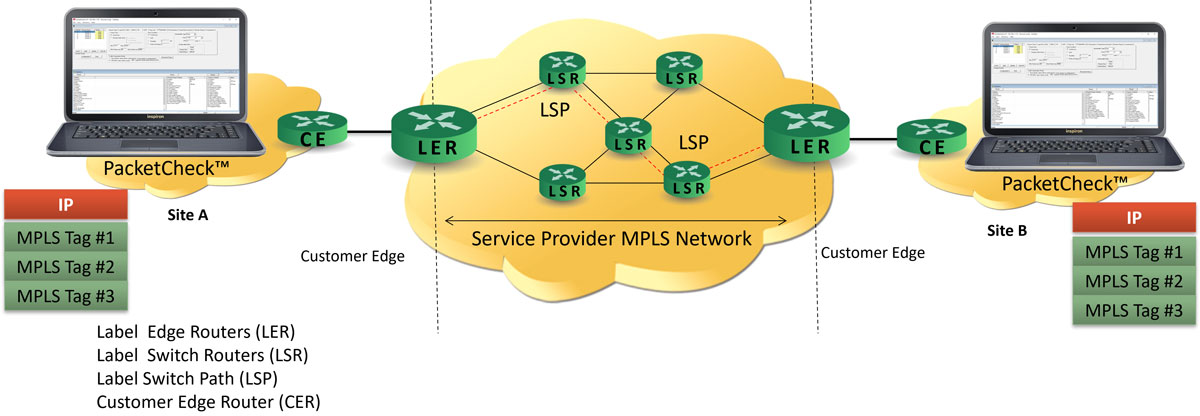
Ethernet BERT Test Setup at stacked MPLS
At Layer 3/Layer 4
The Network Layer (Layer 3) uses routing technologies to connect various systems within a network or to connect multiple networks together through Gateways. In Layer 3 testing, packets are routed between the Source and Destination PCs based on both the IP address and MAC address. So, both the MAC address and the IP address have to be configured for Layer 3 testing.
The Transport Layer (Layer 4) provides end-to-end, error-free reliable data transfer. TCP and UDP are the most common Layer 4 protocols. PacketCheck™ supports Layer 4 testing using UDP packets and BERT testing using UDP payloads, TCP header fields, and ICMP header fields. For Layer 4 testing, the appropriate protocol parameters, such as UDP/TCP source and destination ports, need to be configured in addition to MAC and IP addresses.
PacketCheck™ supports BER testing at Layer 3 as well as Layer 4.
Testing at Layer 3 using GL's PacketCheck™ can be accomplished as shown in the figure below. Here, two PacketCheck™ applications operate in separate IP networks and are connected through routers, which route the frames based on the IP addresses in the test frames. Since IP networks encompass various types of physical networks consisting of LAN and WAN links, there is lot of scope for packet modification, packet loss and out of order packets. GL's PacketCheck™ helps measure these metrics of the IP network.
Two test scenarios at Layer 3 / 4 are as depicted in the diagram where the information in layer 3 / layer 4 is transmitted through the network in packets. Layer 4 testing supports UDP, TCP, and ICMP-based traffic validation across the network.
Scenario 1 - Source & Destination PC are located within the same IP network, and hence are directly reachable.
Ethernet BERT Indirect Routing Test Setup at Layer 3/ Layer 4 within the same IP network
Scenario 2 - Source & Destination PC are located at different IP networks, and are connected through routers.
Ethernet BERT Indirect Routing Test Setup at Layer 3/ Layer 4 at different IP networks
At Layer 4 testing, UDP packets are sent. This testing is useful in cases where there are firewalls which can intervene at network boundaries to reject, pass or modify packets.
Default Stream
Apart from user-configured Ethernet frames, other frames may be sent/received on the NIC card on which PacketCheck™ is running.
PacketCheck – These are Tx or Rx Ethernet frames that match with the PacketCheck streams but do not belong to the actual test traffic.
NIC card – Non-PacketCheck traffic sent/received on the NIC card. This can be other application Tx/Rx traffic and also Broadcast/Multicast frames received from the LAN.
Other Statistics – The traffic sent or received that doesn't belong to either PacketCheck™ or the NIC card can include other application traffic with different MAC/IP addresses. This can occur when two PacketCheck™ applications are running on separate PCs and one mistakenly sends traffic with addresses that don't match any PacketCheck™ streams or NIC card addresses. Thus, it can also be misconfigured incoming test traffic.
Default stream is always a present stream (user need not configure it) in PacketCheck. All the default stream frames (as explained above) are identified, categorized and statistics displayed for user convenience. Users can start/stop the default stream at any time. Additionally, user can record the default stream frames into a PCAP or HDL file. By capturing the traffic from this default stream and saving it in either PCAP or HDL file formats, users can conveniently analyze the non-test traffic by opening the file in Wireshark® or PacketScan™ tools.
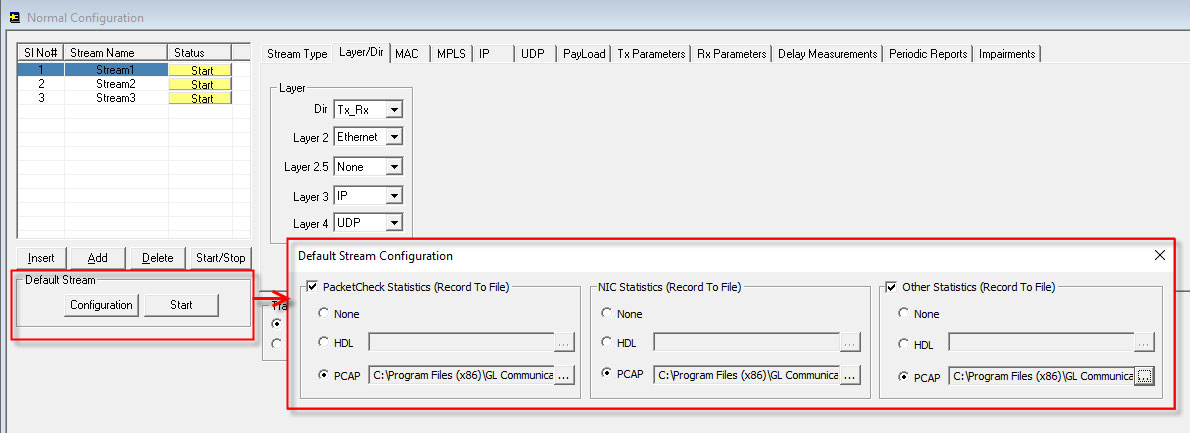
Default Stream Configuration
Default Stream Statistics pane displays the categorized statistics for both Tx and Rx.
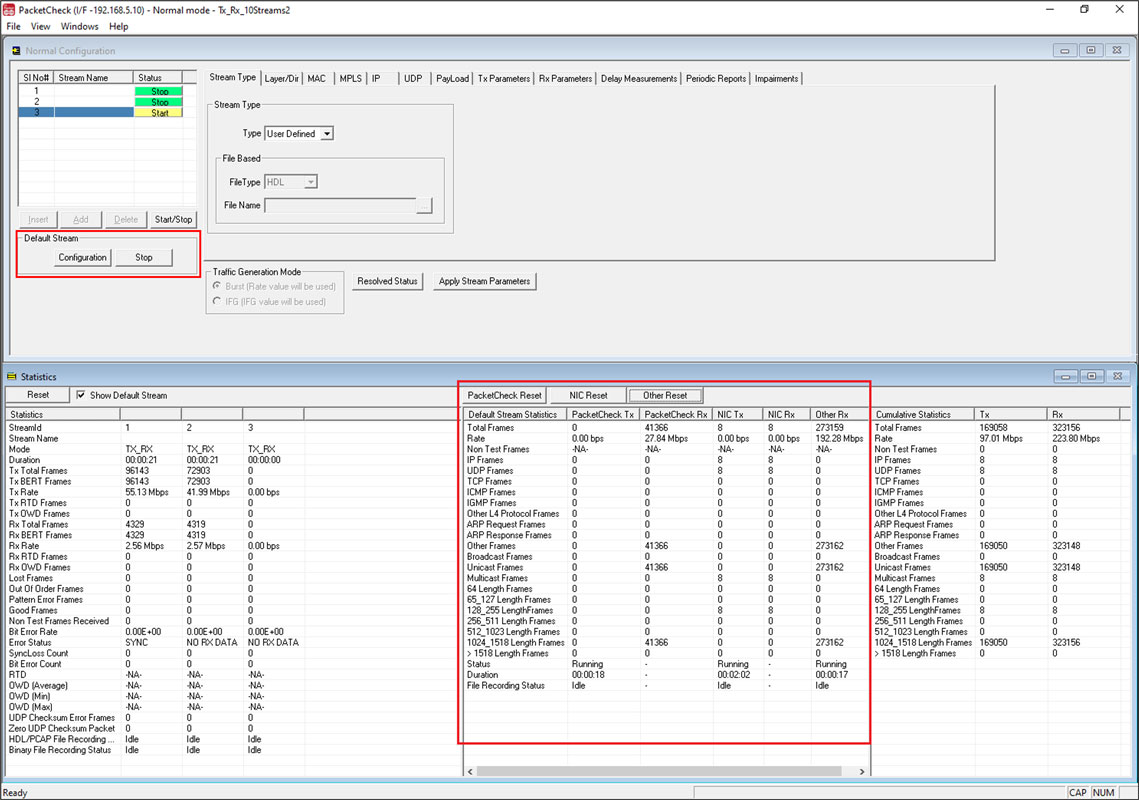
Default Stream Statistics
Capture Traffic
Provides options to record the user defined stream’s traffic to a PCAP (Wireshark®) or HDL (GL Proprietary) file format and playback the pre-recorded traffic from a PCAP (Wireshark®) or HDL (GL Proprietary) file format.
Capture Traffic
Playback from File
This option allows users to specify a source file for the stream, this source file can be PCAP or HDL file format. The packets are read from the specified file and the packets are transmitted sequentially. User has option to transmit the file continuously or stop at the end of file or after N number of frames or after specified duration in seconds.
In File based option the default mode is set to Tx and all the other configurations will be disabled as it is not required in File Based option. Select the HDL or PCAP file format as recorded and choose the file name to transmit the traffic.
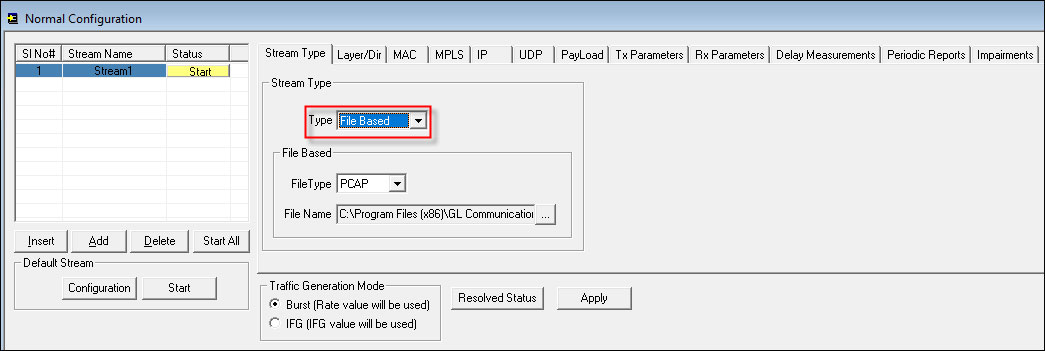
File Based Stream Type
File Based Tx Configurations
MAC, MPLS, IP, UDP, TCP, ICMP Layer-wise Parameters Configuration
All test parameters are configured through the GUI. Key parameters include the Layer/Direction selection, MAC, VLAN, MPLS, IP, UDP, TCP, ICMP payload, transmit and receive, delay measurements and various impairments settings PacketCheck™ is automatically set to Layer 1 BER testing by disabling other layers.
Interface Configuration Settings
[Layer 2] - Ethernet
Here you can configure the source and destination MAC Addresses. In addition, user can specify the EtherType field value. Users can enable VLAN up to 3 stacks and configure with the headers.
The following table gives the Field values for the configured Layers (2/3/4)
| Layer Configured | Frame Size Configured | EtherType field Value |
|---|---|---|
| Layer 2 | 60 (actual frame size = 64 bytes) | 00-2E |
| Layer 2 | (between 64 and 1514) | (Hex Value of Configured Frame Size -14) |
| Layer 2 | 1514 (actual frame size = 1518 bytes) | 05-DC |
| Layer 2.5 | ANY | 08-47 |
| Layer 3 (IP) | ANY | 08-00 |
| Layer 4 (UDP) | ANY | 08-00 |
| Layer 4 (TCP) | ANY | 08-00 |
| Layer 4 (ICMP) | ANY | 08-00 |
Layer 2 (MAC) with Stacked VLAN Configuration
[Layer 2.5] - Stacked MPLS
Selecting MPLS enables MPLS layer for the test. If MPLS is selected MPLS header is inserted after Ethernet header, and higher layer is by default set to IP. PacketCheck™ supports MPLS/IP (i.e., selecting Layer 2.5 as MPLS and Layer 3 as IP) only. In this case, IP header will be inserted after MPLS. If None is selected for Layer 2.5, it will be a normal Ethernet packet, without the MPLS header inserted.
Layer 2.5 (MPLS) Configuration
[Layer 3] - IP
Here you can configure the source and destination IP addresses. Users can configure various IP header fields like TOS field, TTL field and protocol field.
Build MAC Header Automatically option provided for the user's convenience automatically builds MAC header for Layer 3/ Layer 4 testing.
Increment Identification option may be used to set the initial IP header identification value, which will be automatically incremented for the subsequent packets.
Layer 3 (IP) Configuration
[Layer 4] - UDP
Here you can configure the source and destination UDP ports. User can check the Configure Checksum option to enable, the correct UDP checksum is placed in every UDP packet. For Rx mode, UDP Configure Checksum option is disabled.
Layer 4 (UDP) Configuration
[Layer 4] - TCP
Here you can configure the source and destination TCP ports along with TCP header parameters such as Sequence Number, Acknowledgment Number, Window Size, Urgent Pointer, Checksum, and TCP Flags. Users can configure fixed, varying, increasing, or random values for applicable fields to generate TCP-based traffic and perform BERT testing using TCP header fields.

Layer 4 (TCP) Configuration
[Layer 4] - ICMP
Here you can configure ICMP header parameters including Type, Code, Checksum, Identifier, and Sequence Number values. Users can configure fixed, varying, increasing, or random values for applicable fields to generate ICMP-based traffic and perform BERT testing using ICMP header fields.

Layer 4 (ICMP) Configuration
Traffic (Payload) Configuration
Users can choose to insert various types of packets into the stream by enabling the sequence number format, magic pattern, PRBS patterns through predefined files, and user-defined fixed pattern of up to 24 bytes.
Layer 1 BER Testing supports only PRBS patterns through predefined files, and user-defined fixed pattern of up to 24 bytes.
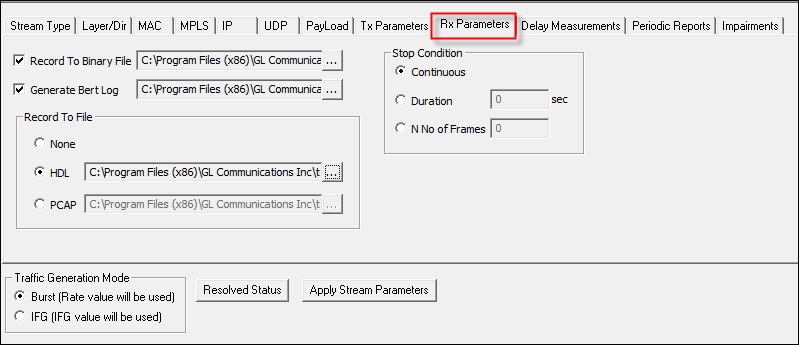
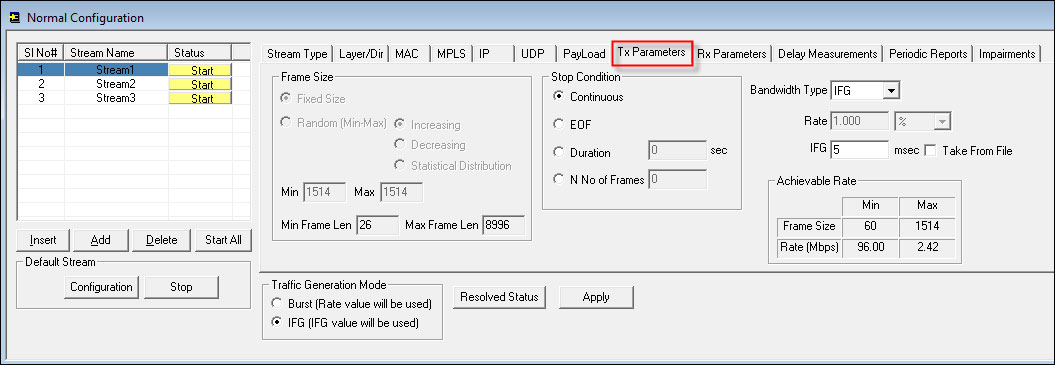
Users are allowed to configure Frame size, Bandwidth, Inter Frame Gap (IFG) and transmission stop condition parameters during packet transmission. Users can specify frame size of fixed / random length, and define the transmission rate in Bit per second. The received traffic can be recorded to a binary (*.bin), HDL, and also BERT files for each stream, which are used for diagnosis purposes.
Payload Configuration
Tx and Rx Parameters Configuration
Traffic Generation Mode
The HDL file transmission has necessitated PacketCheck™ to operate in 2 different modes. The traffic generation mode is common to all the streams.
- Burst Mode - In this normal mode of operation, traffic is generated in bursts and the configured bandwidth is maintained, ignoring the IFG value. Here, the emphasis is to try and achieve the configured bandwidth for each stream. The resultant Inter Frame Gap varies because of the bursty nature of the traffic.
- IFG Mode - In this Inter Frame Gap mode, traffic is generated frame-by-frame, and the configured IFG is maintained. The configured bandwidth is ignored. Here, the emphasis is on maintaining the IFG value between successive packets for each stream. The actual Bandwidth generated depends on the Frame Size and the configured IFG.
Traffic Generation Mode
Inter Frame Gap (IFG) option emphasizes on maintaining the Inter Frame Gap rather than the bandwidth during traffic generation for HDL files. There are 2 ways to configure Inter Frame Gap for HDL file transmission:
- For "Take from HDL File" option, the timestamps stored within the HDL file is read. The Inter Frame Gap between the packets is computed from these timestamps. This allows the generated traffic to mimic the captured traffic as much as possible.
- User can also configure the "IFG value", during which the timestamps read from the HDL file is ignored and frames are transmitted with this Inter frame Gap.
Mobile GTP Traffic Simulation
Using the “HDL File Playback” feature within PacketCheck™, the packet data can be carried as pre-recorded traffic files (GL's proprietary Ethernet traffic capture format *.HDL files) to destination points and the same can be verified at the receiving end, which can also be a PacketCheck™. This feature can be used GL’s Mobile IP Core traffic module (requires Additional Licenses) to simulate GTP traffic over UMTS or LTE network.
Generally, in an EPC network, are two types of data pipes can be found - Default Bearer (with non-guaranteed QOS) and Dedicated Bearer (with assured guaranteed QOS). The PacketCheck™ can be used with GL’s MAPS™ UMTS / LTE Simulators to encapsulate the generated packet data within GTP headers when transmitting through the gateways such as SGSN & GGSN, or SGW & PGW to verify the bearer allocation bandwidth at the end points. The packet data traffic generated at one end is received at the other end can be verified with various statistics such as packet loss, lost frames, bit error count, Tx Rx frames count and other traffic parameters.
Delay Measurements
PacketCheck™ can measure One-Way Delay (OWD), calculating the delay at the receiving end in µsec. OWD can only be correctly calculated on a single PC with 2 NICs running PacketCheck™ on each of them. Only a single license needs to be purchased in this scenario. OWD-Tx option embeds Tx Timestamp within a special OWD packet along with the normal stream data. OWD-Rx option receives and detects the special OWD packet.
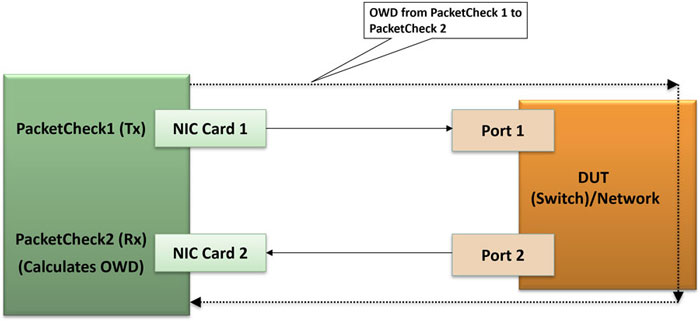
OWD Measurement on Single PC
Also, PacketCheck™ can be configured to measure the average Round Trip Delay [RTD] value of each packet in µsec. RTD is applicable to Tx_RX streams with DUT/ remote end configured in Loopback mode for RTD to work.
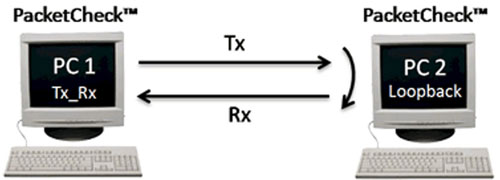
RTD Measurement
OWD and RTD provides user configurable frame length (for the special frames that are sent/received to measure OWD and RTD), minimum frame length, maximum frame length or define any value within the allowed range.
One Way Delay Measurement Settings and Statistics
Round Trip Delay Measurement Settings and Statistics
Impairments
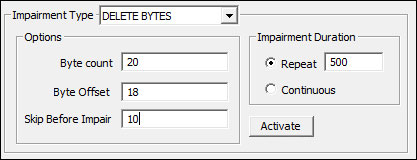
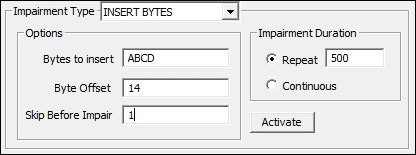
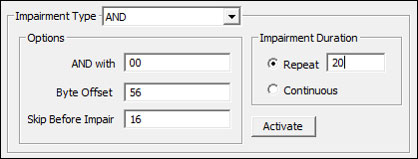
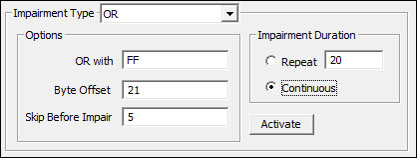
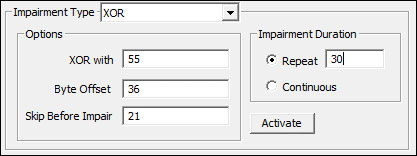
Users can introduce impairments into the outgoing traffic using various impairment types and duration. Supports various types of impairments - DELETE BYTES, INSERT BYTES, Replace Bits, Toggle Bits AND, OR, & XOR. Impairments can be introduced at specific intervals or can be set to continuous insertion on each stream.
Impairment Types and Settings
The following Impairment types are supported in PacketCheck™:
- Delete bytes: Deletes the specified number of bytes from the configured offset
- Insert bytes: Inserts the specified number of bytes at the configured offset. The inserted byte values are taken from the hexadecimal values specified in the Byte Value field
- ReplaceBits: Replaces user-specified bits within the specified number of bytes starting at the configured offset. The user specifies the Number of Bytes, along with a Byte Mask and Byte Value. In the Byte Mask, a value of ‘1’ indicates that the corresponding bit is selected for replacement, while ‘0’ indicates it is not selected
- ToggleBits: Toggles user-specified bits within the specified number of bytes starting at the configured offset. The user specifies the Number of Bytes and provides a Byte Mask. In the Byte Mask, a value of ‘1’ indicates the bit is selected for toggling, while ‘0’ indicates it is not selected
- Logical AND: Performs a logical AND operation on user-specified bits within the specified number of bytes starting at the configured offset. The user specifies the Number of Bytes, Byte Mask, and Byte Value. Bits selected by the Byte Mask are ANDed with the corresponding bits in the Byte Value
- Logical OR: Performs a logical OR operation on user-specified bits within the specified number of bytes starting at the configured offset. The user specifies the Number of Bytes and provides a Byte Mask and Byte Value. In the Byte Mask, a value of ‘1’ indicates the bit is selected for ORing, while ‘0’ indicates it is not selected. The selected bits are ORed with the corresponding bits in the Byte Value
- Logical XOR: Performs a logical XOR operation on user-specified bits within the specified number of bytes starting at the configured offset. The user specifies the Number of Bytes and provides a Byte Mask and Byte Value. In the Byte Mask, a value of ‘1’ indicates the bit is selected for XORing, while ‘0’ indicates it is not selected. The selected bits are XORed with the corresponding bits in the Byte Value. Example: If Number of Bytes = 2, Byte Mask = 00-FF, Byte Value = 12-34, and the original bytes at the offset are AB-CD, the resulting bytes after impairment will be AB-FF.


While the test is running, users can view statistics for each stream. These include bit error rates, throughput, lost or out of order frames, RTD and OWD.
Stream Specific Statistics:
- Stream ID – ID of the streams as added in the configuration window
- Stream Name – displays the name of the streams specified while adding in the configuration window
- Mode – indicates mode of traffic as specified for each stream during configuration
- Duration – per stream statistics displays the Duration for which the stream is running in "HH:MM:SS" format
- Tx Total Frames- total number of frames transmitted for the stream (in Tx or Tx_Rx mode). This includes the BERT frames, OWD and RTD frames (if enabled)
- Tx BERT Frames- number of BERT pattern frames transmitted (excluding OWD/RTD frames) for the stream
- Tx RTD Frames number of RTD frames sent for the stream
- Tx OWD Frames number of OWD frames sent for the stream
- Tx Rate – gives total data rate at which the frames are being transmitted
- Rx Rate – gives rate at which the data are being received
- Rx Total Frames - total number of frames received for the stream (in Rx or Tx_Rx mode). This includes the BERT frames, OWD and RTD frames (if enabled)
- Rx Stream Frames - Number of frames belonging to the stream that are accepted for BERT processing. These frames match the stream configuration, do not have checksum errors, have a valid magic pattern (if enabled), and are not OWD or RTD frames
- Rx IP Checksum Error Frames - Number of frames belonging to the stream (with IP layer enabled) that contain IP checksum errors. These frames are discarded without BERT processing
- Rx UDP Checksum Error Frames - Number of frames belonging to the stream (with UDP layer enabled) that contain UDP checksum errors. These frames are discarded without BERT processing
- Rx TCP Checksum Error Frames - Number of frames belonging to the stream (with TCP layer enabled) that contain TCP checksum errors. These frames are discarded without BERT processing
- Rx ICMP Checksum Error Frames - Number of frames belonging to the stream (with ICMP layer enabled) that contain ICMP checksum errors. These frames are discarded without BERT processing
- Rx Ethernet Length Error Frames - Number of frames belonging to the stream (with Layer = Layer2) whose payload is less than the length indicated by the Payload Length field. These frames are discarded without BERT processing. This statistic is incremented only if the Payload Length field is enabled
- Rx IP Length Error Frames - Number of frames belonging to the stream (with Layer = Layer3/Layer4) whose payload is less than the length indicated by the IP Header’s Total Length field. These frames are discarded without BERT processing
- Rx UDP Length Error Frames - Number of frames belonging to the stream (with Layer = Layer4 and Layer4 = UDP) whose payload is less than the length indicated by the UDP Header’s Length field. These frames are discarded without BERT processing
- Rx Error Status – Status condition displays 3 states – IN_SYNC, NO_SYNC, NO_RX_DATA (when no data is received)
- Rx Bit Error Rate – This is relevant for PRBS patterns only. Displays the calculated Bit Error Rate for the PRBS pattern being received
- Rx Sync Loss Count – display the number of time Sync loss has occurred. This is relevant for PRBS patterns only
- Rx Bit Error Count – calculates and displays the Bit Error count. This is relevant for PRBS pattern only
- Rx Lost Frames – gives the count of total lost frames for that stream
- Rx Out of Order Frames – gives the count of total out of order frames which are received for the stream
- Rx Zero UDP Checksum Packet - Total number of UDP packets received with the checksum value ‘Zero’. From RFC 768 - An all zero transmitted checksum value means that the transmitter generated no checksum (for debugging or for higher level protocols that don't care)
- Rx RTD Frames- number of RTD frames received for the stream
- RTD (Round Trip Delay) – Provides round trip delay measurement for the stream
- Rx OWD Frames- number of OWD frames received for the stream
- OWD (Average) - Provides average one-way delay measurement in milliseconds or microseconds for the stream at the receiving end [within the same PC]
- OWD (Min) - Provides Minimum one-way delay measurement in milliseconds or microseconds for the stream at the receiving end [within the same PC]. Here, minimum value means the minimum One Way Delay value sampled out of all the samples taken every second
- OWD (Max) - Provides Maximum one-way delay measurement in milliseconds or microseconds for the stream at the receiving end [within the same PC]. Here, maximum value means the maximum One Way Delay value sampled out of all the samples taken every second
- HDL/PCAP File Recording Status - indicates the status of the HDL/PCAP recording for this stream (if enabled). Users can know whether the recording is in progress, stopped, running, etc.
- Binary File Recording Status - indicates the status of the Binary file recording for this stream (if enabled). Users can know whether the recording is in progress, stopped, running, etc.
- Rx Magic Pattern Mismatch Frames - Number of frames belonging to the stream in which the magic pattern does not match the configured value. These frames are discarded without BERT processing
- Rx Fixed Pattern Match Frames - Number of frames belonging to the stream (with Payload Type set to Fixed Pattern) in which the fixed pattern in the payload matches the configured value. These frames are considered good frames without errors
- Rx Fixed Pattern Mismatch Frames - Number of frames belonging to the stream (with Payload Type set to Fixed Pattern) in which the fixed pattern in the payload does not match the configured value. These frames are considered bad frames with corrupted payload
Cumulative Statistics:
- Total Frames – gives the total frames transmitted and received. This includes frames from all the user streams and default stream
- Rate – gives the cumulative rate of Tx and Rx
- Non Test Frames – gives the count of combined Non Test Frames transmitted and received
- IP Frames – total IPv4 frames transmitted and received
- UDP Frames – total UDP frames transmitted and received
- TCP Frames – total TCP frames transmitted and received
- ICMP Frames – total ICMP frames transmitted and received
- IGMP Frames – total IGMP frames transmitted and received
- Other L4 Protocol Frames – total Layer 4 frames transmitted and received, which do not belong to any of the above Layer 4 categories
- ARP Request Frames – total ARP Request frames transmitted and received
- ARP Response Frames – total ARP Response frames transmitted and received
- Other Frames – count of frames transmitted and received, which do not belong to any of the above categories
- Broadcast Frames – total Broadcast frames transmitted and received
- Unicast Frames – total Unicast frames transmitted and received
- Multicast Frames – total Multicast frames transmitted and received
- 64 Length Frames – total 64 byte length frames transmitted and received
- 65_127 Length Frames – total 64-127 byte length frames transmitted and received
- 128_511 Length Frames – total 128-511 byte length frames transmitted and received
- 512_1023 Length Frames – total 512-1023 byte length frames transmitted and received
- 1024_1518 Length Frames – total 1024-1518 byte length frames transmitted and received
- 1518 Length Frames – total > 1518 byte length frames transmitted and received
PacketCheck™ can generate reports at the end of every test. The reports include statistics, configuration information, NIC details, stream and aggregated statistics, and other test information. Reports can be generated in Portable Document Format (PDF), and Extensible Markup Language (XML) format with customizable headers, footers, comments and logos. User can also generate periodic reports during the test execution.
Report Generation Configuration
PDF Test Report
| Item No. | Item Description |
| ETH100 | PacketCheck™ |
| ETH200 | Two PacketCheck™ applications |
| Related Products | |
|---|---|
| PXE100 | PacketExpert™ 1G |
| PXN100 | PacketExpert™ 10GX |
* Specifications are subject to change without notice.
| Brochure |
| PacketCheck™ Brochure |
| Ethernet Testers - Comparison |
| Presentations |
| PacketCheck™ Presentation |
| Webinar |
|
 Back to VoIP Analysis and Simulation Index Page