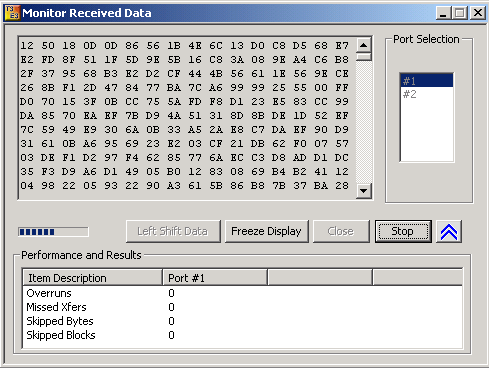
T3/E3 Monitor Received Data
This application has the ability to monitor the raw byte values received by the T3 (DS3)/E3 signal. This can be used for quickly testing the byte alignment of the received data. The following logic diagram depicts this operation. The raw bytes received from the network at the T3 interface are monitored and displayed on the selected ports.
- Freeze Display -pauses the display of the received data
- Left Shift Data -left shifts detected bytes by a single byte and test the byte alignment of the received data
- Statistics such as Underruns, MissedXfer (Missed Transfer), Skipped Bytes and Blocks can be observed Performance and Results pane for the selected port
 Back to List of T3E3 Basic and Optional Applications Main Page

