T1/E1 Oscilloscope Display
Rx Signal Monitoring applications are now included with T1E1 Basic Software
Overview
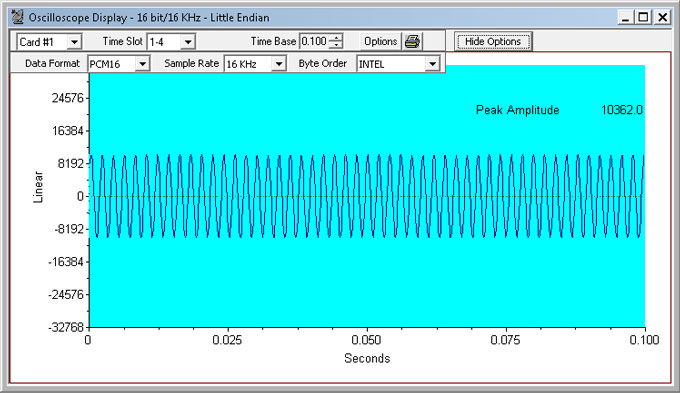
The PCM codes (amplitude of the incoming signal) of any selected timeslot are displayed in real time graph as a function of time. Timeslot selection and time base can be changed either to view different incoming timeslots or modify the duration of the display. The time base can be adjusted from approximately 0.005 sec full scale to 1.000 sec full scale. This application can be used to visually assess activities on the channel such as noise, tone, speech, etc. The data may be displayed for all signaling formats – alaw, mulaw, pcm16, pcm13, pcm14, pcm8, and different byte order for INTEL (Little Endian), and MOTOROLA (Big Endian).
Description
Display Control:
The graphical display in Oscilloscope can be magnified and moved by changing the time-base scale depending on the maximum and minimum limits. Further the oscilloscope window can be moved and resized as any other standard window.
Card #:
Select the card here if operating with more than one card.
Time Slot:
Select the timeslot to be monitored here. You can use the spin control to advance through the timeslots, or key in the desired time slot directly.
Time Base:
Select the duration of the time displayed. A minimum value of 0.005 sec to a max of 1.000 sec is possible. You can use the spin control to increase or decrease the time span, or key in the desired time directly.
Decode Options
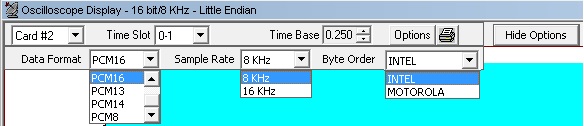
Click on Decode options button, this displays options to select Data Formats, Sample Rates, and Byte Orders.
Data Format:
- aLAW: Default for T1 analyzer
- muLAW: Default for E1 analyzer
- PCM16: For 16-bit 8KHz signals, two consecutive timeslots are used. The byte order in which the two bytes of 16-bit data is determined by the selection of INTEL or MOTOROLA byte order options.
Similarly, For 16-bit linear, 16 KHz signals, four consecutive timeslots are used. The lower-numbered timeslot pair carries the earlier 16-bit sample point in time, while the higher-numbered timeslot pair carries the later 16-bit sample point in time. The byte order is determined by the selection of INTEL or MOTOROLA options. The four timeslots, when used in this fashion, make up a four-byte hyperchannel
- PCM13: Displays 13 bit data on two selected timeslots for 8KHz sample rate. Byte order is determined by the selection of INTEL or MOTOROLA options
- PCM14: Displays 14 bit data on two selected timeslots for 8KHz sample rate. Byte order is determined by the selection of INTEL or MOTOROLA options
- PCM8: Displays raw data on single timeslot without any decoding
- Sample Rate: Sample rate option is available only for PCM16 data format. 8KHz and 16KHz sample rate options are available
- Byte Order: Provides INTEL or MOTOROLA byte order options
- INTEL (Little Endian): The lower-numbered timeslot carries the least-significant byte (LSB), while the higher-numbered timeslot carries the most-significant byte (MSB)
- MOTOROLA (Big Endian): The lower-numbered timeslot carries most-significant byte (MSB), while the higher-numbered timeslot carries the least-significant byte (LSB)
- Hide Option: Click on Hide Options button to hide the decode options toolbar
Options:
Click Options, a drop-down menu appears. The various options are:
- Print Page option is to print the Oscilloscope Display window on the current selected printer
- Print Graph option is to print the graphic portion of the Oscilloscope Display on the current selected printer
- Printer Setup option is to show the standard Windows Printer Setup dialog
- Printing options is to show the Print Parameters dialog, which allows you to specify the options for printing or copying graphs
- Copy Graph option is to print the graphic portion of the Oscilloscope Display on the clipboard
- Copy Page option is to print the Oscilloscope Display window on the clipboard
- Save as Metafile option is to save the graph as a meta file
- Parameters is to show the Graph Parameters dialog, which allows you to Control certain aspects of the graphic display such as its position, background color
Example
Connect a loopback cable, transmit a tone of 1004 Hz into a timeslot on card 2; observe the oscilloscope display for the desired timeslot on card1. Adjust the time base to get a clear representation of the sine wave.
 Back to List of T1E1 Basic and Optional Applications Index Page