GL Enhances Network Surveillance Software
for Wireless, IP and TDM Networks
Welcome to another September 2015 issue of GL Communications' newsletter providing information and insight into our enhanced Network Surveillance Software.
Overview
In today's advanced telecom networks, surveillance of network characteristics is becoming more important than ever before. Performance Monitoring, Capacity Management, Troubleshooting, Security, Fraud Detection, Alarm Monitoring, Billing Verification, Remote Protocol Analysis, Failure Prediction and Traffic Engineering are some aspects that necessitate continuous monitoring of network health. A network operator, service provider, or equipment manufacturer must have the means to perform the aforementioned surveillance tasks cost-effectively, remotely, automatically, and non-intrusively. GL's versatile Networking Monitoring Tools are one stop solution for customers' network surveillance needs.
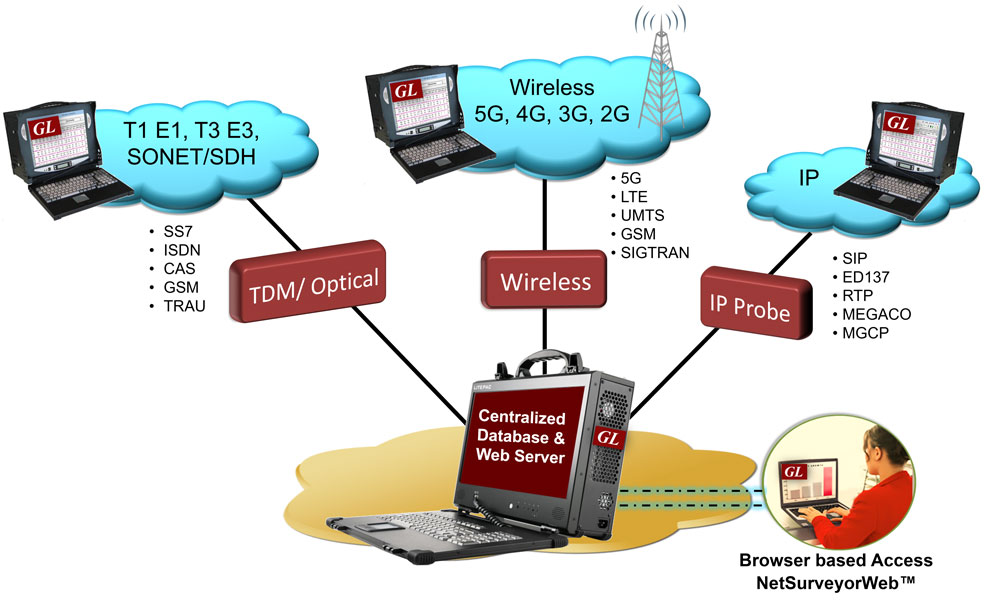
GL has scalable network monitoring and testing probes and centralized collection and reporting systems for today's telecom networks. The probes provide instant visibility into the performance and operation of TDM, VoIP, and Wireless networks.
GL's Network Monitoring and Diagnostic Systems are web-based applications that facilitate display of CDRs by connecting to TDM, Optical, or IP probes through a web server for monitoring physical layer, signaling and traffic. Currently supported protocols include SIP, VoIP (SIGTRAN, SIP, H.323), SS7, ISDN, GSM, TRAU and MAP (coming soon). Support for additional protocols - IuCS, IuPS, LTE, and GSM A are coming soon. GL provides a variety of solutions for network wide monitoring and surveillance solutions - Visit Network Surveillance System (NMS) for more details.
GL's current NMS solutions using NetSurveyorWeb™ for VoIP and TDM networks are outlined below:
- IP Network Monitoring and Surveillance System (passive / non-intrusive) - SIP, RTP, H.323, SIGTRAN, (MAP, CAP, INAP -coming soon)
- Wireless Network Monitoring and Surveillance System (passive / non-intrusive) - GSM, UMTS, LTE, Diameter, IMS
- TDM and Optical Network Monitoring and Surveillance System (passive / non-intrusive probes) - SS7, ISDN, GSM Abis, TRAU
- Digital T1 / E1 Line Monitoring, Test, and Diagnostic System
GL's NetSurveyorWeb™ is based on a scalable and flexible architecture. It is used in conjunction with GL's Protocol Analyzer probes to non-intrusively monitor from one or many testing locations. GL's protocol analysis probes feed data to centralized database (Oracle) in real-time for further analysis. The probes provide instant visibility into the performance and operation of TDM, VoIP, and Wireless networks. The NetSurveyorWeb™ client application then locally or remotely facilitates to view records from the database using a simple web browser application.
A common characteristic of all of GL's Network Monitoring Systems is similarity between the TDM, VoIP, and Wireless NMS solutions. Uniform features, scalable probes, central database servers, webservers, redundancy, and this uniformity results in enhancements, reliability, and user friendly systems. Enhancements to one system are automatically incorporated into others. Reports, administration, and maintenance become easy and uniform.
Maintenance engineers can securely access the network view from literally "anywhere" in the world where Internet access is available. They can also monitor, diagnose, and troubleshoot remotely with simple to use scripts.
GSM TRAU CDR View
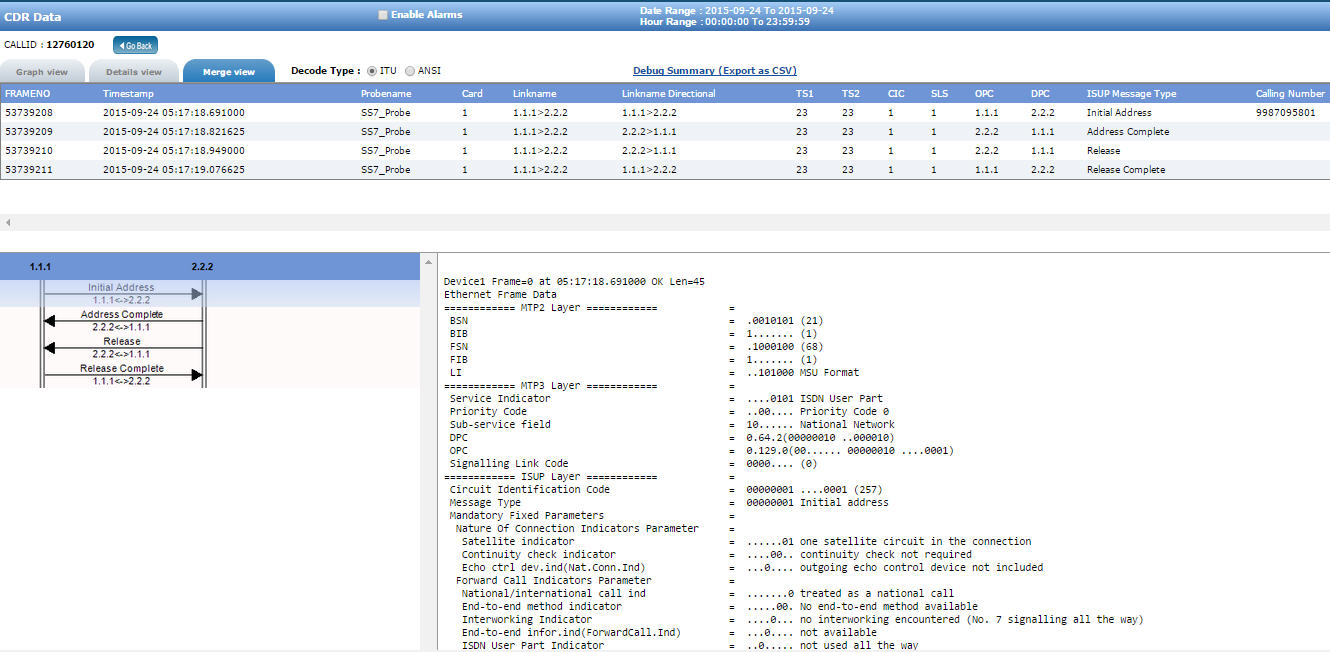
SS7 CDR View

Multi Protocol CDR View
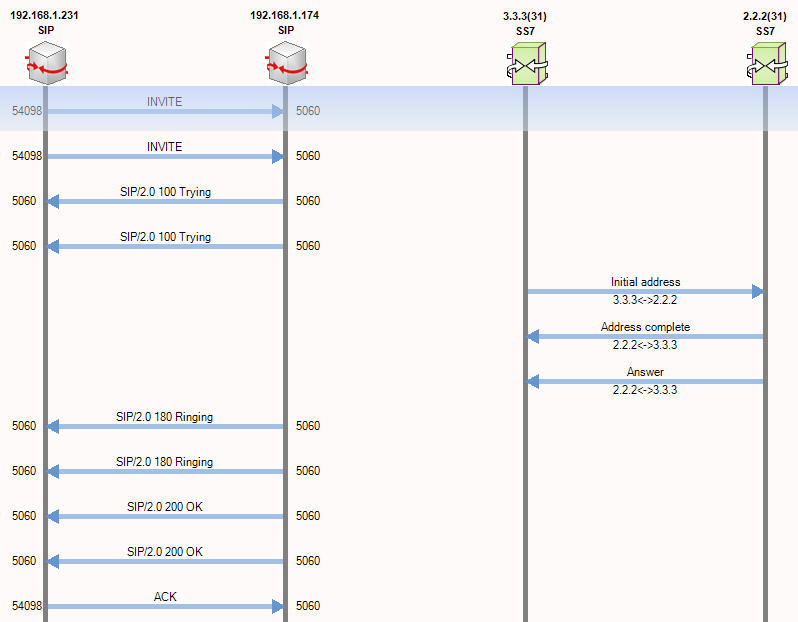
Multi Protocol Call Flow
Email, Audio & Visual Alerts
Network Link Status
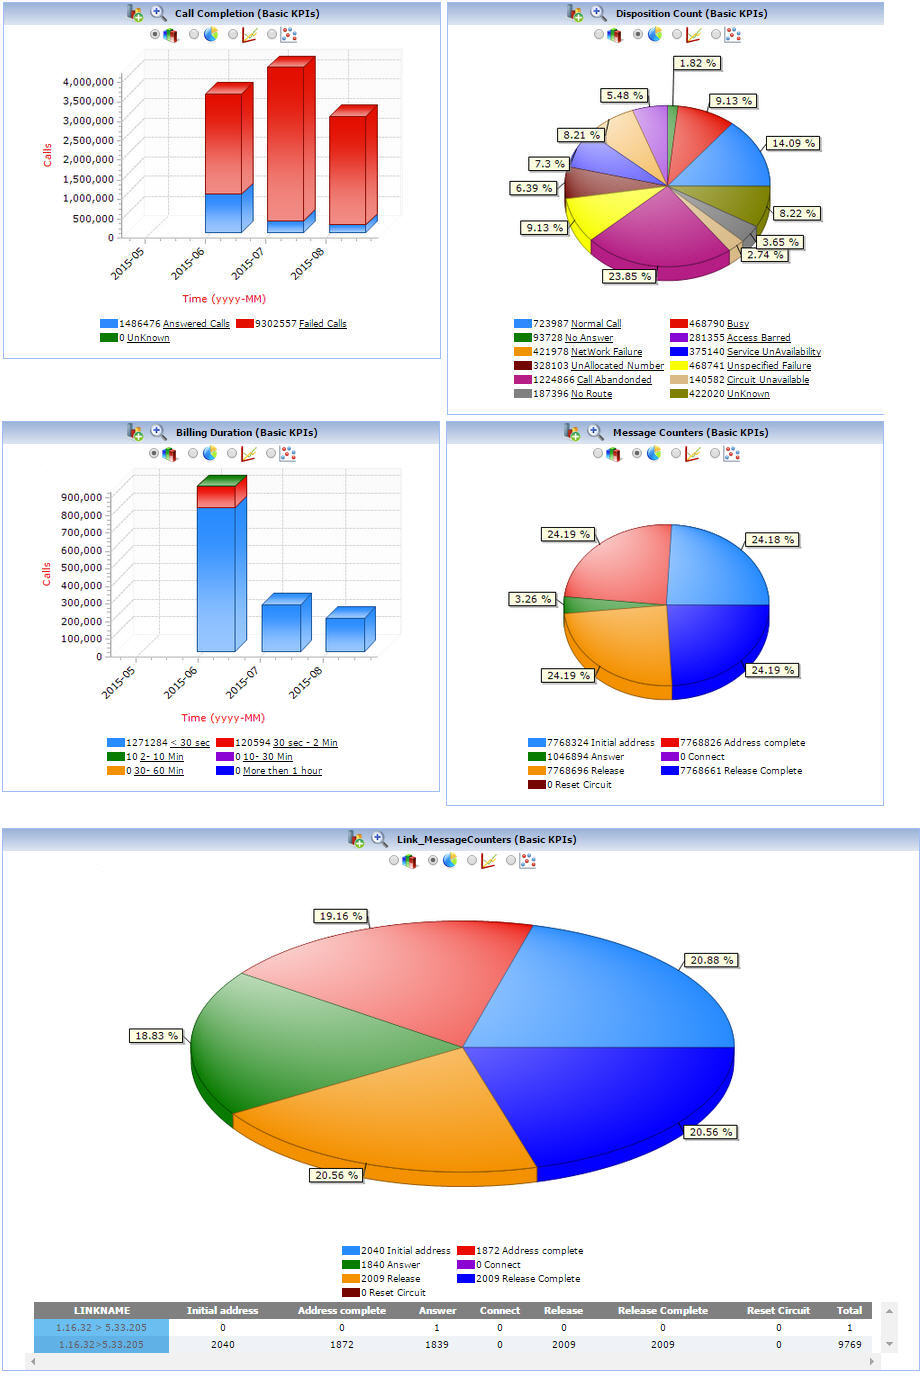
TDM KPI
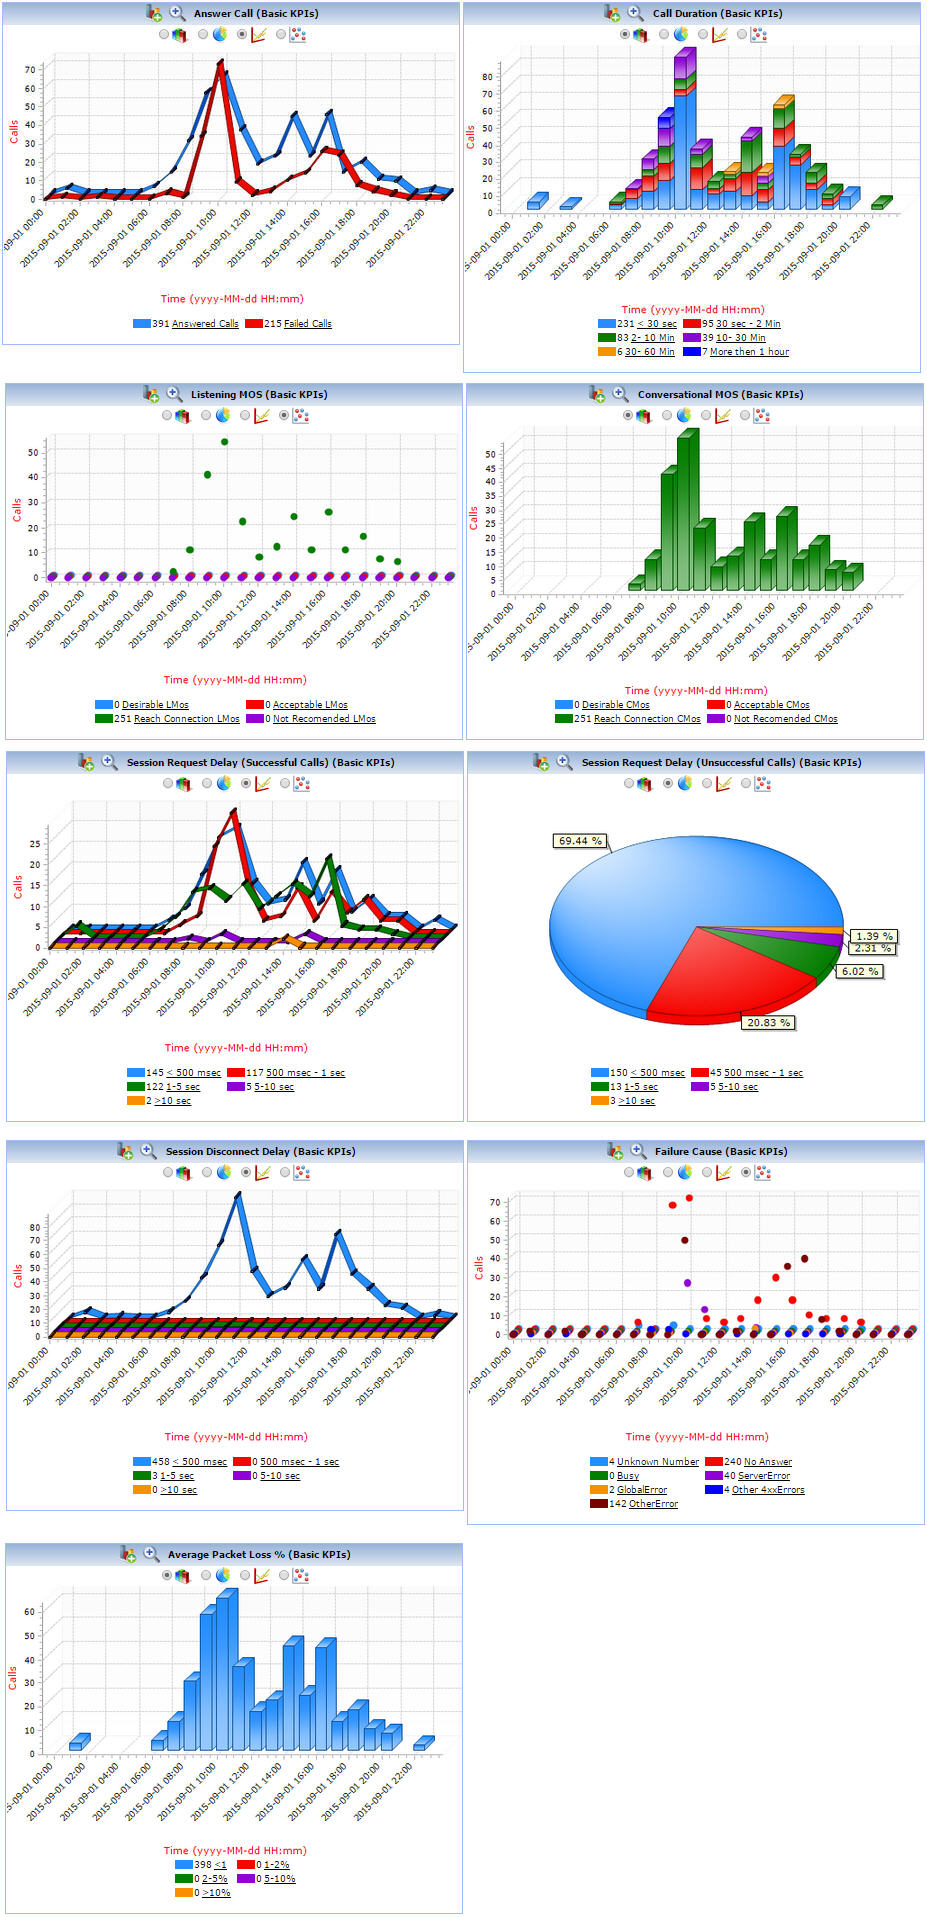
VoIP KPI
New Features Introduced
Multi-protocol call flow
This feature is useful in testing inter-operability of different types of networks, say for example SIP-to-SS7. The Multi-protocol Call Flow provides the flow of messages exchanged between different protocols in ladder diagram with ability to display respective signaling decodes, thus providing visibility into complete end-to-end call flow.
Merge View in Call-flow
Merge view in call-flow feature provides graph display, decode and call detail information in a single view. Now user can have an all encompassing view of graph, decode and call detail information in three different panels with hide/show sliders. Decode engine involved here also supports multiple sessions and multiple protocols.
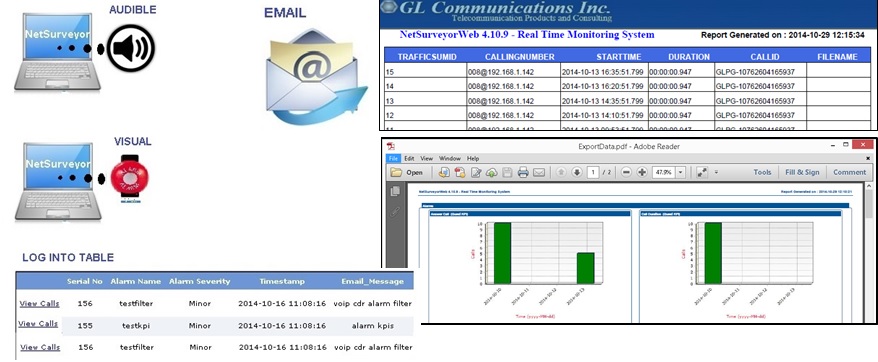
Export Call Detail Records (CDR) Call-flow in PDF format
Export CDR & call-flow provides an ability to export currently viewed CDR(s) and associated call-flow messages in PDF format respectively
Enhanced Reports
CDR reports can be created with aggregate functions like Sum, Average, Percentage and any grouping of columns other than start time. Charts are depicted in 3D representation with ability to zoom in/out feature.
Protocol Switch
The feature is introduced to simply select any supported protocol from the drop-down menu such as SS7, ISDN, GSM, VoIP, TRAU, or T1 E1 Layer 1 for Physical Layer Monitoring, with uniform features and architecture for all protocols.
Alarms and Alerts
Trigger alarms and alerts whenever calls-of-interest occur, a network link failure is detected, or regularly at scheduled intervals. Directly access the pre-configured filter profiles or the KPI profiles to trigger alarms and alerts either when the custom filters conditions are passed, or send the pre-defined KPI report hourly, daily, monthly or yearly. Alert actions can be defined based on the output of the alarm conditions such as like email alert, visual alert, audible alert, SMS alerts, exporting data, setting alarm severity, or even log into tables for future analysis. Alarm Severity type can be set as Minor, Major, or Critical.
Other Important Features
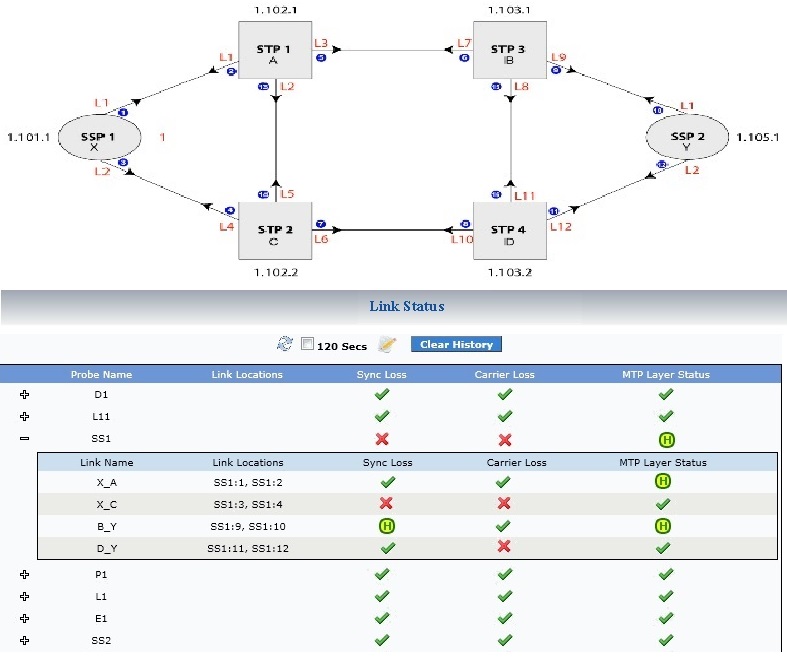
Network Status or Link Status
The Network Status feature provides real-time status of all deployed probes. For T1 E1 networks, this feature displays physical and Data Link Status details such as Sync Loss, Carrier Loss and MTP Layer Status for all the available probes across the network.
User can drag and drop any data column to Report View, save the configurations, and re-use depending on the monitoring requirements.
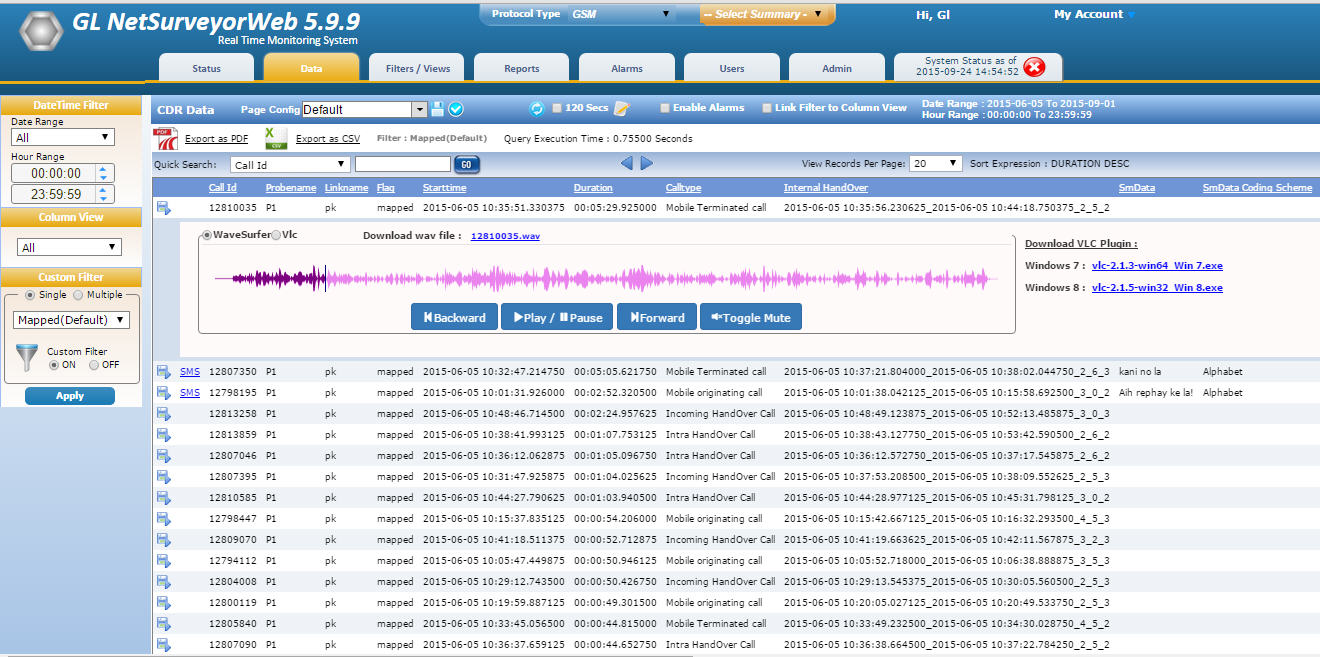
Call Detail Records (CDR) View
The CDR view provides visibility into each individual call. All Key Performance Indicators (KPI) information is provided and each call can be investigated. Basic information displayed about each call includes Call Id, Probe Name, Card No, Calling Number, Called Number, and more.
Call Flow View
The call flow graph allows easy verification of the messages exchanged and the status of each call. Users can also highlight any messages in the left-hand pane ladder diagram and observe the corresponding message decode details in the right-hand pane of the window.
Customized Graphs: (Bar/Pie/Line/Point chart types)
User can create simple SQL queries to generate any type of graph, or use the standard set of graphs already included in the software such as Call Volumes (Incoming, Outgoing, Call Failure Causes), Call Duration Analysis, Call Quality Analysis (CMOS, LMOS, Delay, SNR, Echo, Data Tests, etc.).
Collect only Precise and Filtered data
Ability to sort, filter and export the calls in CSV format within a user-defined time frame
Flexible Report Generation
feature to export "custom reports views" in PDF or CSV file formats
For more information on the product feature, please visit Network Monitoring and Test Products web page.
 Back to Newsletter Index Page