GL Announces MFC-R2 Bulk Call Emulation & Analysis
Welcome to a November 2013 issue of GL's Newsletter providing information on our MFC-R2 Bulk Call Emulation using MAPS™ and Analysis using CAS Analyzer.
Overview
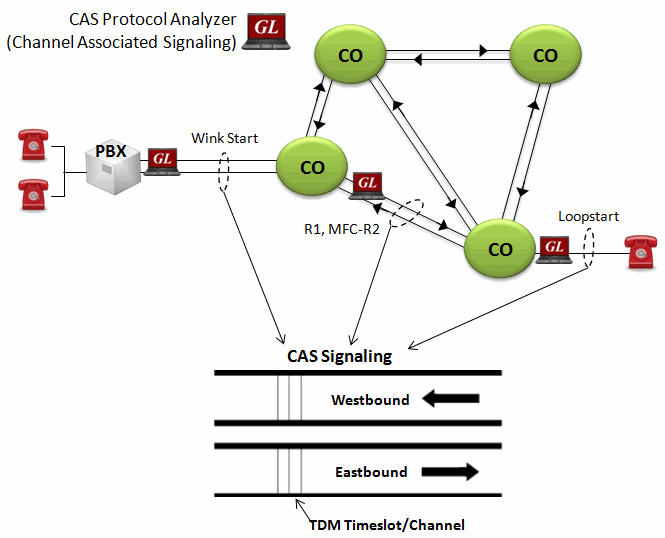
E1 Multi-Frequency Compelled R2 (MFC-R2) signaling is a Channel Associated Signaling (CAS) protocol used over E1 digital voice and signaling networks.
GL's Message Automation & Protocol Simulation (MAPS™), a protocol simulation and conformance test tool that supports a variety of protocols such as SIP, MEGACO, MGCP, SS7, ISDN, and many others, also supports CAS protocols, including R1 Wink Start, Loop Start, MFC-R2, and others.
E1 MFC-R2 Signaling Emulation, as defined by the ITU Recommendations:Q.421-Q.442, can be supported by extending existing MAPS scripts. The Emulator can automate the CAS testing procedure and allow users to establish single/bulk CAS calls, and send/receive TDM traffic such as DTMF/MF digits, Tones, Voice, and Fax over the T1 E1 networks. In addition, GL's CAS Analyzer supports real-time monitoring and decoding of CAS signaling events over T1 E1 network. Both applications can be used with any of the GL’s T1 E1 Analyzer Hardware Platforms.
CAS MFC-R2 Bulk Call Simulation
MAPS™ CAS MFC-R2 Emulator is a client-side application used to perform testing using CAS signaling transmission and detection of traffic over T1 E1 using scripts, and offers a complete solution for testing, troubleshooting, and maintenance of devices and networks implementing CAS protocols.
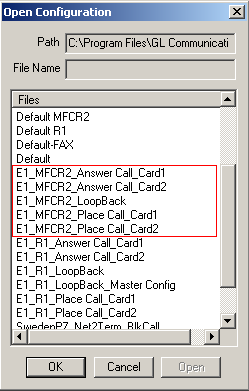
MAPS™ CAS MFC-R2 Emulator supports bulk call generation feature with multiple calls placed/answered on any or all timeslots. Ready configuration files are available, as shown in the Figure, which can be customized and used to establish bulk calls on multiple timeslots. The call generation is automatically filled with multiple instances of the CAS scripts set to run on different timeslots. Each of these instances can be selected and run for multiple iterations. The quick configuration option in call generation can be used to customize multiple instances simultaneously for changing the timeslots and number of iterations.
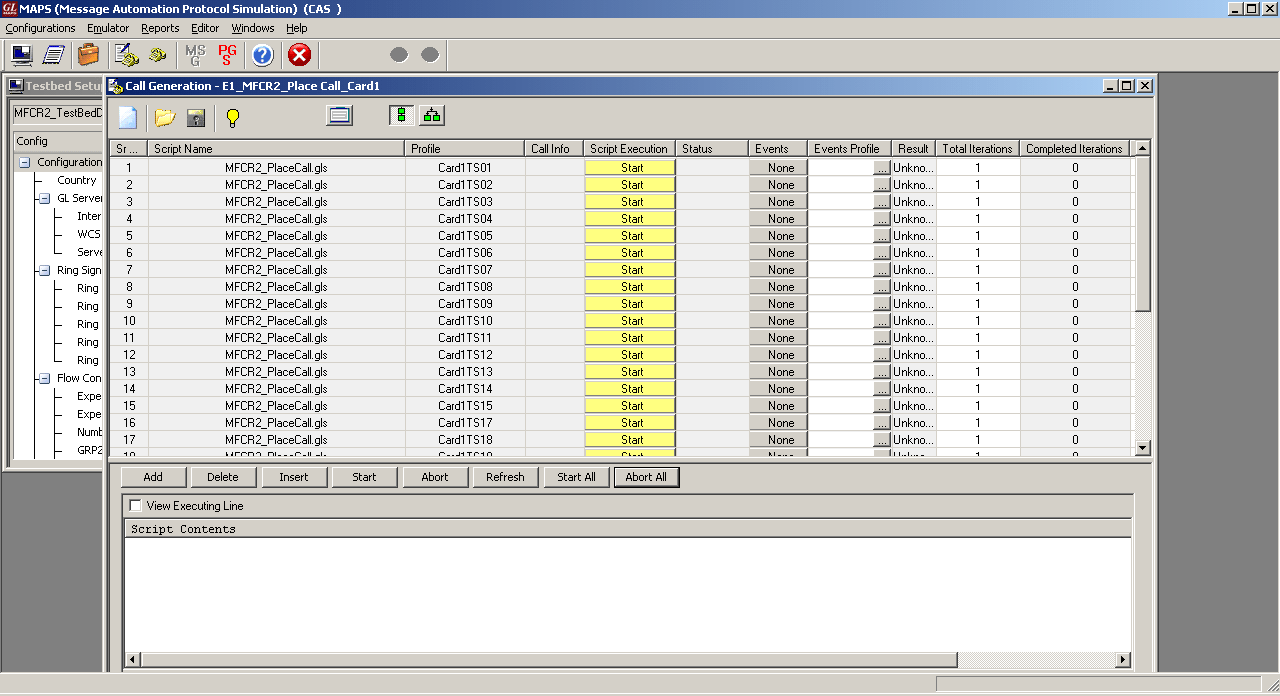
Multiple instances of same script loaded on different timeslots and cards are shown below in the image. Different control options have been provided to begin/end the Single/Bulk call test and for debugging purposes.
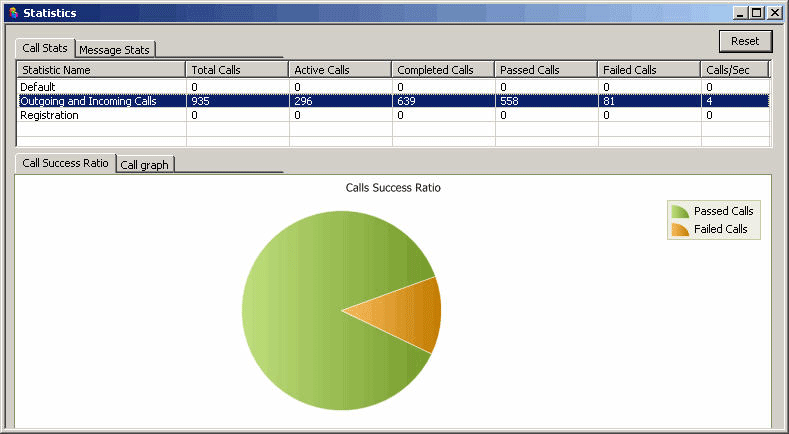
Stress/Load testing can also be done with different statistical distribution patterns. Call duration can also be randomized using different statistical distributions by properly configuring scripts and profiles. Stress/Load testing parameters like calls/sec and simultaneous calls/sec can be monitored in the statistics window.
MAPS™ CAS provides tools like Script and Profile Editors to customize call flow. This helps in establishing bulk calls on different timeslots carrying different traffic, call durations and other call flow parameters
The Script Editor allows the user to create / edit scripts and to define variables for the protocol fields.
Profiles are used to provide the user configured values to the fields through variables, which are replaced during the course of a call. Profile editor and built-in quick configuration tools can be used to quickly generate and modify profiles for customizing call flow parameters during runtime as well as for different timeslots.
Call Statistics & Status
By default, all call handling scripts (irrespective of the type of the functions) are assessed by MAPS™ to provide statistical information about Total Calls, Active Calls, Completed Calls, Passed Calls, Failed Calls, and Calls/Sec. It is also possible to characterize the statistical information under different groups of call handling scripts under a unique heading. In addition, Call Generation and Call Reception windows provide useful call status & script execution results.
Bulk CAS MFC-R2 Call Analysis
GL's CAS Analyzer supports real-time monitoring and decoding of CAS signaling events over T1 E1 networks. Supported standards include MFC-R2, R1, Loop Start, and many other variations.
Main Features
- Real-time and Offline Analysis - Users can capture and analyze frames in real-time and record all or filtered traffic into a trace file for further analysis. Any protocol field can be added to the summary view, filtering, and search features provide users more flexibility to monitor required protocol fields.
- Filtering and Search - Users can record all or filtered traffic into a trace file. Filter and search capabilities add a powerful dimension to the CAS Analyzer. These features isolate required frames from all the captured frames in real-time.
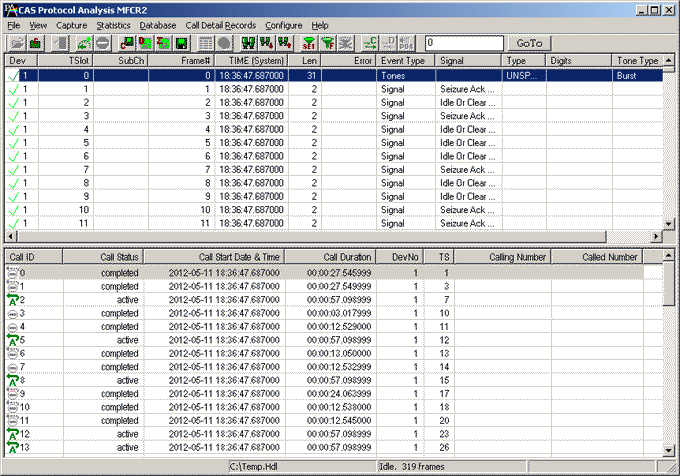
- Call Detail Record View - Important call specific parameters like Call ID details, the calling status whether the call is active or completed, calling number, called number, and so on are calculated and displayed in Call Detail View. Additionally, users are provided with the option to search a particular call detail record from the captured traces.
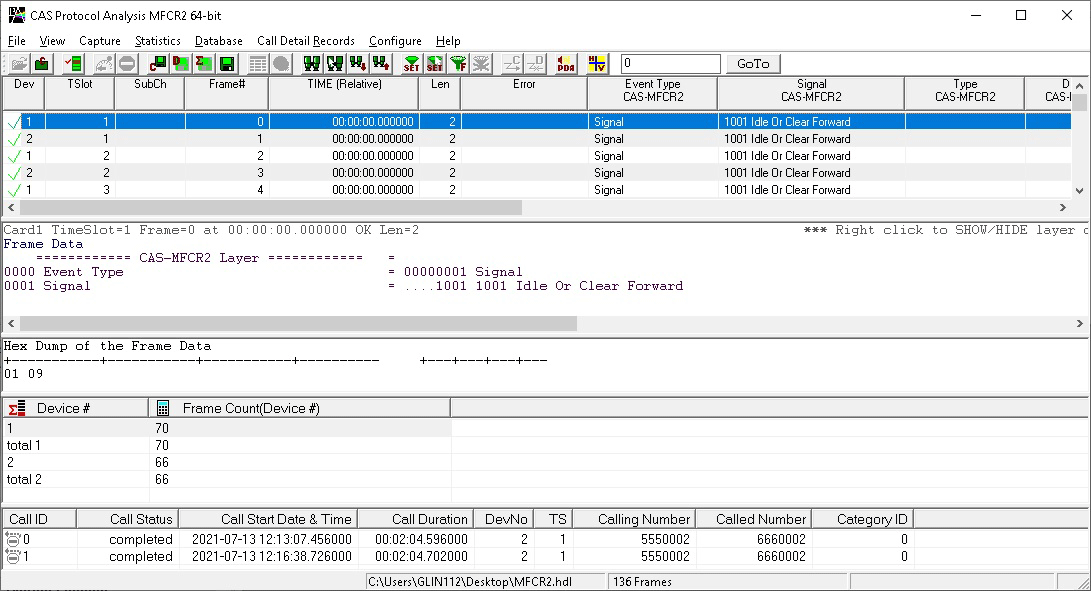
Summary view of CAS analyzer is depicted below displaying port number, frame, length, event type, signal type, tones, digits, and more. User can select a frame in summary View to analyze and decode in the detail view. The Hex dump view displays the frame information in HEX and ASCII format. The contents of detail and hex dump view can also be copied to clipboard. For more details user can view the CAS Protocol Analyzer page.
 Back to Newsletter Index Page