Newsletter: GL Announces ISDN & T1 E1 Physical Layer Monitoring Software
Welcome to another April 2016 issue of GL Communications' newsletter providing information and insight into our ISDN Network Surveillance & T1 E1 Physical Layer Monitoring Software.
Overview
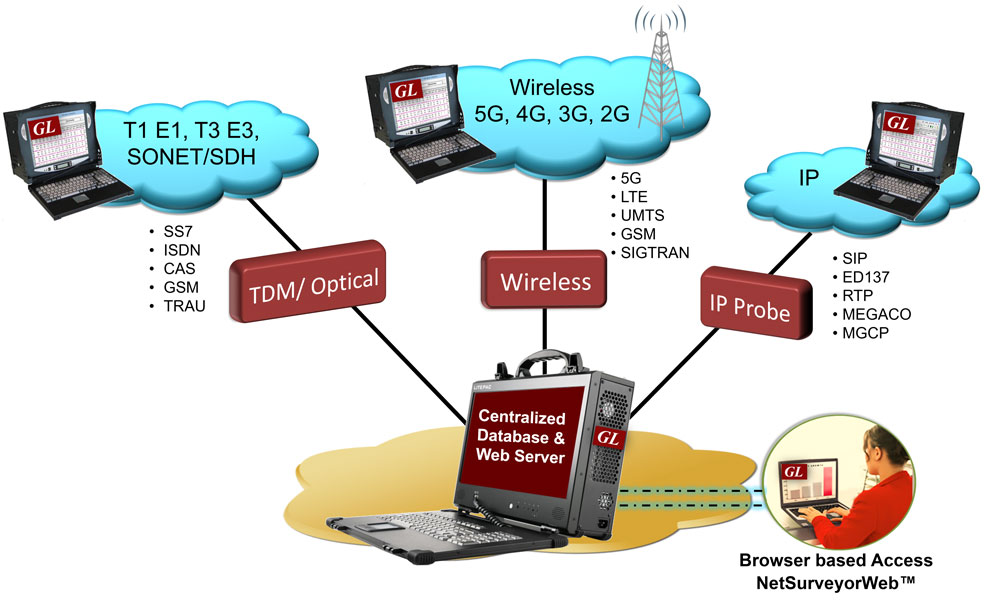
GL provides a variety of solutions for network wide monitoring and surveillance. GL's Network Monitoring Solutions using NetSurveyorWeb™ for TDM networks cover the following:
- TDM and Optical Network Monitoring and Surveillance System (passive / non-intrusive probes) - SS7, ISDN, GSM Abis, TRAU
- Digital T1 E1 Line Monitoring, Test, and Diagnostic System
GL's NetSurveyorWeb™ is based on a scalable and flexible architecture. It is used in conjunction with GL's Protocol Analyzer probes to non-intrusively monitor from one or many testing locations. GL's protocol analysis probes feed data to a centralized database (Oracle) in real-time for further analysis. The probes provide instant visibility into the performance and operation of TDM, VoIP, and Wireless networks. The NetSurveyorWeb™ client application then locally or remotely facilitates to view records from the database using a simple web browser.
Hybrid Network Surveillance SIP-TDM (ISDN/SS7)
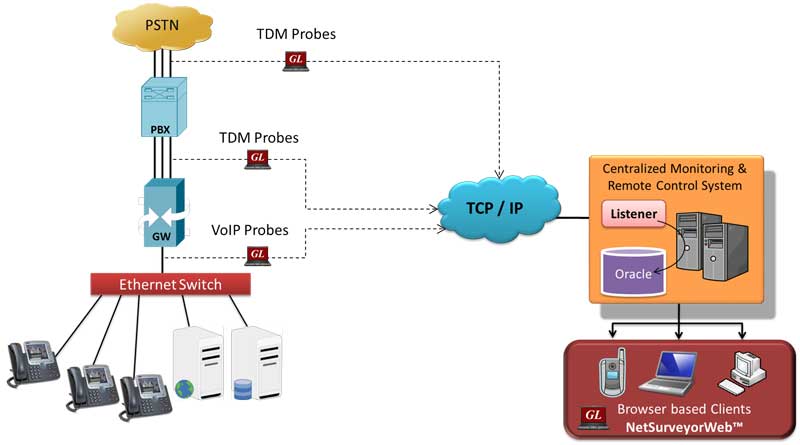
GL's NetSurveyorWeb™ system comprises of three tier architecture. The first layer consists of GL's Protocol Analysis Probes which are capable of tapping into live call traffic and non-intrusively capturing the signaling messages. These messages are used to build the CDRs. The second layer is the Database Storage Layer. The captured data is stored here and this database can be automatically archived to ensure historical information. The last layer is the Data Access Layer where the data presentation logic is contained. Each of these components is briefly explained below.
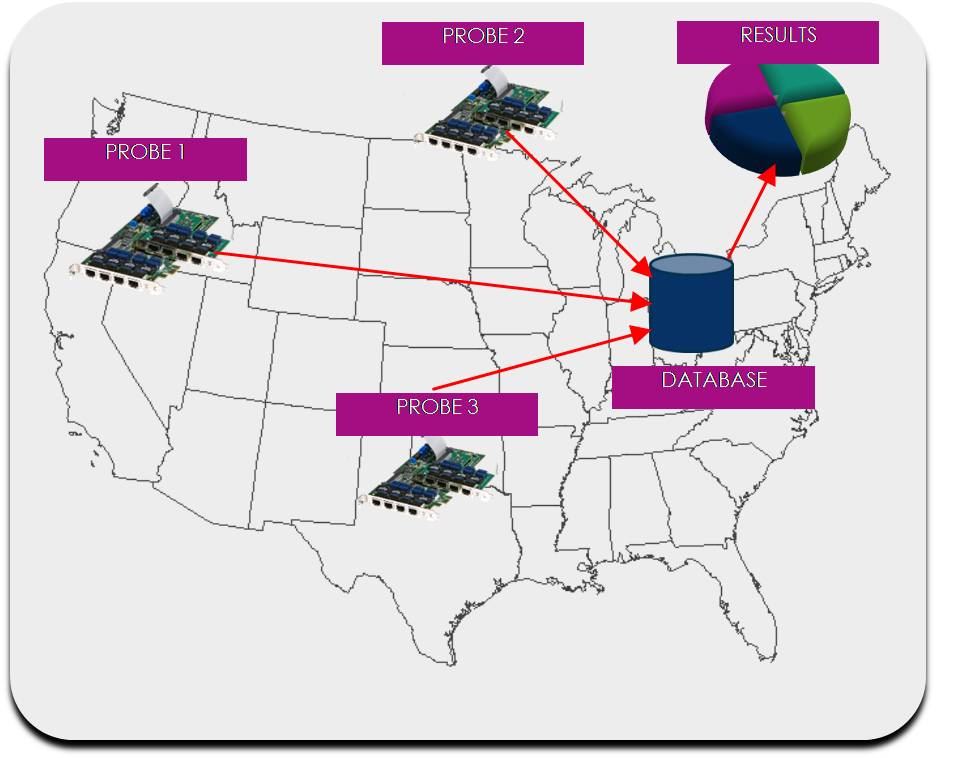
As depicted in the above diagram, probescollect layer 1 (physical layer), layer 2 (data link layer) and layer 3 (network layer) information. Probes can be T1 E1/T3 E3/ OC-3 STM-1/ OC-12 STM-4/IP and can run protocol analysis applications along with the necessary hardware and software. The probes can be controlled locally using the protocol analyzer application or remotely using GL's Client-Server application.
The analyzer hardware for TDM and optical networks can be connected non-intrusively in Monitor or Bridge Modes, or alternatively the data can be looped through the cards. Multiple Link Sets or 64 kbps signaling channels can be monitored simultaneously by grooming through a digital cross-connect.
The Probes non-intrusively monitor physical lines of the network then transmit CDRs, protocol summary, frame data in hex dump, and statistics to a central database. These probes are connected to the database via TCP/IP using ODBC compliant real-time database loader. Only precise and filtered data (user selectable) is collected into the centralized database.
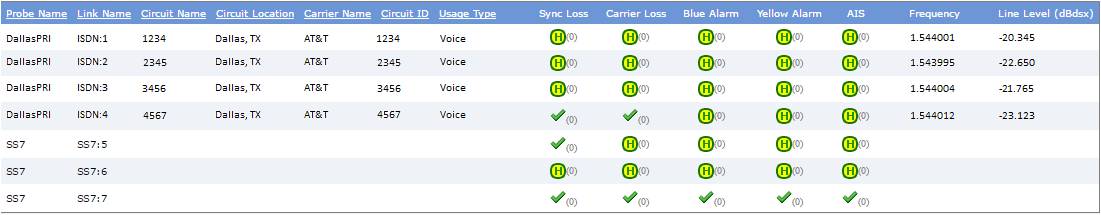
T1 E1 Physical Layer Monitoring
Physical Layer monitoring is also available using the same capture probes. The layer 1 alarms and statistics are sent to the centralized database along with the protocol information of the call or as a stand-alone service. GL's NetSurveyorWeb™ provides easy viewing of the entire network or the option to drill down to a specific interface. Alarm timestamping, developing alarm trends and trigger-based actions are all features of the product.
ISDN Layer Monitoring
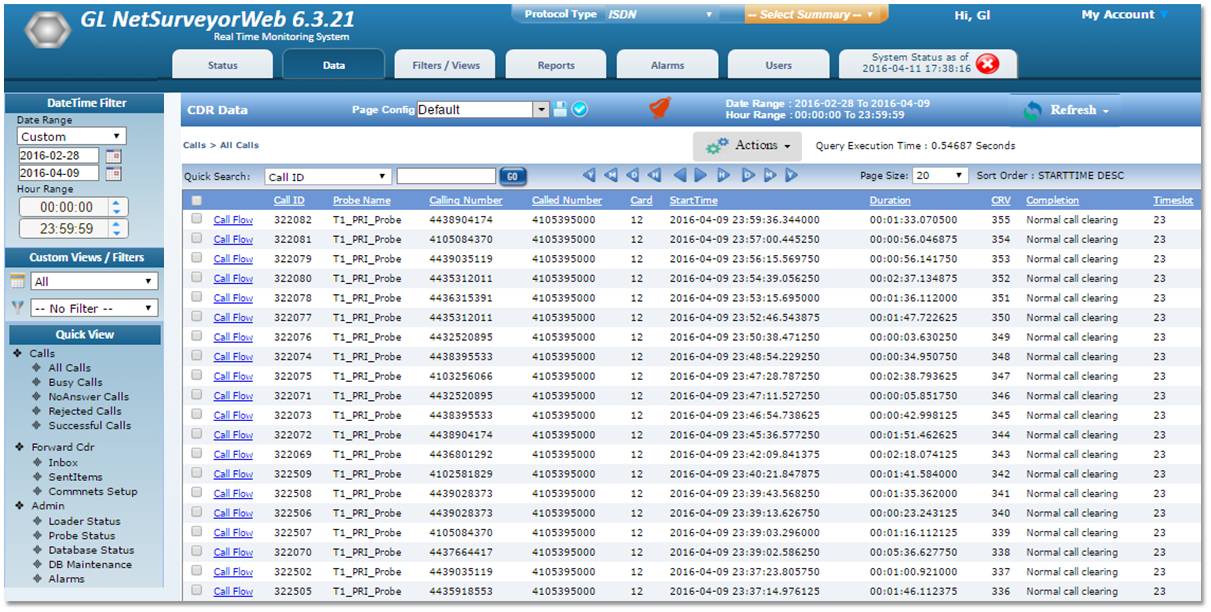
ISDN Layer monitoring provides capturing and analyzing stream of frames on an ISDN PRI links. CDR parameters indicate status of each call i.e. active/completed, duration of completed call, called and calling party number, call reference value (CRV) etc. Summary View displays Device #, Time Slot, Frame #, LAPD information, ISDN Message types and more. Each Call is also depicted by message sequence, which gives ladder diagram of the call flow between the Called and the Calling numbers. This call flow graph allows easy verification of the status and the messages exchanged in a call. Users can highlight any messages in the ladder diagram and observe the corresponding detail decoded message details.
Key Performance Indicators (KPIs) and Reports
KPIs provide the user a graphical view of the collected data. These generally will show network summary information, but can also be used to view specific "events of interest". GL's NetSurveyorWeb™ provides a very flexible SQL-based query design for KPI configuration. This allows even the most complicated of scenarios to be graphed and monitored.
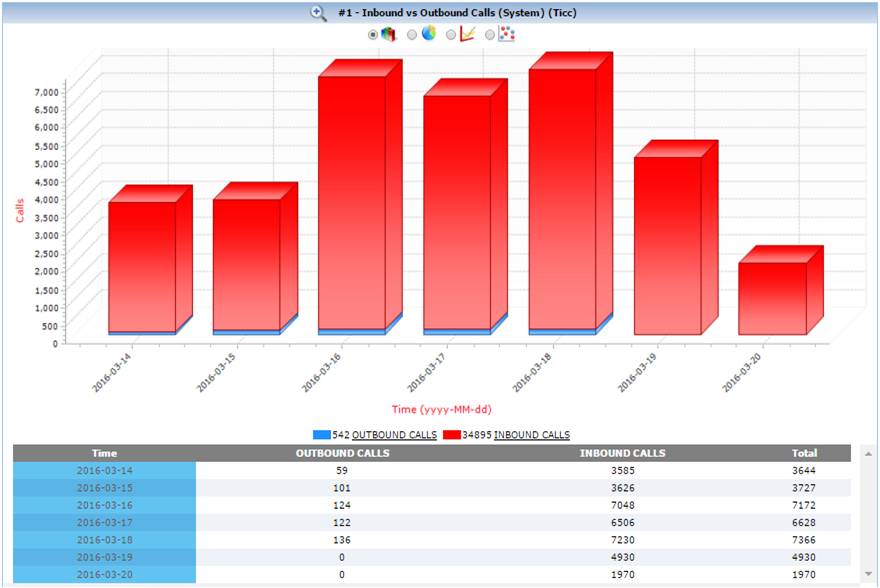
Inbound Vs Outbound Calls
This is a simple KPI that shows the total number of inbound calls (red) vs. outbound calls (blue) at a certain ISDN-PRI trunk.
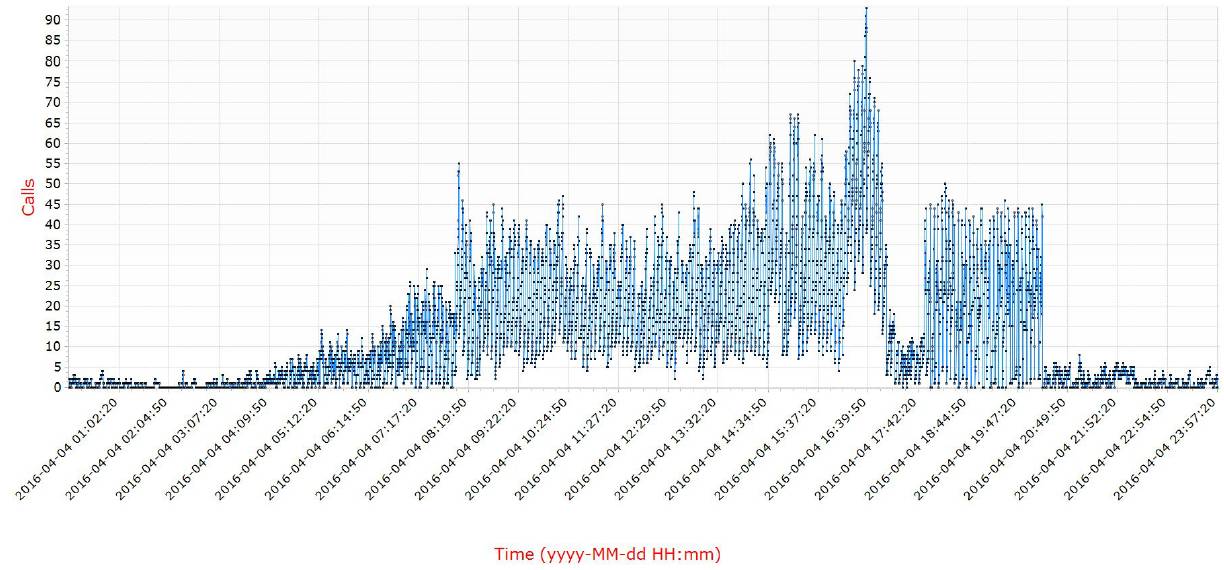
Simultaneous Calls on All Trunks
This graph shows the call volume trends throughout the day. Users can examine the number of simultaneous calls that occurred at a certain time of day.
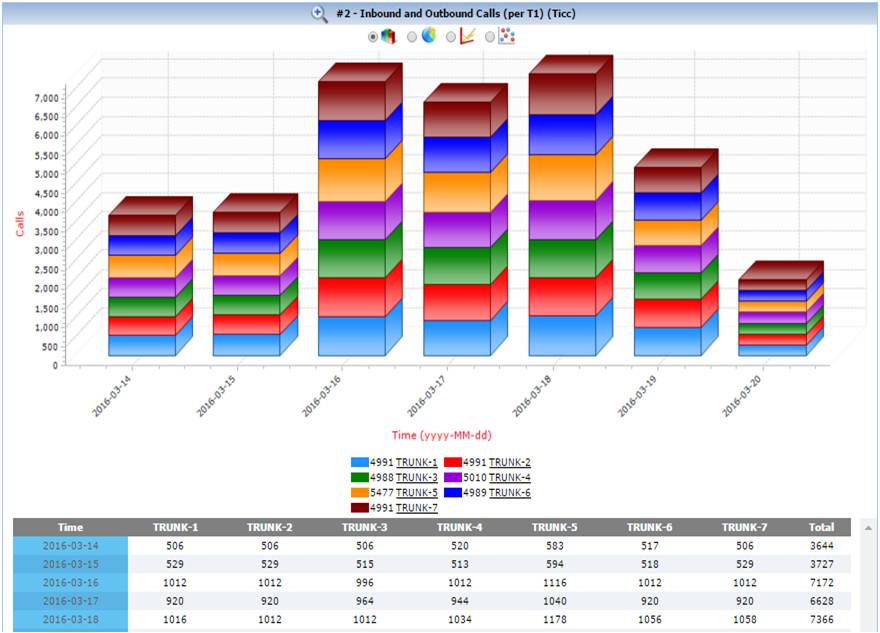
Trunk-Wise Report
The KPI provides Trunk wise Inbound Vs Outbound Calls information.
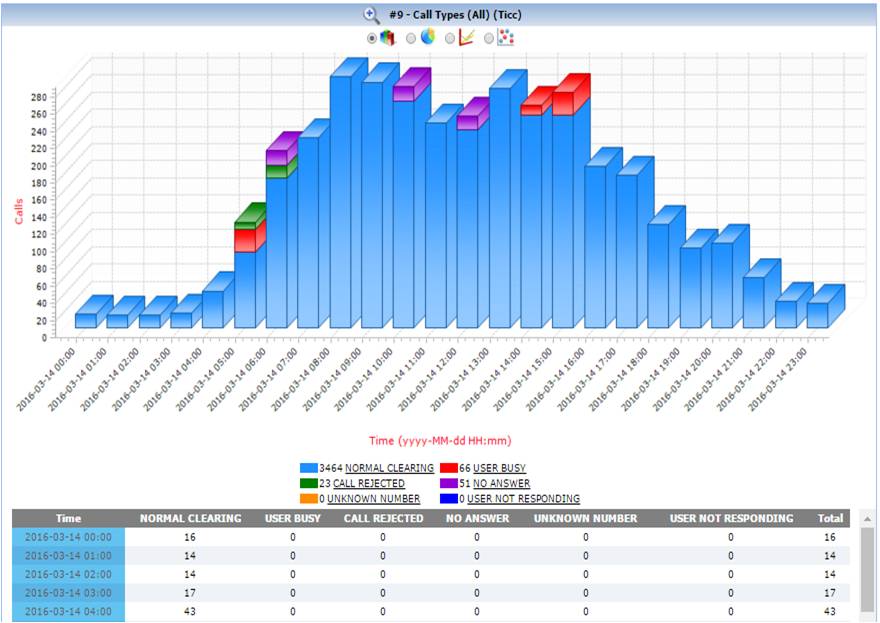
Call Types
This KPI allows the user to quickly identify the different call completion types on the network. Call completion types in ISDN include: Normal Call Clearing, User Busy, Call Rejected, etc.
Real-time Alarm Notifications
Users can configure the NetSurveyorWeb™ to search for "events of interest". When an event has occurred, the software can be configured to take an action. Actions include sending an e-mail to a Network Administrator or recording the event in the Alarm Log.
Examples: If ISDN-PRI call volume is greater than 90% capacity, send an e-mail to the Network Administrator Or, if 301-555-1212 appears in a CDR, then log event in the Alarm Log Or If T1 E1 link is down then send an E-mail alert.
Reports Scheduling
NetSurveyorWeb™ can be configured to send daily, weekly and monthly reports.
Example: Every night send an e-mail containing a report showing the number of inbound vs. outbound Calls entering a specific location.
Important Applications
- Comprehensive analysis from overall network health to detailed protocol monitoring
- CDR, fraud detection and location, remote protocol analysis and troubleshooting, real-time signaling monitor, traffic optimization engineering, and statistics
- Determine actual call signaling routes to verify network functionality under all situations including congestion and loss of SS7 nodes
- Revenue and billing verification, alarm monitoring, intrusive testing
- Quality of service measurements, call trace and recording
 Back to Newsletter Index Page