NetSurveyorWeb™ -
Centralized Network Surveillance System
Centralized web-based surveillance system that enables real-time monitoring, analysis, and reporting of voice and data traffic across wireless, IP, and TDM networks.
Request a Demo / Quote Brochure LIVE Demo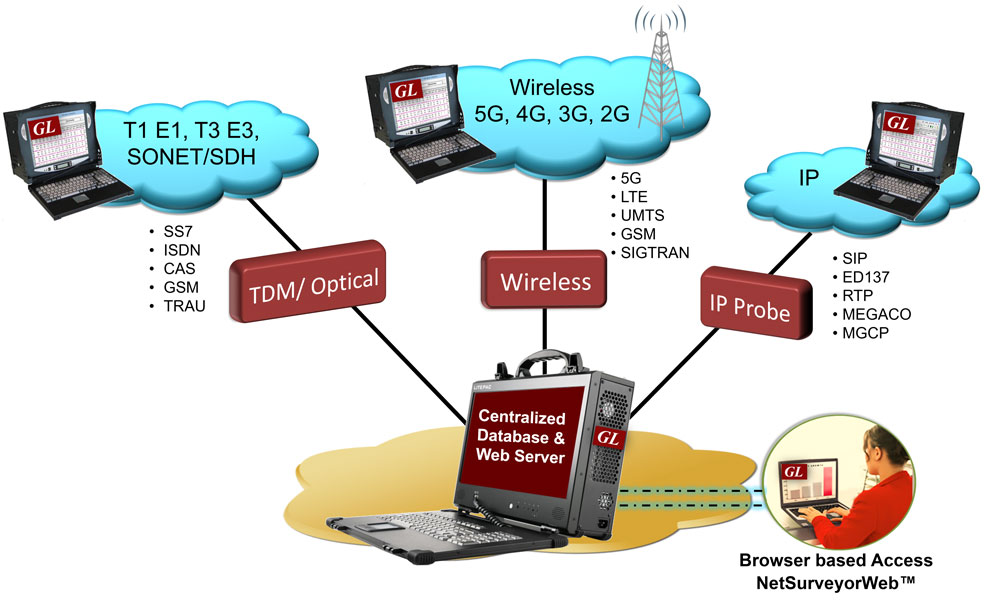
Overview
Engineers and cybersecurity professionals need to monitor voice and data traffic across a wide variety of networks—including wireless, IP, and TDM. GL addresses this need with NetSurveyorWeb™, a centralized, web-based surveillance platform that captures and analyzes traffic from multiple geographic locations. NetSurveyorWeb™ integrates seamlessly with GL’s PacketScan™ HD, which can be deployed in the field to capture high-speed traffic and forward it to the central NetSurveyorWeb™ system. The solution features a browser-based dashboard for real-time visibility and a robust back-end database for long-term data storage and retrieval.
Network monitoring applications include:
- Performance Monitoring
- Network Security
- Fraud Prevention
- Physical Layer monitoring
- Billing Verification
- Remote Protocol Analysis
- Failure Prediction
- Traffic Engineering
- Call Quality Monitoring
- Troubleshooting
NetSurveyorWeb™ supports service providers to perform all of the above functions. NetSurveyorWeb™ conducts real-time analysis, storage, retrieval, querying and display of Call Detail Records (CDR) by non-intrusively connecting to Analog, TDM, Optical, Wireless or IP networks. Supported protocols include LTE, IMS, UMTS IuCS, UMTS IuPS, VoIP (SIP, SIGTRAN, H.323, MAP, CAP, MGCP, MEGACO, ED-137), SS7, ISDN, CAS, TRAU, GSM, and Analog Systems.
NetSurveyorWeb™ relies on protocol analysis probes placed at different physical sites. These probes capture, decode and organize traffic into calls and send CDR, signaling frame details, and other statistics to NetSurveyorWeb™. The probes capture data locally on high-speed networks and come equipped with protocol analysis software for convenient field analysis. The probes can be customized to capture on legacy interfaces (T1, E1, Analog) or Ethernet and SONET / SDH networks.
The central system comprises of a database engine, web server, and NetSurveyorWeb™, a web-based application, to facilitate data storage and retrieval through web browser clients.
GL provides network monitoring across various networks and protocols including:
- IP Network Monitoring and Surveillance System - SIP, RTP, H.323, ED-137, SIGTRAN, MAP, CAP, INAP, MGCP, MEGACO
- Wireless Network Monitoring and Surveillance System – LTE / VoLTE, Diameter, IMS, UMTS, and GSM
- TDM/Analog and Optical Network Monitoring and Surveillance System - SS7, ISDN, CAS, GSM, TRAU, and Analog System
- Digital T1 E1 Line Monitoring, Testing, and Diagnostic System
For more solutions, refer to Network Test, Monitoring, and Surveillance Solutions for TDM, VoIP, & Wireless Networks webpage.
Key Features of NetSurveyorWeb™
- Identify and analyze CDR using Key Performance Indicators
- Listen to voice calls; play individual left, right and stereo audio sessions
- Set alarm conditions and generate alerts of different types like email alert, visual alert, audible alert, or even log into tables for future analysis
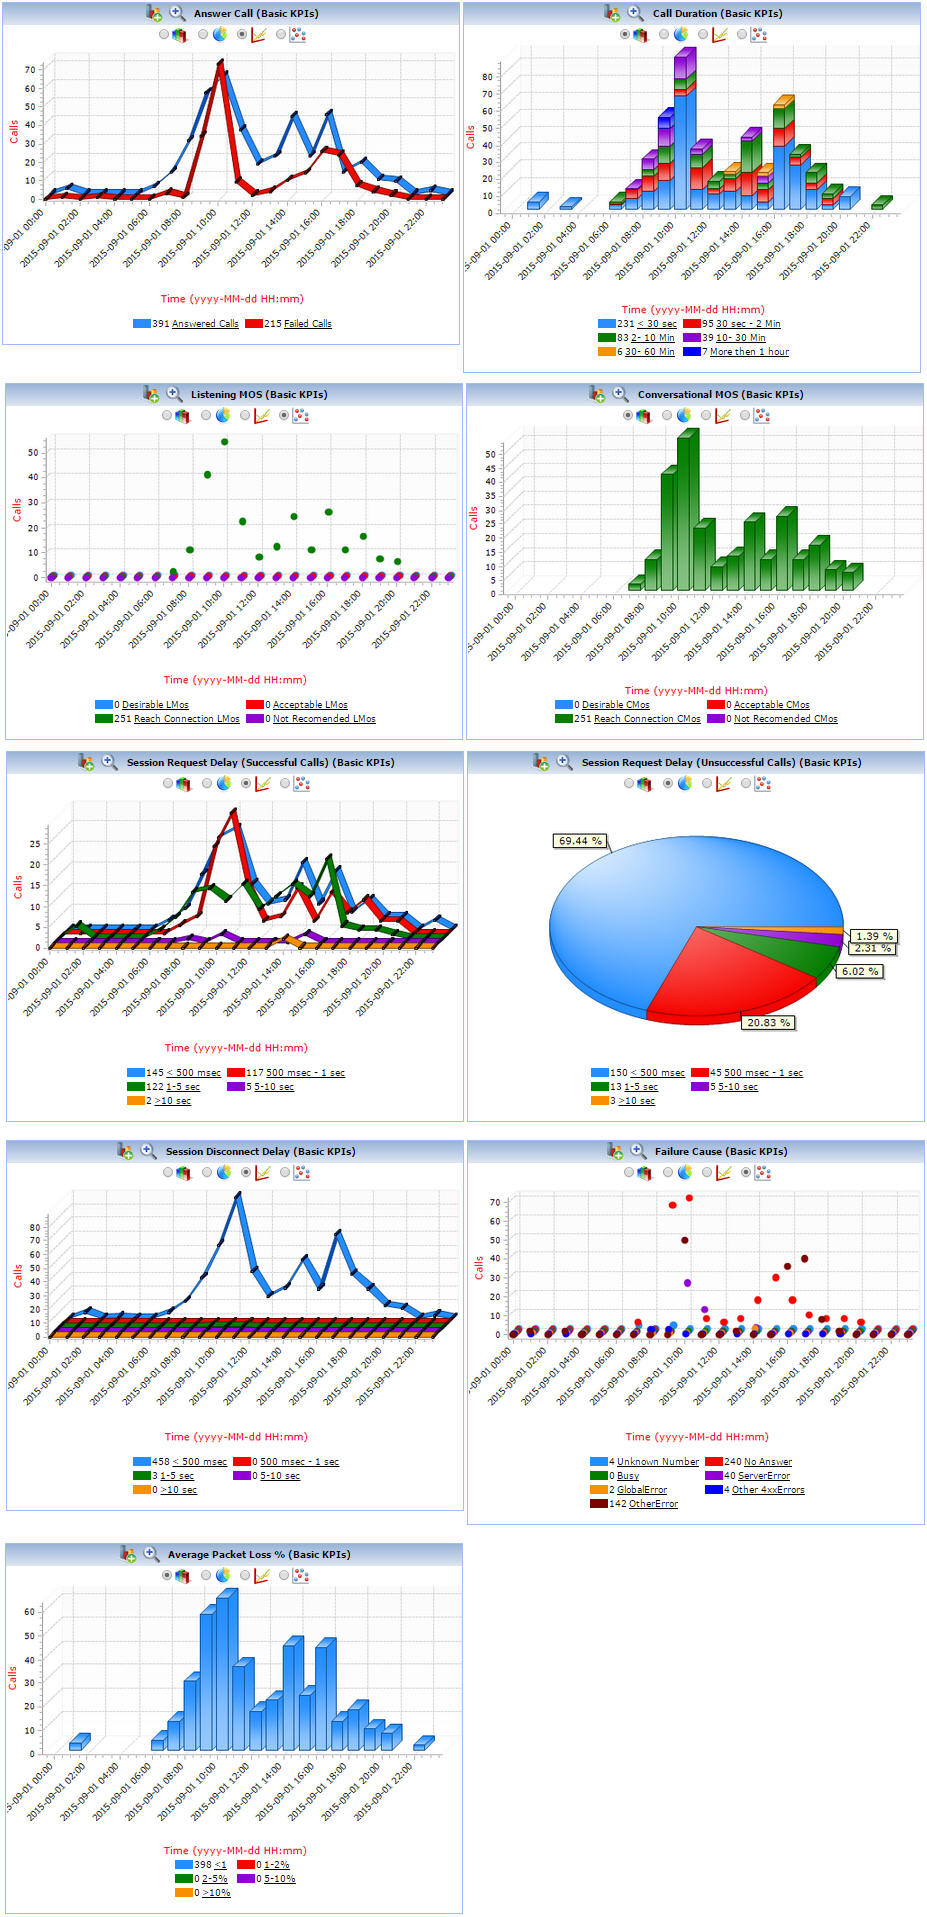
- Reports are displayed both in tabular and graphical formats; customize reports and graphs based on SQL queries
- Graphs provided for Call Completion Ratio, Answer Call, Answer-Seizure Ratio (ASR), Listening MOS, Conversational MOS, Failure Cause, and Call Duration
- Display real-time data - signaling, traffic and Quality of Service (QoS) performance metrics
- Apply single or complex filters for data analysis; use logical operators between filters
- Decodes standards such as ANSI, ITU, ETSI, 3GPP, for all supported protocols
- Provides Voice Quality metrics (voice band summary, call graph, voice band events) and Delay measurement (average delay for In and Out direction) along with voice and delay KPIs
- Provides CDR and Key Performance Indicators (KPI) for Analog test systems – C-Notched Noise (CNN) Test, Signal-to-Noise Ratio and Level, Voice Quality Test (VQT POLQA) and Three Tone Slope (Gain Slope)
- Export graphical and tabular reports as PDFs
- Export call detail records displayed based on time filter or record index as PDF and CSV files
Typical Applications
- Comprehensive analysis from overall network health to detailed protocol monitoring
- Call Detail Records, fraud detection and location, remote protocol analysis and troubleshooting, real-time signaling monitor, traffic optimization engineering, and statistics
- Determine actual call signaling routes to verify network functionality under all situations including congestion and loss of SS7 nodes
- Revenue and billing verification, alarm monitoring, intrusive testing
- Quality of service measurements, call trace and recording
NetSurveyorWeb™
PC Requirements |
|
Cables and Accessories |
RJ-45 cables |
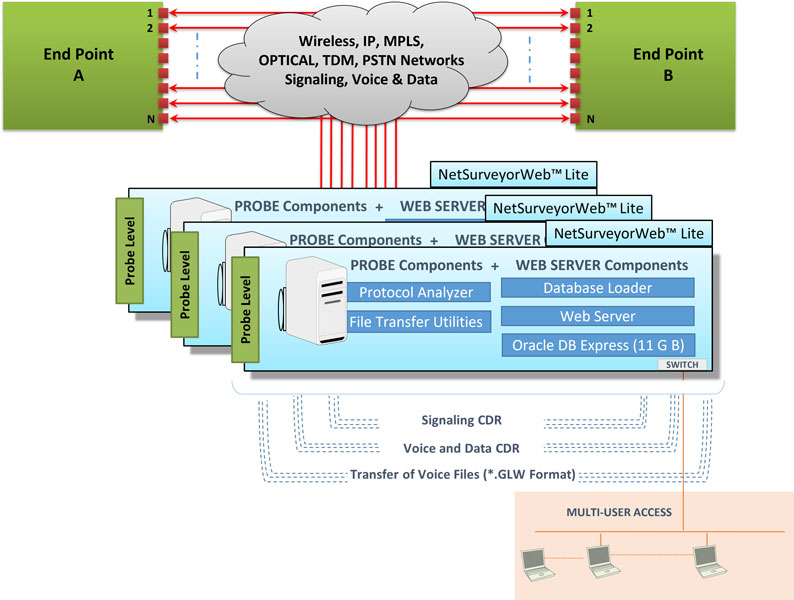
NetSurveyorWeb™ Lite
PC Requirements |
|
License Requirements |
Requires PKV169 + Probe Level Analyzers |
Cables and Accessories |
RJ-45 cables |
System Architecture
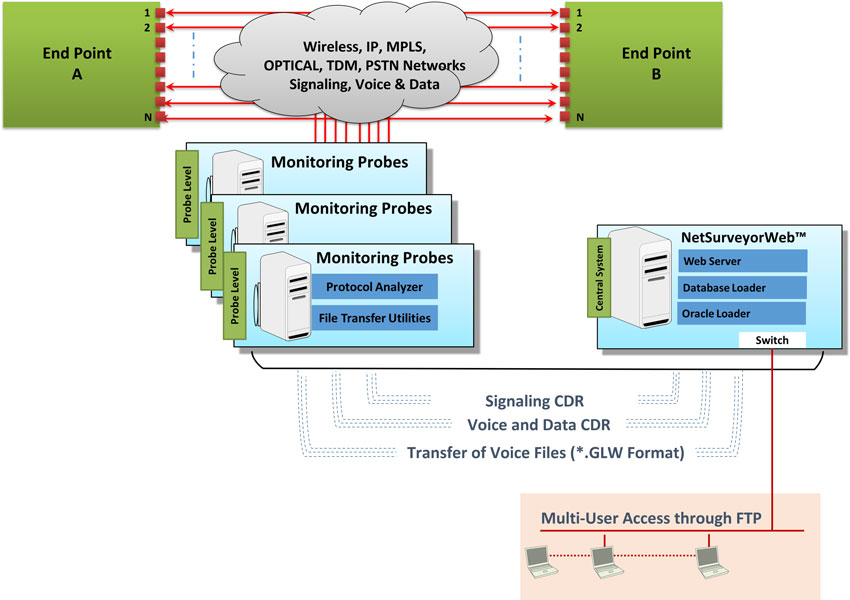
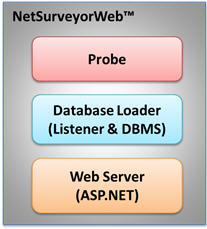
GL's NetSurveyor™ system has a three tier architecture. The first layer consists of GL's Protocol Analyzer Probes which are capable of tapping into live call traffic and non-intrusively capture signaling message summary and build CDRs. The second layer is the Database Store Layer where the captured data is stored. The last layer is the Data Access Layer where the data presentation logic is contained. Each of these components are briefly explained below.
- Probe computers collecting layer 1 (physical layer), layer 2 (data link layer) and layer 3 (network layer) information. Probes can be T1 E1/T3 E3/ OC-3 STM-1/ OC-12 STM-4/IP
- Probe computers run protocol analysis applications along with the necessary hardware and software
- These probes could be controlled locally using the protocol analyzer application or remotely using GL's Client-Server application
- The analyzer hardware for TDM and optical networks can be connected non-intrusively in Monitor or Bridge Modes, or alternatively the data can be looped through the cards
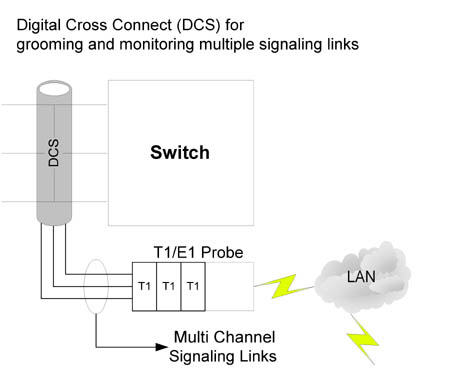
- Multiple Link Sets per T1 E1 (through Digital Cross Connect Grooming) - multiple 64 kbps signaling channels per T1 E1 can be monitored simultaneously by grooming through a digital cross-connect - see diagram below
- Probes non-intrusively monitor physical lines of the network and forwards call detail records (CDRs), protocol summary, frame data in hex dump, and statistics to a central database
- Probes connect via TCP/IP to ODBC compliant real-time database loader
- Only precise and filtered data (user selectable) is collected into the centralized database
Probe Types –
- The PacketScan™ is a feature-robust Windows® based software tool that captures and monitors live IP traffic. In the VoIP world, it can monitor and measure SIP, H323, Megaco, MGCP, T.38 and video calls. In the Wireless network, it can monitor 2G, 3G, and 4G protocols such as GSM, UMTS, GPRS, LTE, SIGTRAN signaling over IP. A number of GL’s PacketScan™ probes are deployed in remote locations across the network to passively monitor VoIP traffic.
- PC based T1 E1 / T3 E3 / Optical probes collect physical and line level status and performance information. The Intrusive and Non-intrusive "probes" for TDM networks are deployed at strategic locations in a network. They can transmit and collect voice, data, protocol, statistics, and performance information. These probes can relay information to a central / distributed Network Management System (NMS).
- Database Loader (Data Layer) – A listener application is co-hosted with the database server (SQL DBMS such as Oracle) running on the Data Layer. Interface between the probes and the database is handled by "Listener". The Listener will listen to the streaming data from connected probes, receives data, and feeds the data to DB server. Multiple probes can be connected via TCP to the Database Loader.
- Provides load statistics and probe layer 2 status
- Central control over probes to suspend or resume loading data to DB from connected probes
- DB stores the data collected by the probes. Records are stored into a relational database (Oracle) using ODBC connection
- Listener is modifiable and supportable with MySQL
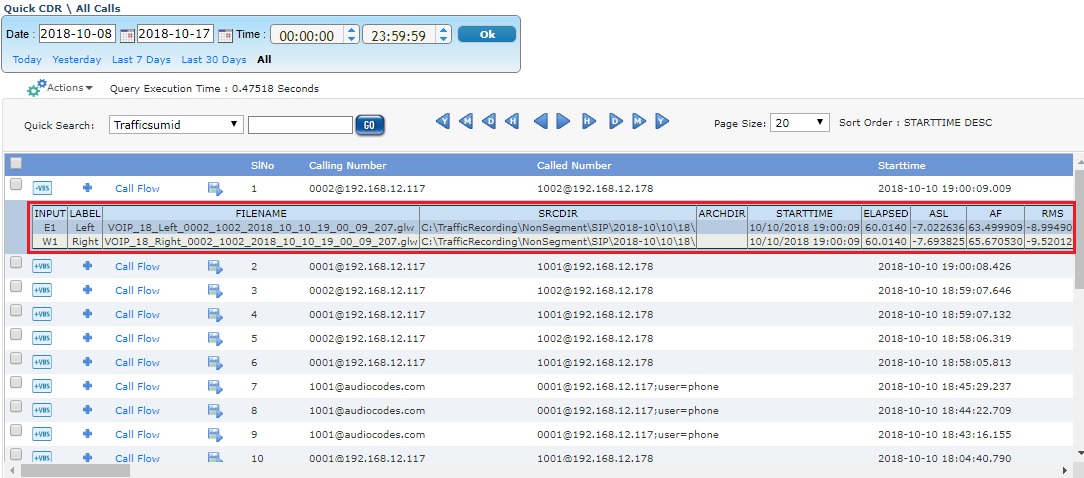
- NetSurveyorWeb™ Webserver (Data Access Layer) serves for data mining operations. The database could be accessed in real-time over the web using applications such as GL’s NetSurveyorWeb™, or queried by customer applications such as a billing system or accessed by a reporting tool such as Crystal Reports, for aggregation and analysis of historic data. The NetSurveyorWeb™ is a user-friendly web-based client which accesses the results provided by the centralized DB through a web server. As depicted in the screenshot below, users can log into the central system locally or remotely to view the collected real-time and historic data including call parameters, layer 1 status display, as well as layer 2 and 3 analysis. Also available is the ability to filter the call records using a variety of filtering mechanisms including time/date, signaling and traffic parameters
Main Features
Web Based UI |
|
|
Call Detail Records |
|
|
Filter & Search Calls of Interest |
|
|
Key Performance Indicators (KPI’s) |
|
|
| Physical Layer Monitoring |
|
|
Alerts and Indicators |
|
|
Voice Quality Analysis (VBA)
NetSurveyorWeb™ application works with Voice Band Analyzer (VBA) application to analyze monitoring voice band traffic over variety of networks including VoIP, TDM, 2-Wire and Wireless and provide useful metrics that are of interest to service providers.
The VBA built-in algorithms include ITU-T P.56 Active Voice Level analysis, Line Echo (Hybrid) analysis, and licensed modules include 2-Wire Echo Analysis, Traffic Classifier and Fax analysis. Other analysis modules such as ITU-T P.561, P.562, and P.563 can also be hosted as plug-ins.
The VBA application operates on previously captured files, making it a near-real time (as opposed to a strictly real-time) tool. It supports A-Law, μ-Law, 16-bit PCM (Intel), 16-bit PCM (Motorola), MS Wave, G.726 (40 Kbps, 32 Kbps, 24 Kbps, and 16 Kbps), and G.722 (64 Kbps) file formats.
- Speech Metrics measured in accordance with ITU-T P.56 Method B
- Active Speech Level (ASL in dBm)
- noise level (NL in dBm)
- speech activity factor (AF in %)
- power measurements (RMS, dRMS in dBm, DC Level in %FS)
- clipped samples
- DC level
- detail voice band events occurrence during the call including reporting of traffic as tones (ring, busy), digits (DTMF, MF, MFC-R2), fax tones, modem signals, and more
- Hybrid Echo analysis module for Line Echo measurement. It outputs
- Echo Return Loss - ERL (dB)
- Echo Delay (ms)
- Echo Dispersion (ms)
- Traffic Classifier to detect, classify, and display the amount of traffic - whether its Fax, Voice, Digits , Tones, or Silence present in the network
- FaxScan™ used to analyze voice band traffic files for Fax traffic on 2-wire or 4-wire captures. It outputs fax signaling frames in a log file and Fax image in TIF format
- Tone Decoder can detect and decode the following different types of phone tones -
- DTMF, MF
- Caller ID, Caller ID - Call Waiting
- Paging Tones
- Teletype (TTY)
- Frequency-Shift Keying (FSK)
- Specific Area Message encoding (SAME)
- Visual Message Waiting Indication (VMWI)
- Special Information Tone (SIT)
- Silence, ring-back, busy tones or any Custom Tones from the PCM wave file / wave streams
Voice Band Summary
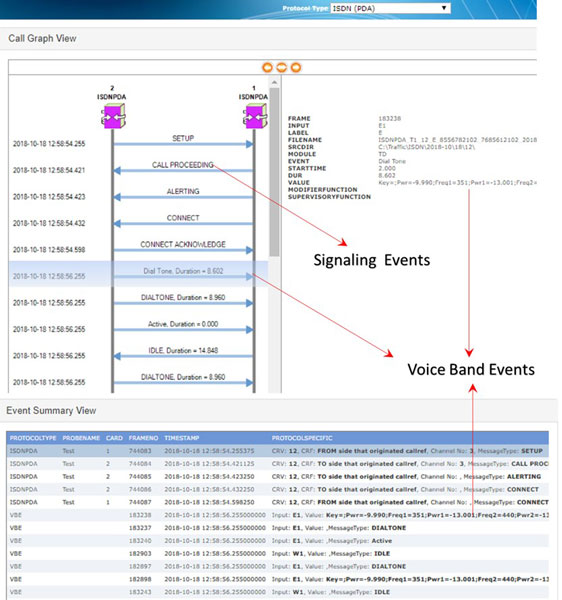
VBA Call Graph and Voice Band Events
The Speech Level module with VBA analyzes the captured voice files and produces the following statistics according to ITU Standard P.56. These measurements help detect call anomalies and detect impairments in voice channels in near real-time and thereby quickly remove or rectify the impairing channel from the live network.
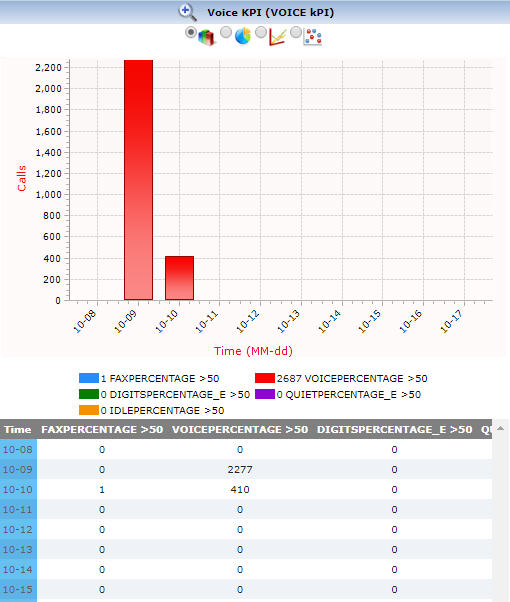
The Traffic Classifier module with VBA analyzes the captured files and categorizes the call as voice, fax, and modem data. It outputs the amount of Fax, Voice, Digits, Tones, Silent and Idle traffic present in the network and provides statistics. Traffic Classifier allows Idle Code settings for signaling bits and options to detect DTMF, MF, MFR2-fwd, MFR2-bkwd digits, and Tones (Dial/Ring/Busy).
The Fax Traffic module with VBA process WinPCAP, 2-Wire and 4-Wire voice band capture files to analyze the T.38 packets, T.30 frames. It provides detail decode of a Fax call with TIFF image, and call-flow indicators for complete analysis of fax call. The 2-wire captures are indicated by a single input file, which is presumed to contain the traffic in both directions, as might be captured from a subscriber line. The 4-wire traffic is captured with two input file one containing “east bound” traffic and the other containing “westbound” traffic.
The 2-Wire Line Echo Analysis module with VBA can measure hybrid line echo generated using the captured files at both end points, and generate Echo Return Loss (ERL), Echo Delay, and Echo Dispersion measurement values.
The Tone Decoder module within VBA features a highly efficient FFT module, which can convert a raw captured file to spectrum data. With this module, the VBA can monitor the signal arriving at the receive end, detects, and decodes the tone type as DTMF, MF, Frequency-Shift Keying (FSK), Teletype (TTY), Special Information Tone (SIT), Specific Area Message Encoding (SAME), Voice Mail Waiting Indication (VMWI), Paging Tones, or any Custom Tones from the captured PCM wave file or wave stream. The module also detects and decodes the Type 1 Caller ID, Type 2 Caller ID - Call Waiting (CID-CW), silence, ring-back, busy or other phone tones.
Delay Measurement
NetSurveyorWeb™ also works with Delay Measurement tools to analyze captured voice traffic and provide precise one-way delay metrics. For a given call which traverse through Gateway, traffic is sampled at both TDM and IP analyzer at the same point of time running in the same server. These captured segments of SIP and ISDN calls will be saved in *.pcm formats. These samples will be given to delay measurement module which compares the samples based on the timestamp and provides the delay metrics.
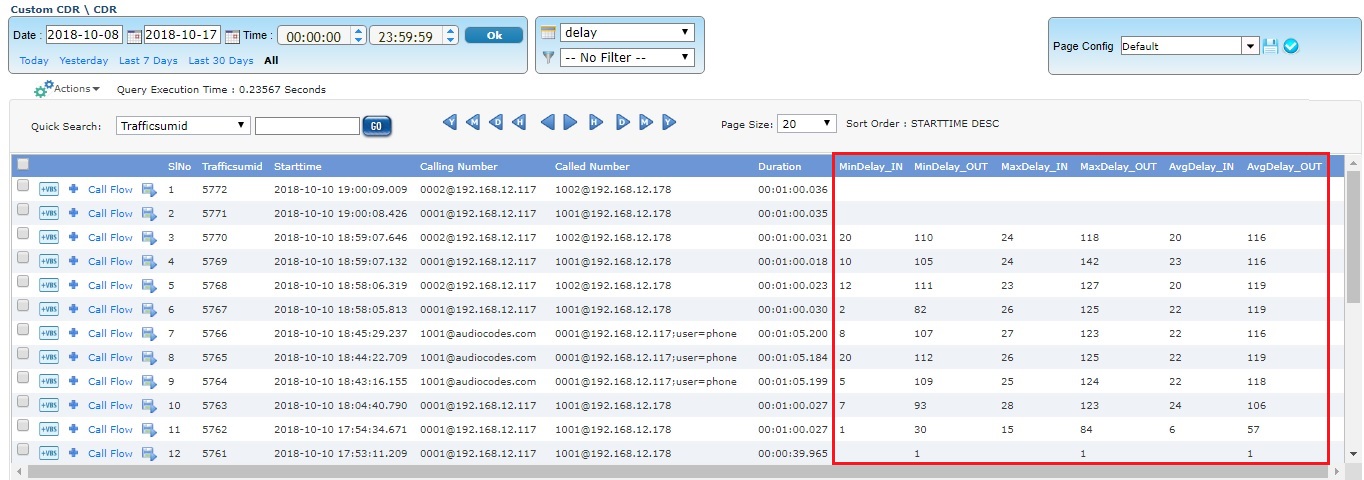
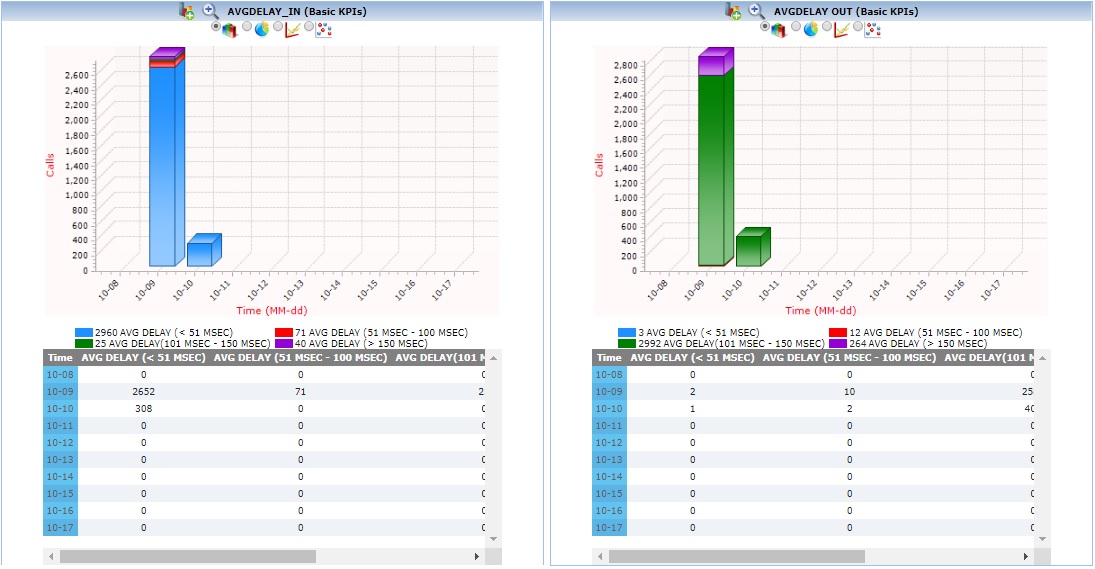
Delay KPI
Average Delay In and Out
The below KPI shows average delay for In and Out direction. It is categorized as <51 sec, between 51-100 Msec, between 101-150 Msec, and greater than 150 Msec.
KPI and Reports
| Protocol Type | Supported KPI | Screenshots |
|---|---|---|
VoIP SIP (SIP and H.323) |
|
SIP KPIs |
| ED-137 |
|
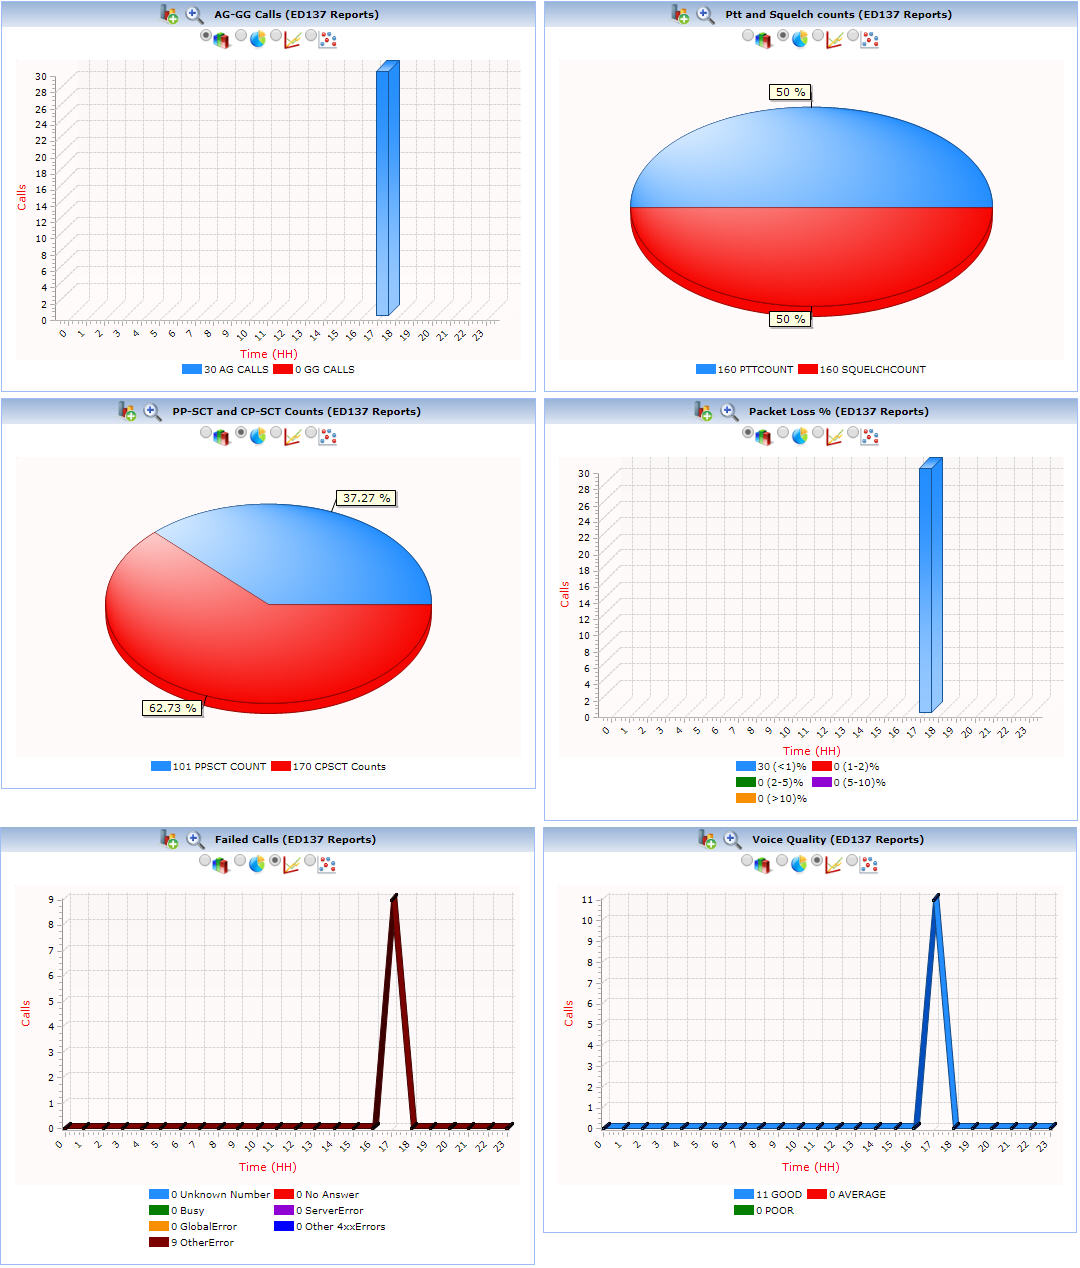 ED-137 KPIs |
| APS (Voiceband) |
|
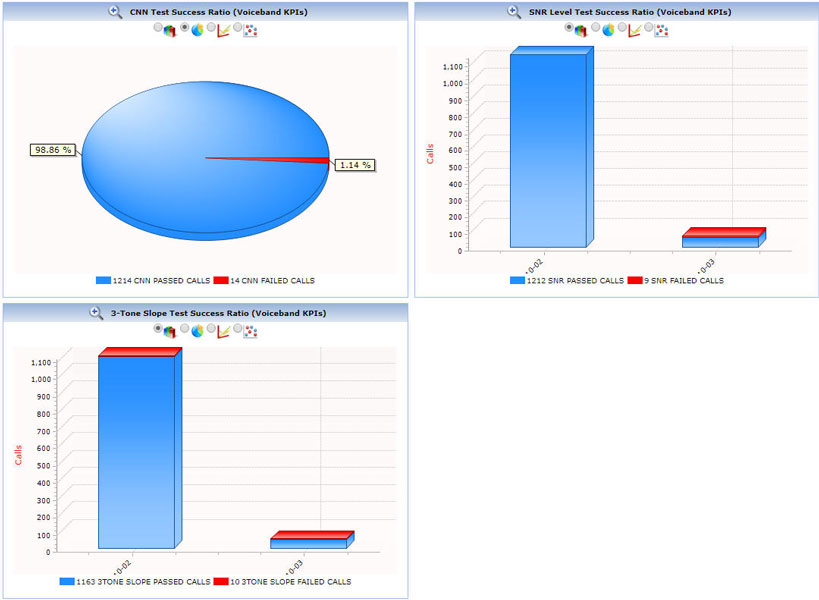
|
SS7 |
|
 SS7 KPIs |
T1 E1 Layer 1 |
|
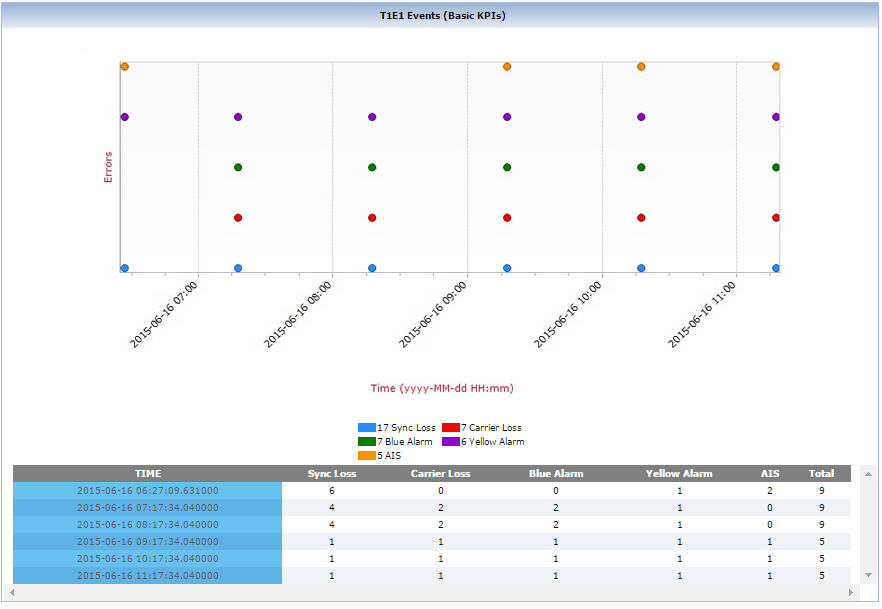
T1 E1 KPIs |
ISDN |
|
 |
|
LTE KPIs |
|
GSM |
|
|
GSM A |
|
|
TRAU |
|
|
IuCS |
|
|
IuPS |
|
|
VoIP SIGTRAN |
|
|
Functions
Voice Quality Analysis
NetSurveyorWeb™ works with GL’s Voice Band Analyzer (VBA) to analyze voice band traffic over VoIP, TDM, 2-Wire and Wireless networks.
The Speech Level module within VBA analyzes voice files and produces statistics according to ITU-T P.56. These measurements help detect call anomalies and impairments in voice channels in real-time.
Voice Band Summary
VBA Call Graph and Voice Band Events
VBA Traffic Classifier KPI
Delay Measurements
NetSurveyorWeb™ works with GL’s delay measurement tools to analyze voice traffic and provide precise one-way delay values. Traffic can be sampled across gateway devices at both Legacy and Ethernet interfaces to provide gateway conversion times. Legacy interfaces include Analog (2-wire and 4-wire) and TDM (T1, E1).
Delay KPI
Average Delay In and Out
The below KPI shows average delay for In and Out direction. It is categorized as < 51 sec, between 51-100 Msec, between 101-150 Msec, and greater than 150 Msec.
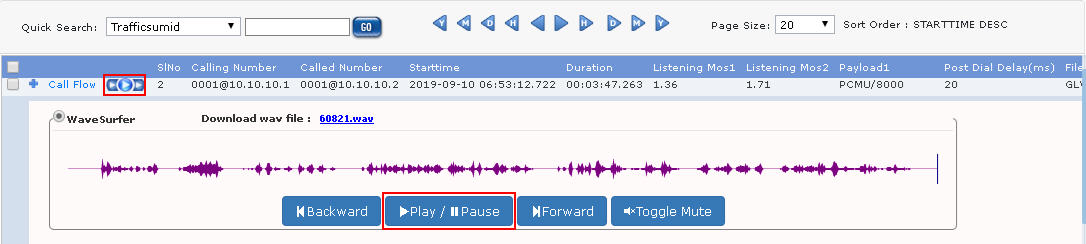
Play Voice File
Audio play option facilitates to play individual left/right and stereo audio sessions as per the configured play voice config details, for various codec types like EVRCC, G722, SPEEX_WB, OPUS, AMR_WB, EVS_WB and many more.
Call Data Records (CDR) View
The real-time data view provides visibility into each individual call. Each call can be investigated based on call control, signaling and traffic parameters. Flexible filtering can help organize and identify “Calls of Interest”. The CDR view includes the following.
Frame Summary
Frame summary view provides summary of signaling data along with the decodes in the form of Hexdump.
Traffic Summary
This option is currently available only for IP calls. Each call can be expanded to reveal per stream RTP statistics. The RTP/audio parameters such as SSRC number, payload type, total packet count, missing / duplicate / reordered / discarded packet count or %, conversational/R-Factor , listening MOS/R-Factor, cumulative packet loss, Max/Min/Average values of Gap, Min/Max/Average values of jitter, Min/Max/Average values of RTD, and average inter arrival jitter are displayed.
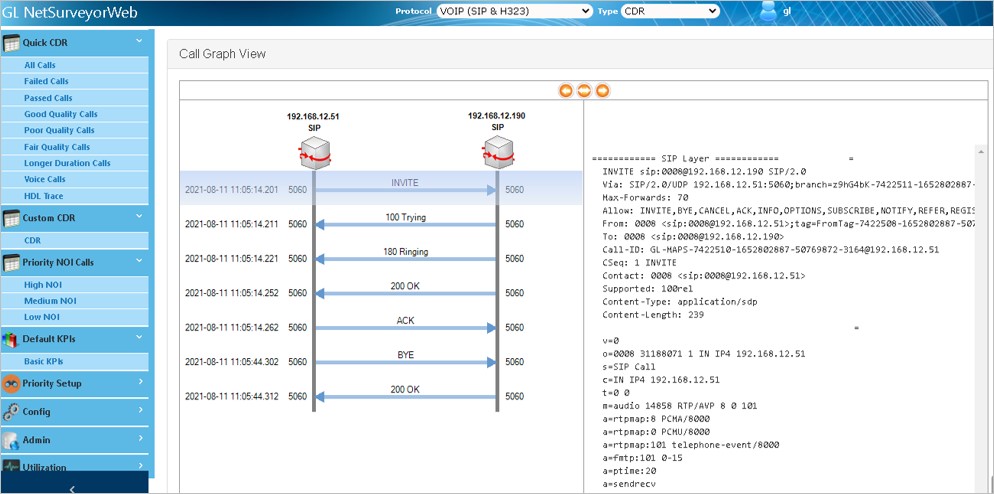
Graph View for each call
This call flow graph allows easy verification of the messages exchanged and the status of the call.
Users can also select any messages and observe the corresponding decode message details in the decode view.
Merge View
This feature display Call Data View, Ladder diagram, and Decode message detail of the selected message in a single view.
Also, CDR view provides flexible options to hide the Detail View, Graph View, or Decode View as required in order to view the information properly.
Navigation and Search Tools
Navigate through records easily using Previous and Next Hour, Day, Month, and Year options as required. A particular call of interest can be searched using the Quick Search option.
Whitelist
User can configure the list of interested calling/called number to mark them as Whitelist and perform the action such as saving the trace file on the probe. This information is sent to the database and can view the Whitelisted calls separately in the NetSurveyorWeb™ and also download the trace file in *.hdl format.
Export PDF
Provides an ability to export current call data records view in PDF as well as CSV file formats. In addition, call data records along with the associated call-flows can also be exported in PDF formats.
Filter CDR
The call records can be filtered using Date/Time Filter criteria or by defining custom filter profiles. The Date/Time filter displays the call records based on Minutes, Hours, Days, and user-defined date range. The Display All option displays all the available call records. The Custom Filters provide options to filter call records based on various call control, signaling and traffic parameters.
Custom filter profiles can be saved and loaded with the click of a button. Single or Multiple Custom filters can be applied to perform deep inspection. Edit & update already existing custom filter profiles. Also provides logical operations to apply between parameters within a filter or multiple filters.
Call Flow
The call flow provides visibility into each individual call. The call flow is depicted through graphical and tabular view which allows verification of the status and the messages exchanged in a call between the Called and the Calling numbers.
SIP Call Flow
Selected Call Trace Download
The user can download the selected call trace in the *.hdl format.
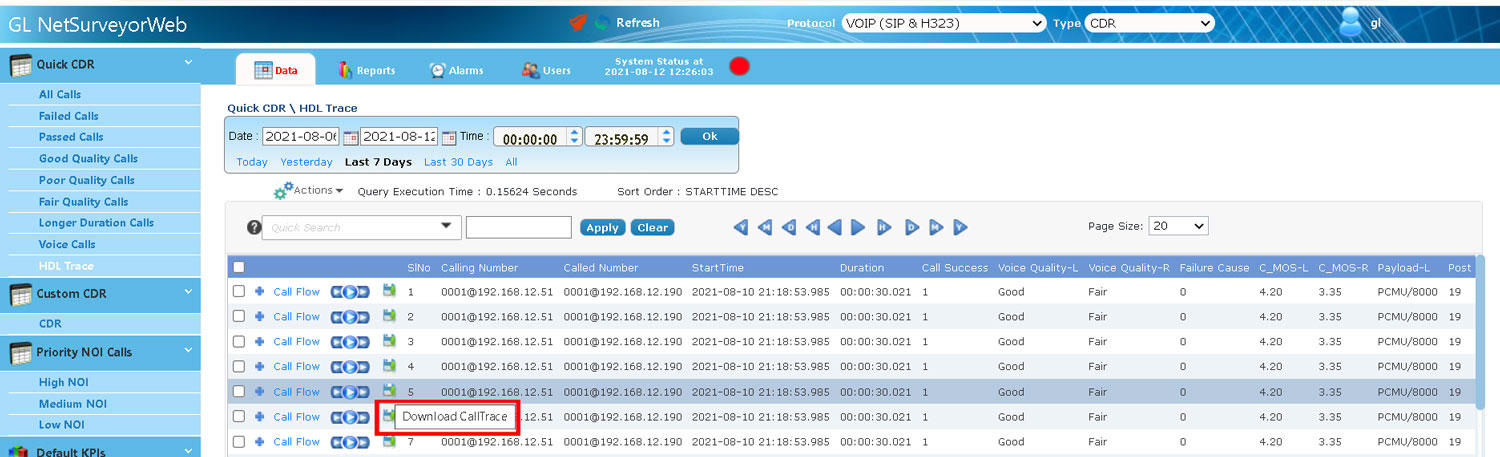
Download the Selected Call Trace
Alarm Settings
Users can trigger alarms whenever calls of interest occur, a network link failure is detected, or at scheduled intervals. NetSurveyorWeb™ can send email alerts, generate visual alerts in the user interface, make audible alerts, SMS alerts, export or log data. Alarm severity types can be set as Minor, Major, or Critical.
Flexible options are provided to save alarm filters as profiles, add, edit or delete the existing alarms, selection of user KPIs, and selection of Custom filters. Schedule alarms and alerts for hourly, daily, monthly, or yearly.
Email / SMS Alerts: Sends Email alerts for alarms. When the alarm condition set by the user is true then the data will be sent as an Email attachment in the PDF format for the given Email address. In case of SMS, a simple text message will be sent to the registered mobile.
Audible Alerts action will beep once for the particular time.
 |
|
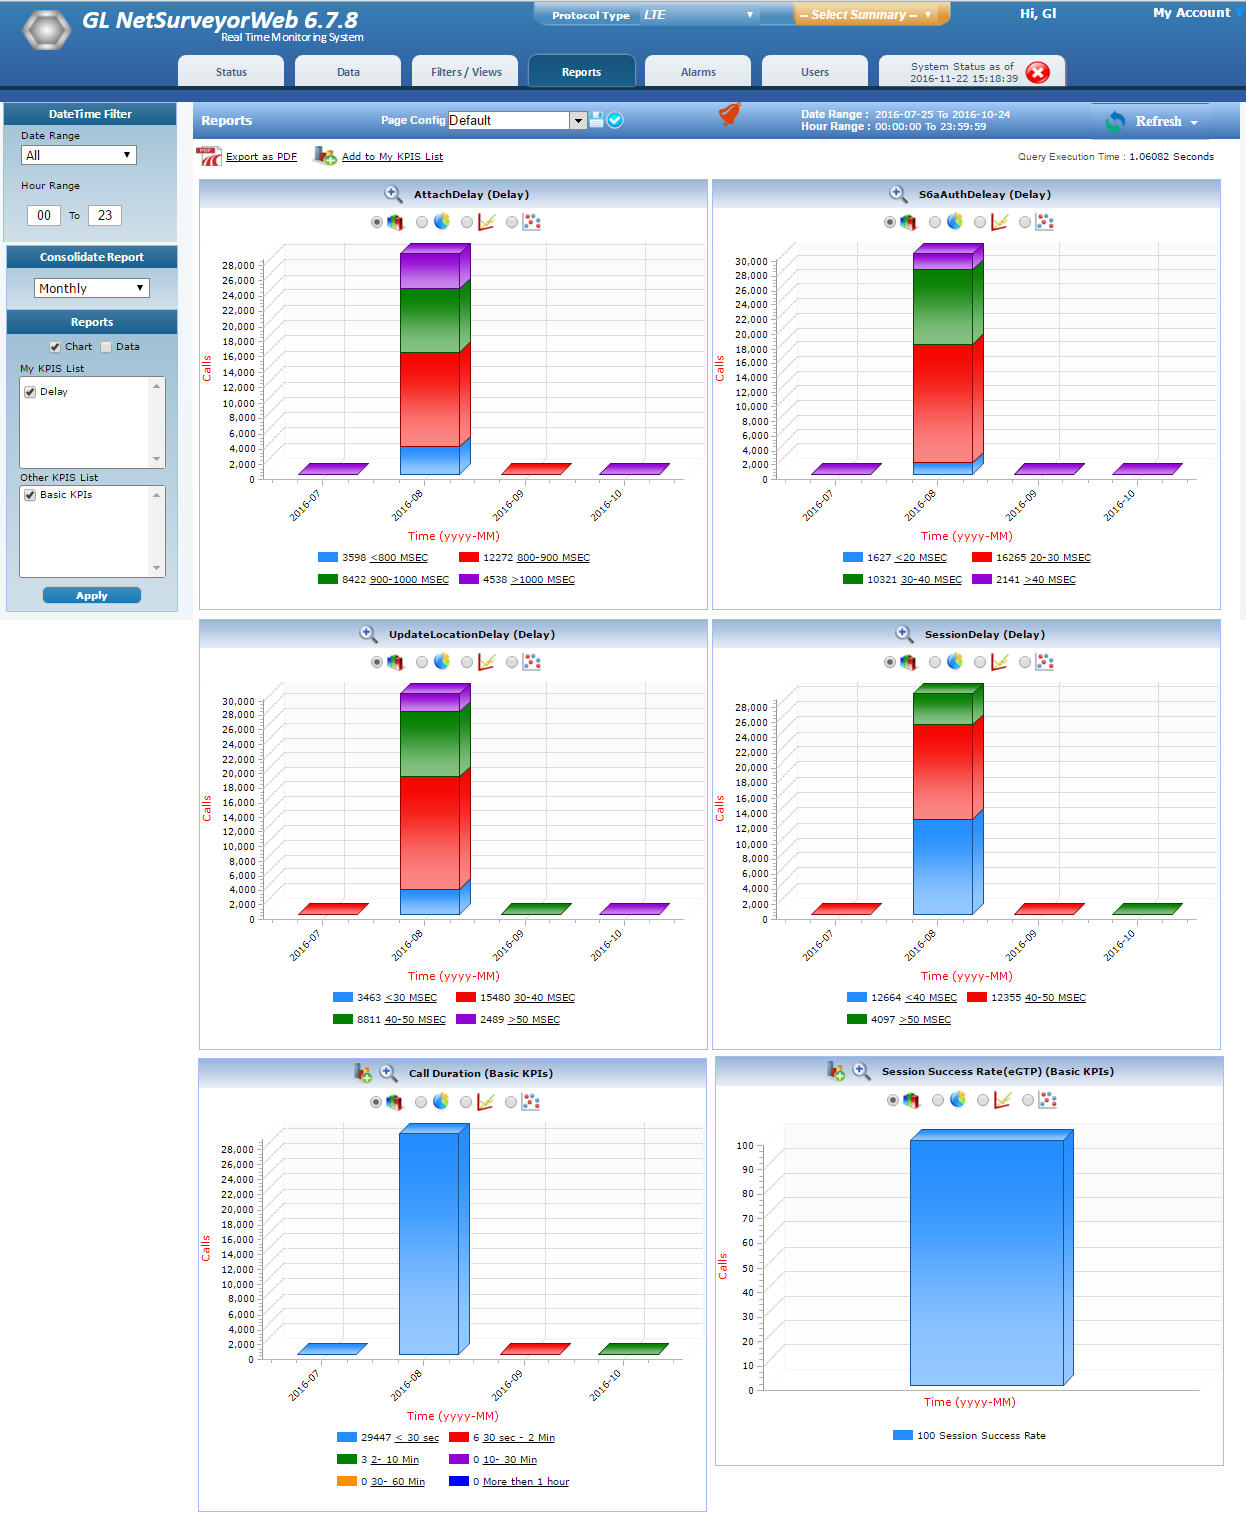
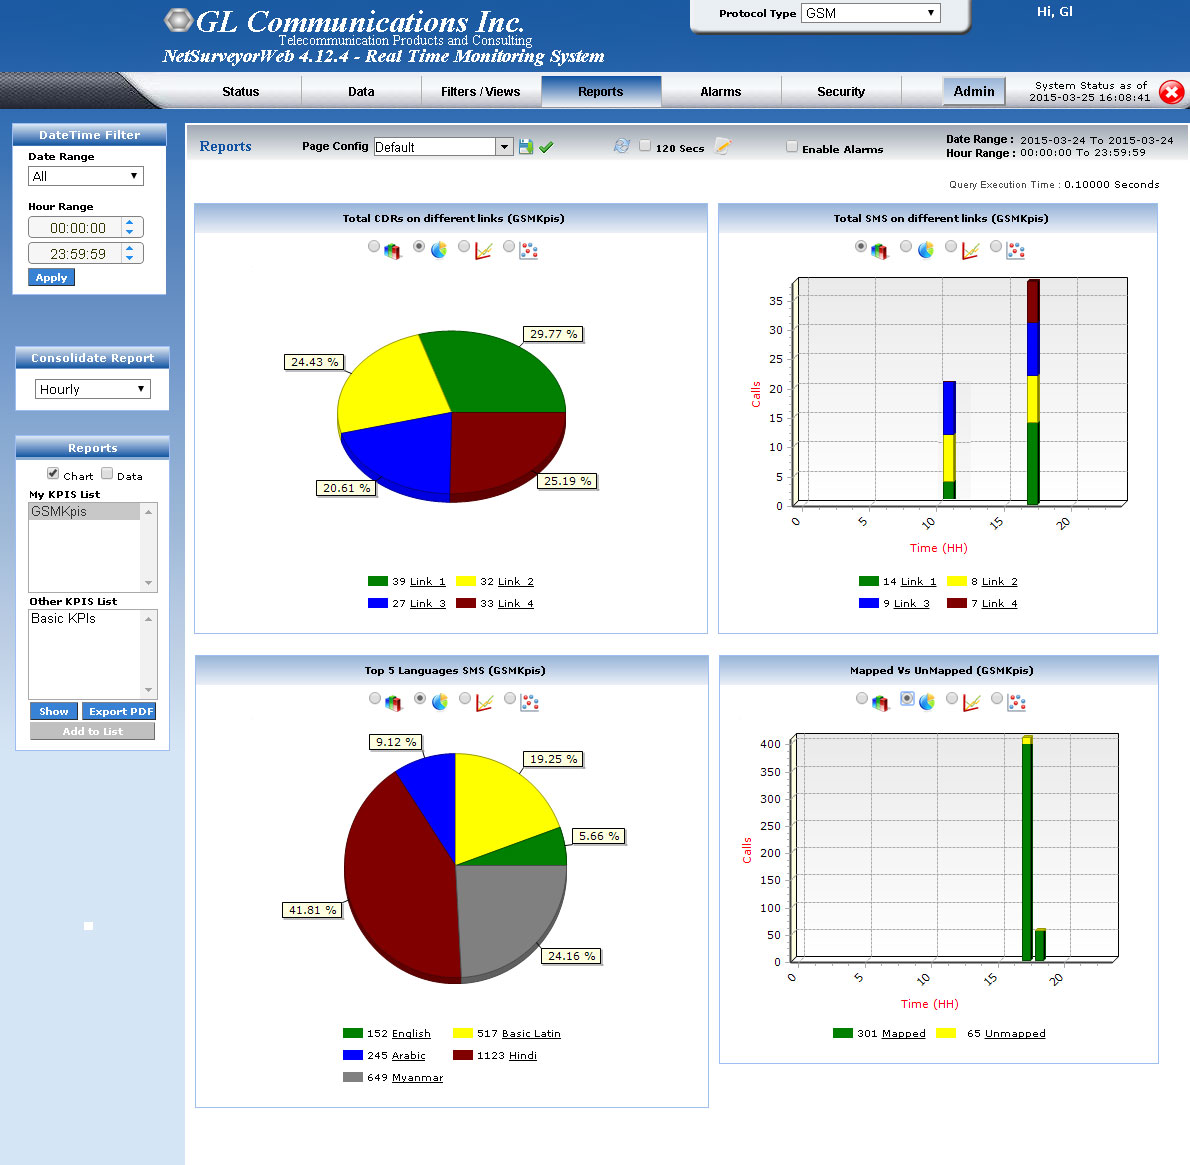
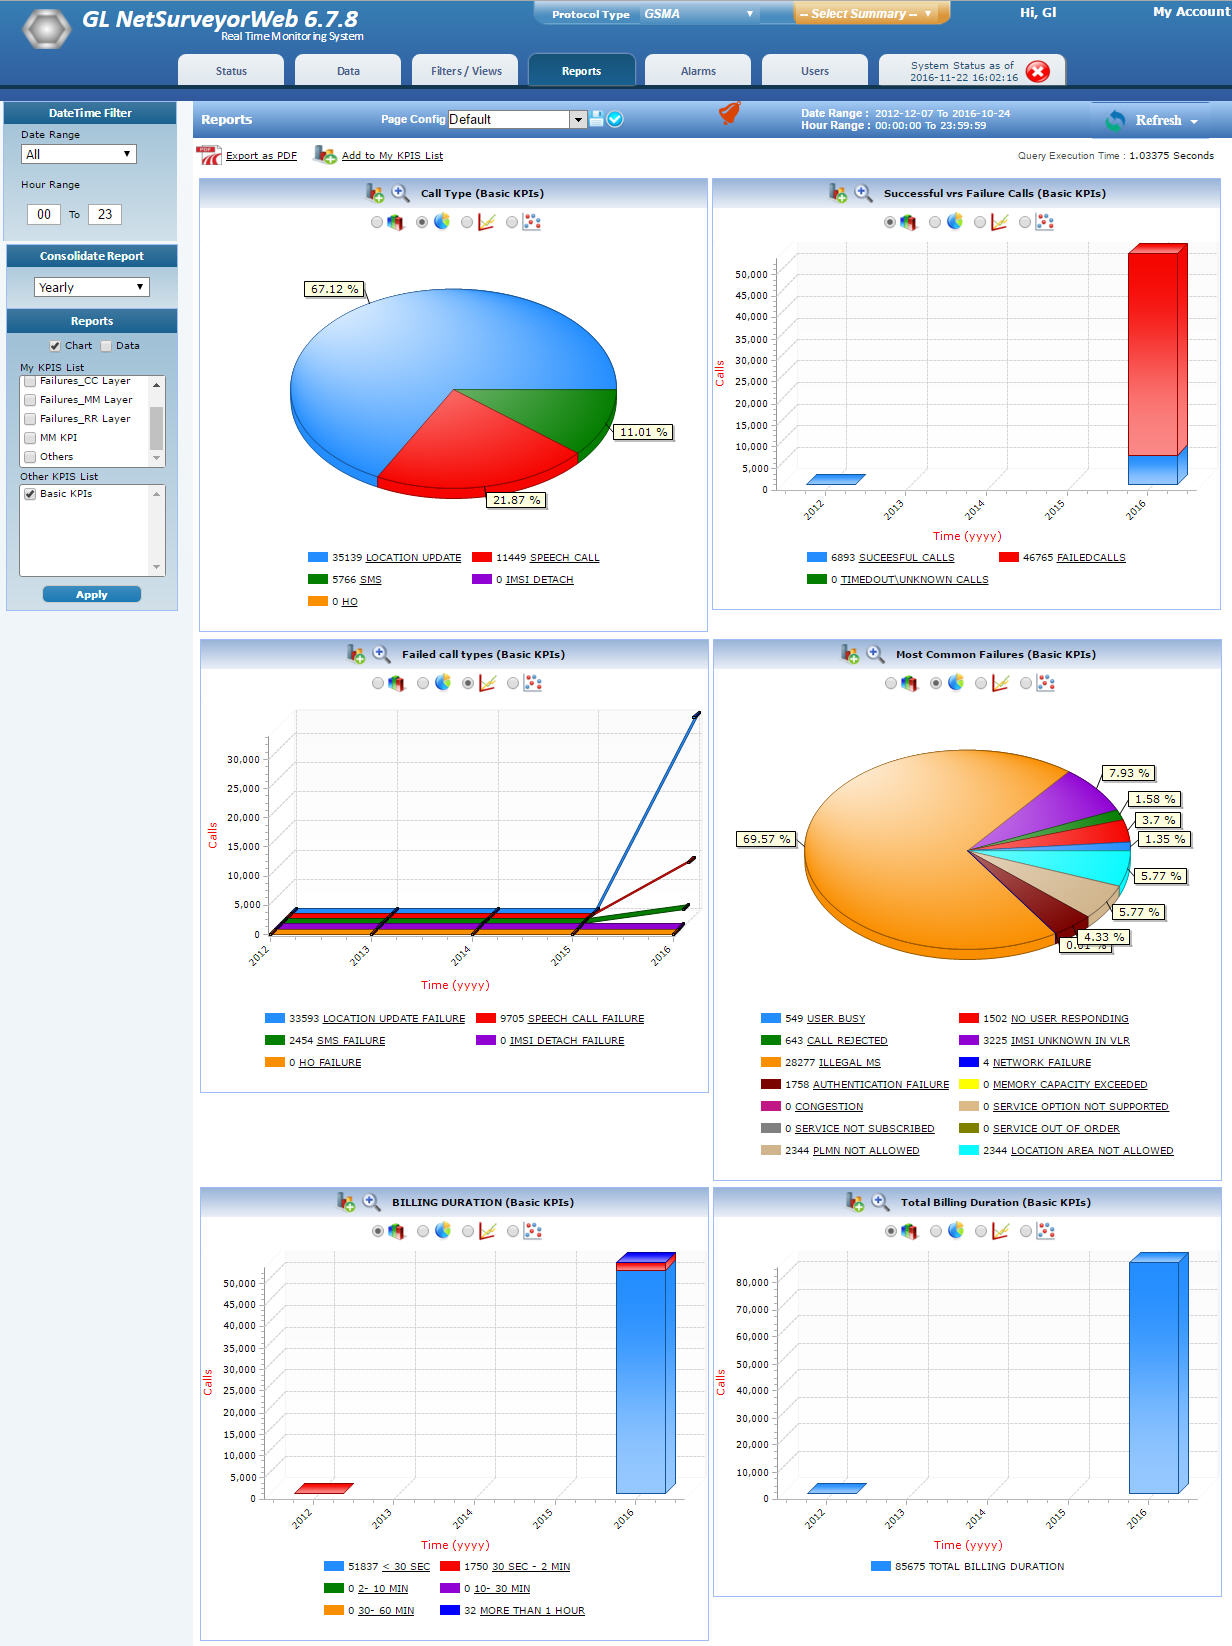
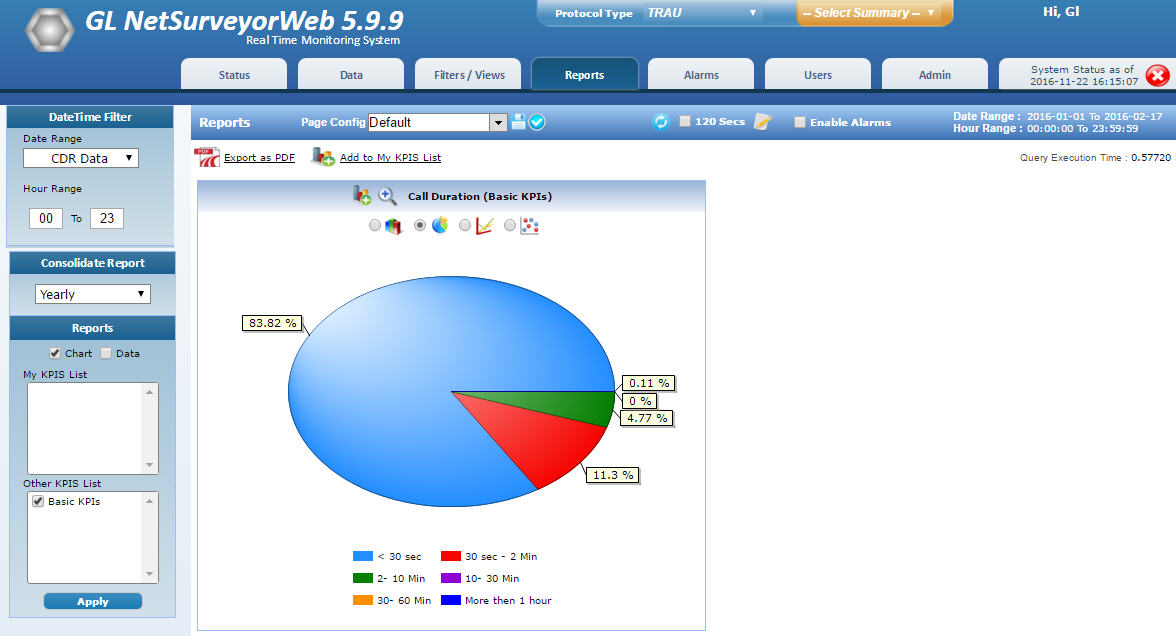
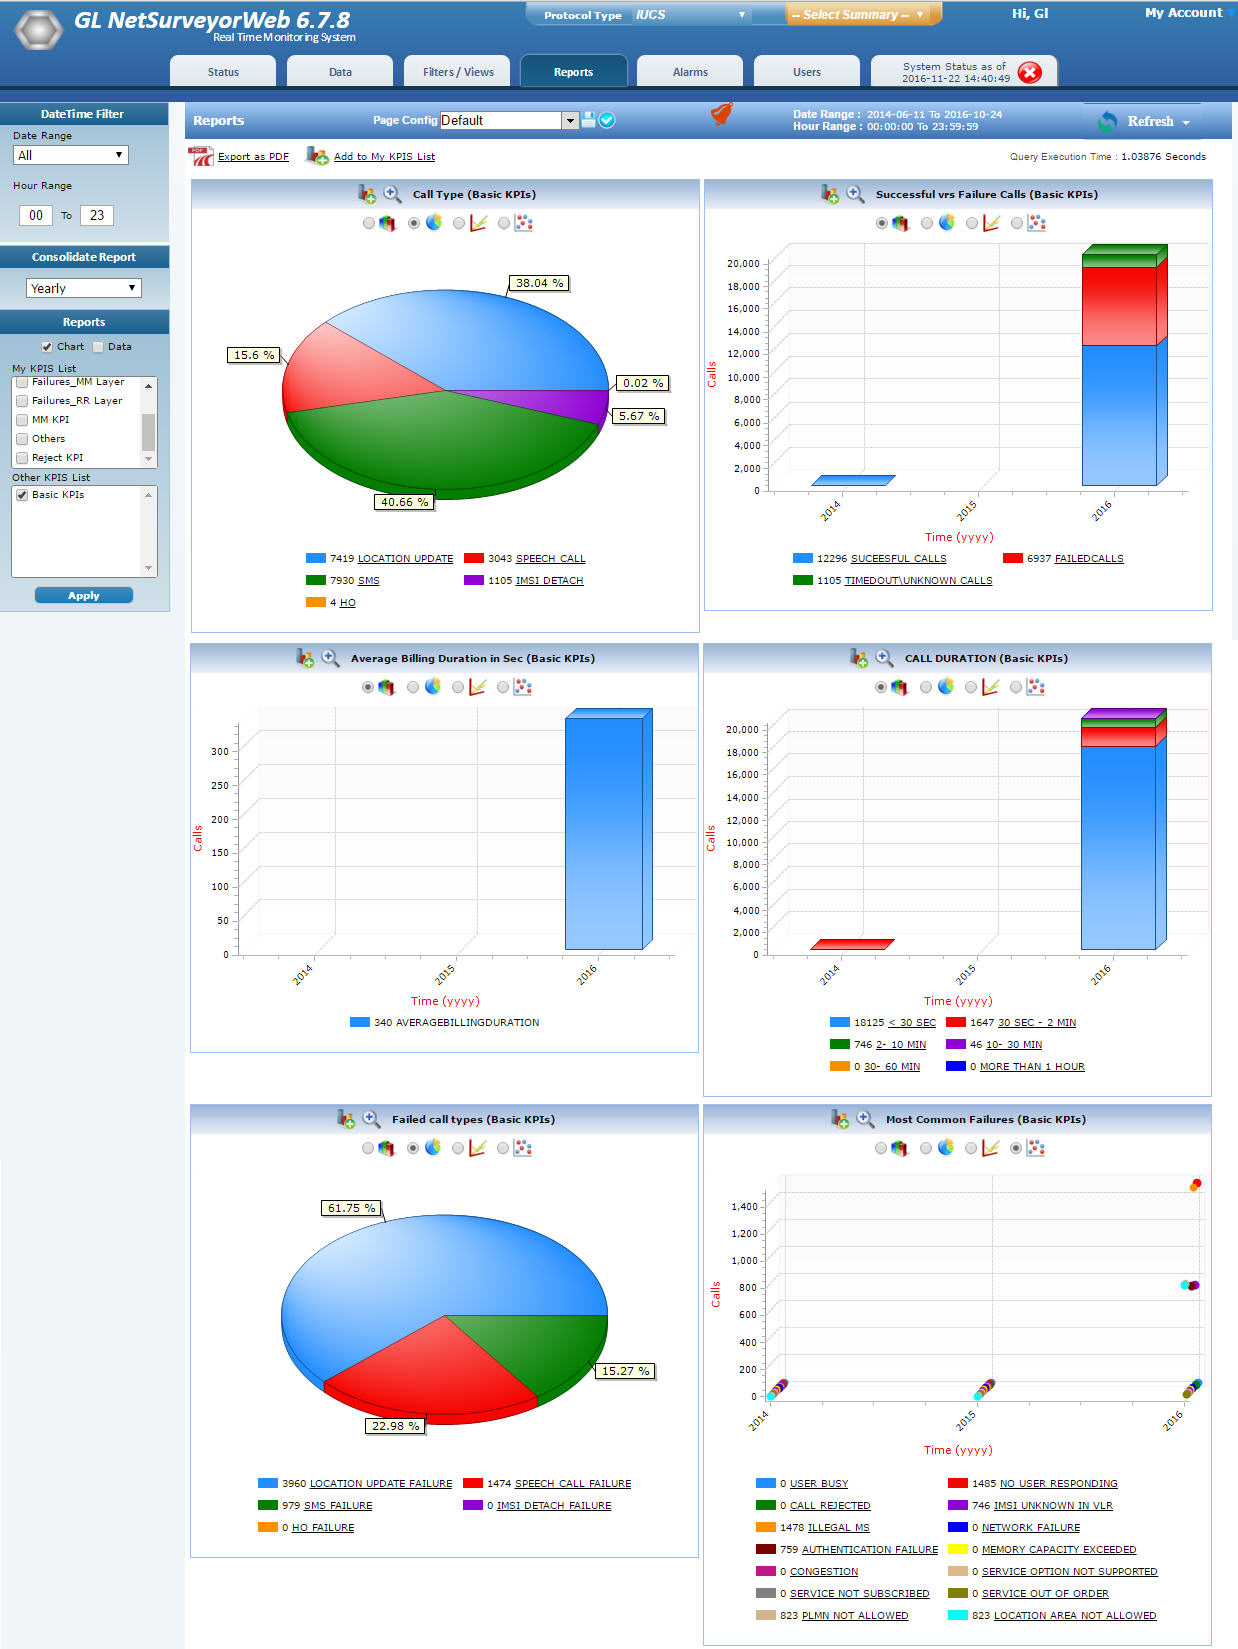
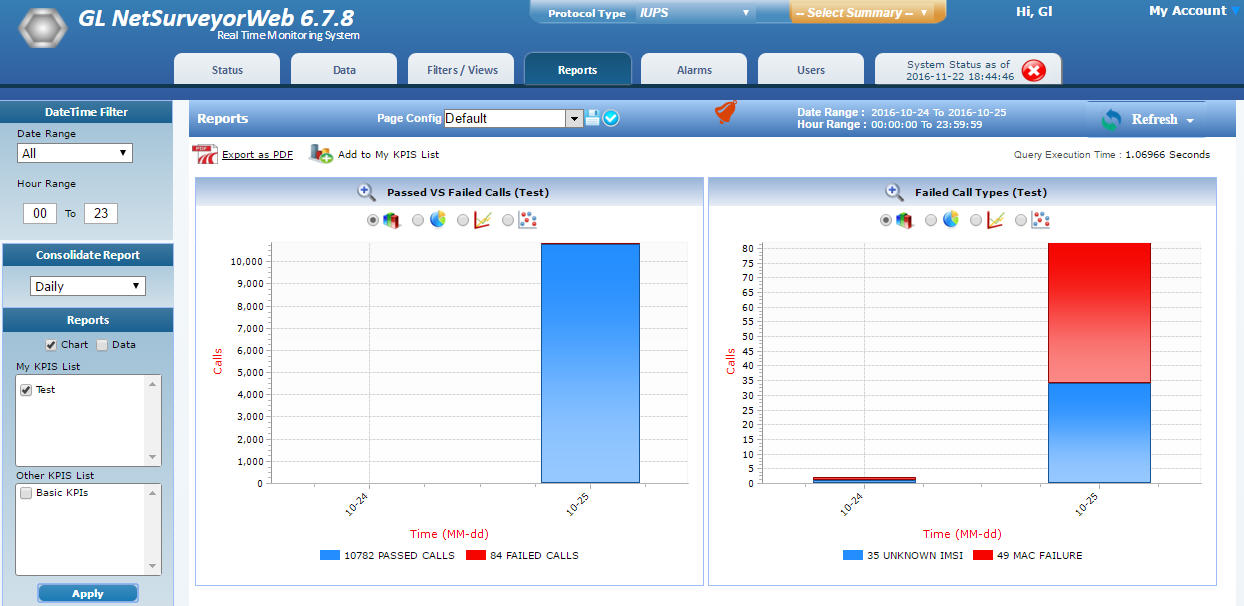
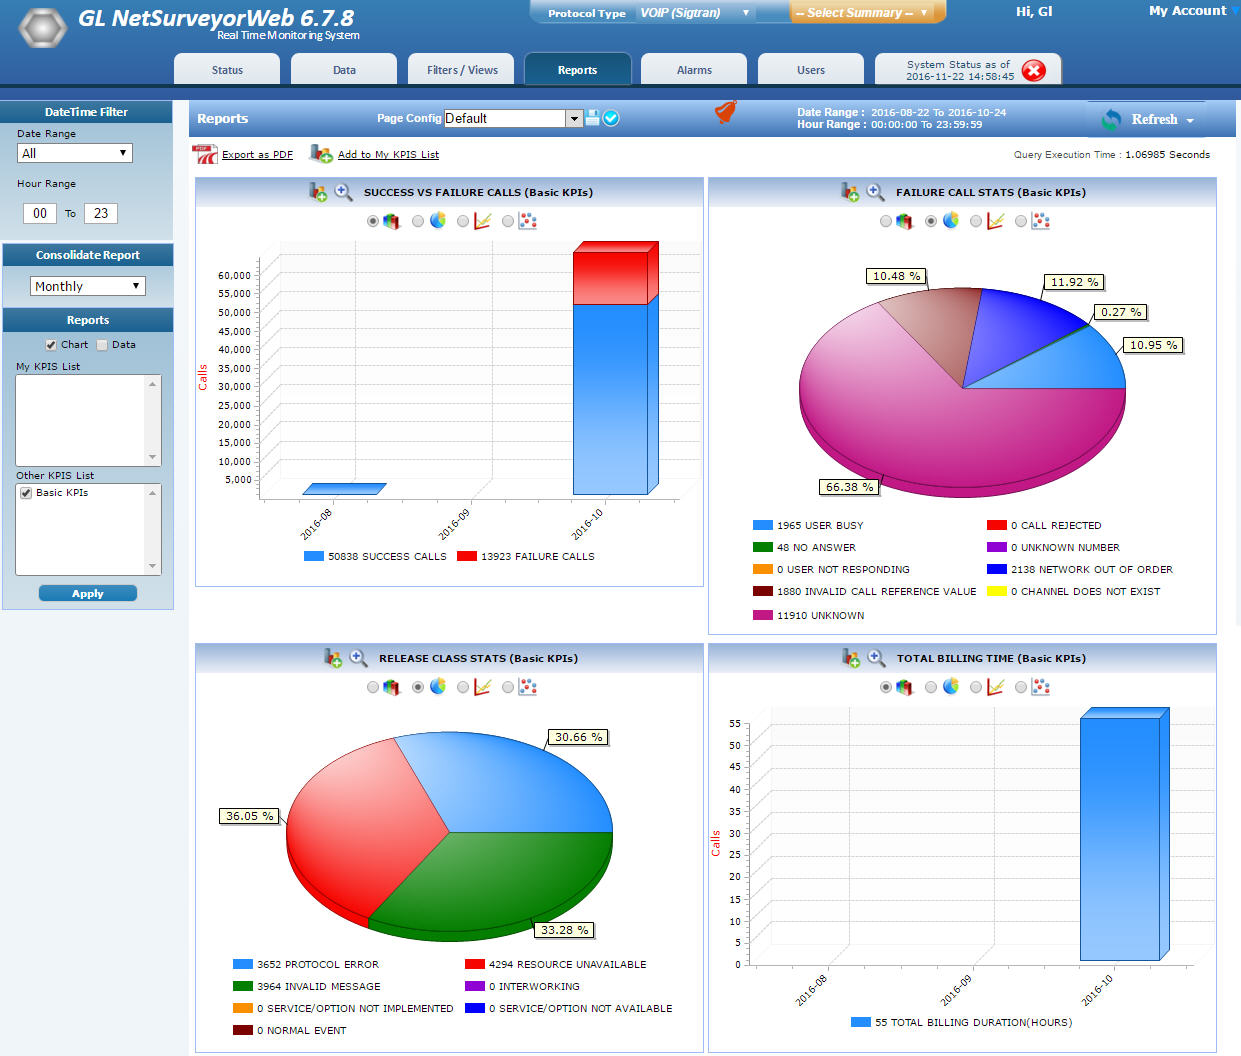
Graphs & Reports
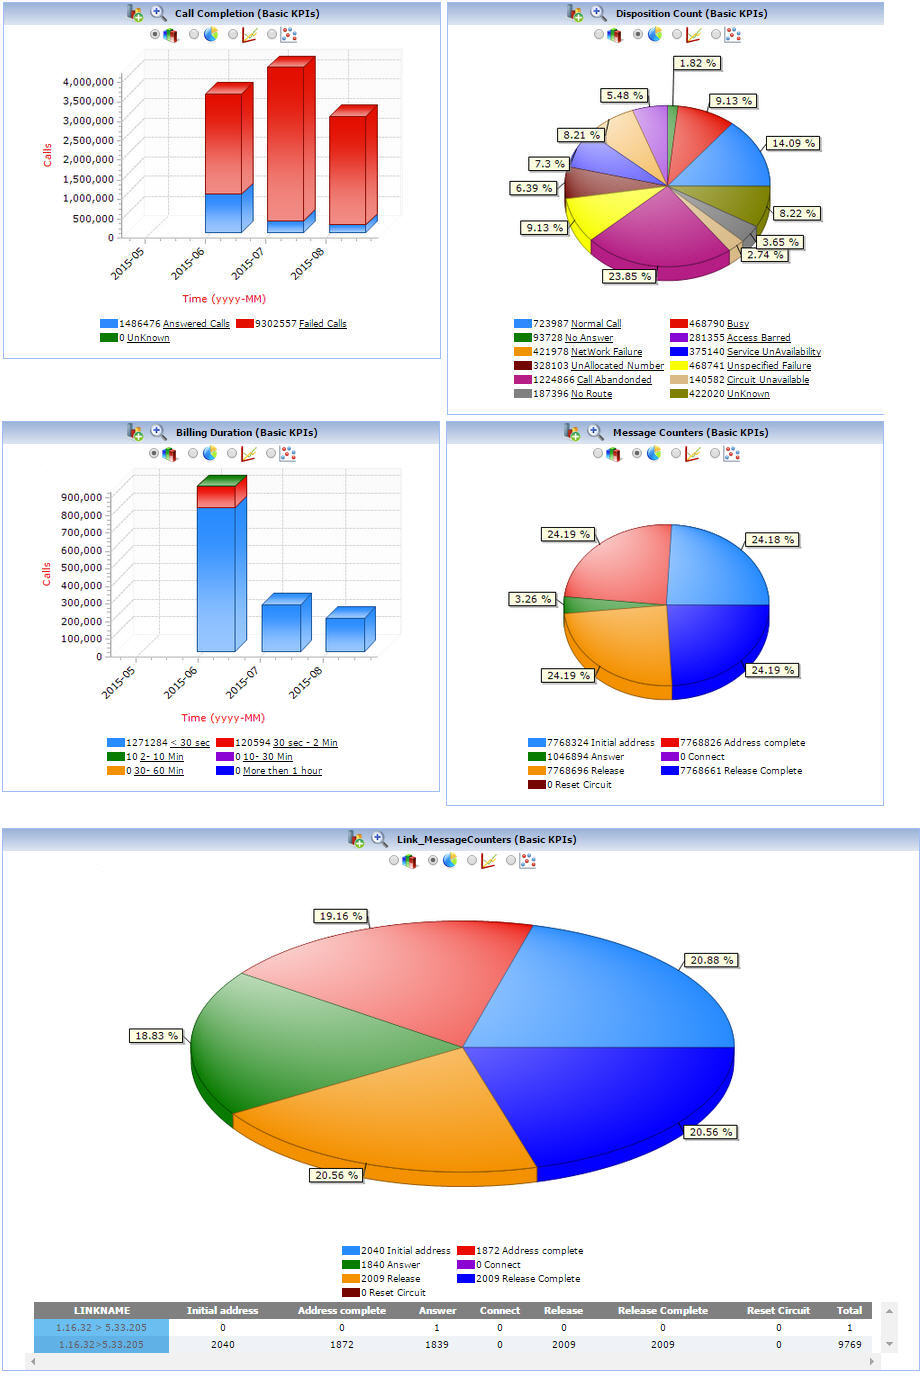
Report provides an overall summary of the captured traffic over the entire network with the help of useful graphs. Such as Link Message Counters, Call Completion, Disposition Count, Billing Duration, and Message Counters
Reports are also available in the form of Bar Graph, Pie Chart, Dot Graph, or tabular format for each of the plotted graph.
Report Configuration
NetSurveyorWeb™ allows users to add new KPIs and customize the reports using Report Configuration feature. Generates customized reports and graphs based on SQL Queries.
Add / Import KPIS
This feature allows user to Add / Import the required KPI to the existing KPI group. This will avoid the user from creating the new KPI as it is readily available. Also, the add option will update the added KPI whenever the user who created this KPI does any modification. The import option will give full permission to the user to edit the KPI as required.
|
|
Resources
Note: PCs which include GL hardware/software require Intel or AMD processors for compliance.
Please Note: The XX in the Item No. refers to the hardware platform, listed at the bottom of the Buyer's Guide, which the software will be running on. Therefore, XX can either be ETA or EEA (Octal/Quad Boards), PTA or PEA (tProbe Units), XUT or XUE (Dual PCIe Express) depending upon the hardware.
| Item No. | Item Description |
PKV169 |
NetsurveyorWeb™ Lite |
PKV170 |
NetsurveyorWeb™ (Perpetual License, Unlimited Users/Nodes) |
|
Options with NetSurveyorWeb™ (PKV170) |
|---|---|
PKV172 |
ISDN Call Detail Record (CDR) Option for Network Surveillance - requires PKV170 |
PKV175 |
T1 E1 Physical Line Monitoring Option for Network Surveillance - requires PKV170 |
PKV173 |
SS7/SIGTRAN Call Detail Record (CDR) Option for Network Surveillance - requires OLV120 or PKV106 at the central site |
PKV174 |
GSM (TDM or IP) & TRAU Call Detail Record (CDR) Option for Network Surveillance - requires OLV150 and OLV153 at the central site. |
PKV176 |
VoIP (SIP, MGCP, Megaco etc.) Call Detail Record (CDR) Option for Network Surveillance - requires PKV101 at the central site |
|
Related Software |
Real-Time ISDN Protocol Analyzer |
|
SS7 Analyzer Software |
|
T1 or E1 Real-time GSM Protocol Analyzer |
|
T1 E1 Real-time TRAU Protocol Analyzer |
|
PacketScan™ - (Online and Offline) |
|
PKV171 |
Network Surveillance Agent Toolkit |
| XX092 | CAS (Channel Associated Signaling) Analyzer |
| XX110 | E1 Real-Time V5.x Protocol Analyzer |
|
Related Hardware |
PacketScan™ HD w/4 x 1GigE |
|
tProbe™ Dual T1 E1 Laptop Analyzer |
|
Dual T1 E1 Express (PCIe) Boards |
|
tScan16™ T1 E1 Boards |
|
QuadXpress T1 E1 Main Board |
|
OctalXpress T1 E1 Main Board plus Daughter Board |