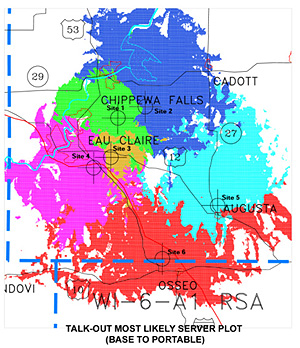
Most Likely Server Plot
Based on the receive signal level calculations for each radio site, this tool predicts the most likely transmitter site which will provide the coverage at a particular point in a prescribed area. This tool is used for two or more radio transmitter locations. Each terrain point for a radio transmitter is assigned a distinct color as long as the receive signal level meets or exceeds a user defined threshold or plot zero (e.g. -95 dBm) as follows:
'+' > -95 dBm Site 1
'+' > -95 dBm Site 2
'+' > -95 dBm Site 3
Based on an underlying propagation model such as Plane Earth Model or Longley Rice Model etc., this tool performs the statistical calculations of receive signal level at each terrain point and compares it to the user defined threshold such as -95 dBm are made for the median field strength. The Most Likely Server Plot results enable the design engineers to determine site specific coverage and allow adjustment of site parameters such as antenna patterns. This plot is a good indicator of hand-off region between sites.
In designing any radio system, a fundamental task is predicting the coverage of a proposed system to determine whether the service objectives are met. An RF propagation plot can be used to predict the coverage area at the desired level of reliability. RF signal propagation is affected by the terrain, buildings, vegetation, and weather conditions. Computer models use terrain and other information to plot the predicted coverage for desired reliability.
Most Likely Server Plot results are obtained separately to evaluate down-link (a.k.a. Talk-Out) for base station to mobile and up-link (a.k.a. Talk-Back) from the mobile to the fixed base station. The predicted receive signal level (a.k.a. RSSI - Received Signal Strength Indicator) is calculated, compared to the threshold and plotted along with the roadmap helps to assess the coverage holes and adjust the systems design parameter accordingly.

The predicted RSSI levels are plotted, allowing the system design engineer to determine the area in which sufficient signal strength will be received. The system can be designed to meet service objectives through choice of base station site, power level, antenna design, etc. Predicted gaps in coverage can be addressed during system design, avoiding costly changes after the system is installed and result in major savings.
For RF Coverage Plotting services, please visit RF Propagation Analysis Tool page and submit your system design parameters by filling out all the applicable fields. We will perform the analysis and the results of your data will be emailed to you within 24 hours.
Please note that currently we are offerring this service on a limited basis for US customers only.